

World population
Encyclopedia
Human
Humans are the only living species in the Homo genus...
s on the planet Earth
Earth
Earth is the third planet from the Sun, and the densest and fifth-largest of the eight planets in the Solar System. It is also the largest of the Solar System's four terrestrial planets...
. As of today, it is estimated to be billion by the United States Census Bureau
United States Census Bureau
The United States Census Bureau is the government agency that is responsible for the United States Census. It also gathers other national demographic and economic data...
. According to a separate estimate by the United Nations
United Nations
The United Nations is an international organization whose stated aims are facilitating cooperation in international law, international security, economic development, social progress, human rights, and achievement of world peace...
, it has already exceeded 7 billion.
The world population has experienced continuous growth
Population growth
Population growth is the change in a population over time, and can be quantified as the change in the number of individuals of any species in a population using "per unit time" for measurement....
since the end of the Great Famine
Great Famine of 1315–1317
The Great Famine of 1315–1317 was the first of a series of large scale crises that struck Northern Europe early in the fourteenth century...
and Black Death
Black Death
The Black Death was one of the most devastating pandemics in human history, peaking in Europe between 1348 and 1350. Of several competing theories, the dominant explanation for the Black Death is the plague theory, which attributes the outbreak to the bacterium Yersinia pestis. Thought to have...
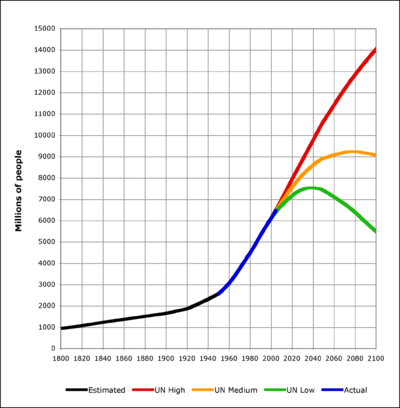
in 1350, when it stood at around 370 million. The highest rates of growth – global increases above 1.8% per year – were seen briefly during the 1950s, and for a longer period during the 1960s and 1970s. The growth rate peaked at 2.2% in 1963, and had declined to 1.1% by 2009. Annual births peaked at 173 million in the late 1990s, and are now expected to remain constant at their 2011 level of 134 million, while deaths number 56 million per year, and are expected to increase to 80 million per year by 2040. Current projections show a continued increase in population (but a steady decline in the population growth rate), with the global population expected to reach between 7.5 and 10.5 billion by 2050.
| World population (millions) | ||||
|---|---|---|---|---|
| # | Top ten most populous | 1990 | 2008 | 2025* |
| 1 | China Demographics of China This article is about the demographic features of the population of China, including population density, ethnicity, education level, health of the populace, economic status, religious affiliations and other aspects of the population.... |
1,141 | 1,333 | 1,458 |
| 2 | India | 849 | 1,140 | 1,398 |
| 3 | US | 250 | 304 | 352 |
| 4 | Indonesia Demographics of Indonesia The population of Indonesia according to the 2010 national census is 237.6 million, with 58% living on the island of Java, the world's most populous island.... |
178 | 228 | 273 |
| 5 | Brazil Demographics of Brazil Brazils population is very diverse, comprising many races and ethnic groups. In general, Brazilians trace their origins from four sources: Amerindians, Europeans, Africans and Asians.... |
150 | 192 | 223 |
| 6 | Pakistan Demographics of Pakistan This article is about the demographic features of the population of Pakistan, including population density, ethnicity, education level, health of the populace, economic status, religious affiliations and other aspects of the population.... |
108 | 166 | 226 |
| 7 | Bangladesh Demographics of Bangladesh This article is about the demographic features of the population of Bangladesh, including population density, ethnicity, health of the populace, economic status, religious affiliations and other aspects of the population.... |
116 | 160 | 198 |
| 8 | Nigeria Demographics of Nigeria This article is about the demographic features of the population of Nigeria, including population density, ethnicity, education level, health of the populace, economic status, religious affiliations and other aspects of the population.... |
94 | 151 | 208 |
| 9 | Russia Demographics of Russia The demographics of Russia is about the demographic features of the population of the Russian Federation, including population growth, population density, ethnic composition, education level, health, economic status, and other aspects of the population.... |
148 | 142 | 137 |
| 10 | Japan Demographics of Japan The demographic features of the population of Japan include population density, ethnicity, education level, health of the populace, economic status, religious affiliations and other aspects of the population.... |
124 | 128 | 126 |
| World total | 5,265 | 6,688 | 8,004 | |
| Top ten most populous (%) | 60.0 % | 58.9 % | 57.5 % | |
| 1 | Asia Demographics of Asia The Demographics of Asia refers to the human population of Asia. The continent covers 29.4% of the Earth's land area and has a population of almost 4 billion - accounting for about 56% of the world population... |
1,613 | 2,183 | 2,693 |
| + China Demographics of China This article is about the demographic features of the population of China, including population density, ethnicity, education level, health of the populace, economic status, religious affiliations and other aspects of the population.... |
1,141 | 1,333 | 1,458 | |
| + OECD Pacific* | 187 | 202 | 210 | |
| 2 | Africa Demographics of Africa The population of Africa has grown exponentially over the past century, and consequently shows a large youth bulge, further reinforced by a low life expectancy of below 50 years in most African countries. The population doubled in the period 1982–2009 and quadrupled from 1955–2009, according to... |
634 | 984 | 1,365 |
| 3 | Europe Demographics of Europe Figures for the population of Europe vary according to which definition of European boundaries is used. The population within the standard physical geographical boundaries was 731 million in 2005 according to the United Nations. In 2010 the population is 857 million, using a definition which... * |
564 | 603 | 659 |
| + Russia Demographics of Russia The demographics of Russia is about the demographic features of the population of the Russian Federation, including population growth, population density, ethnic composition, education level, health, economic status, and other aspects of the population.... |
148 | 142 | 137 | |
| + ex Soviet Union* | 133 | 136 | 146 | |
| 4 | Latin America | 355 | 462 | 550 |
| 5 | North America Demographics of North America In 2011 the population of North America is 459 million, using a definition which includes United States, Mexico, Canada. Population growth is medium , and median age comparatively high in Canada with 41 years and low in Mexico with 27.1 years.-Population:... * |
359 | 444 | 514 |
| 6 | Middle East Demographics of the Middle East Demographics of the Middle East discribes population in the Middle East.The population growth rate in the Middle East is among the highest in the world. The high population growth brings challenges in the Middle East societies. During 1990-2008 the growth rate was higher than e.g. in India or China... |
132 | 199 | 272 |
| Australia Demographics of Australia This article is about the demographic features of the population of Australia, including population density, ethnicity, education level, health of the populace, economic status, religions, and other aspects of the population.... |
17 | 22 | 28 | |
| European Union – 27 states European Union The European Union is an economic and political union of 27 independent member states which are located primarily in Europe. The EU traces its origins from the European Coal and Steel Community and the European Economic Community , formed by six countries in 1958... |
473 | 499 | 539 | |
| US + Canada | 278 | 338 | 392 | |
| Ex Soviet Union Soviet Union The Soviet Union , officially the Union of Soviet Socialist Republics , was a constitutionally socialist state that existed in Eurasia between 1922 and 1991.... |
289 | 285 | 289 | |
| Geographical definitions as in IEA Key Stats 2010 p.66 Notes:
|
||||
Population by region
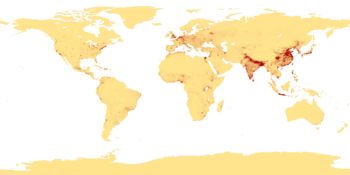
The world's population is unevenly distributed, with six of the world's seven continents being permanently inhabited on a large scale. AsiaAsia
Asia is the world's largest and most populous continent, located primarily in the eastern and northern hemispheres. It covers 8.7% of the Earth's total surface area and with approximately 3.879 billion people, it hosts 60% of the world's current human population...
is the most-populated of Earth's continents, with its 4.1 billion inhabitants accounting for over 60% of the world population. The world's two most-populated countries alone, China
People's Republic of China
China , officially the People's Republic of China , is the most populous country in the world, with over 1.3 billion citizens. Located in East Asia, the country covers approximately 9.6 million square kilometres...
and India
India
India , officially the Republic of India , is a country in South Asia. It is the seventh-largest country by geographical area, the second-most populous country with over 1.2 billion people, and the most populous democracy in the world...
, constitute about 37% of the world's population. Africa
Africa
Africa is the world's second largest and second most populous continent, after Asia. At about 30.2 million km² including adjacent islands, it covers 6% of the Earth's total surface area and 20.4% of the total land area...
is the second-most-populated continent, with around 1 billion people, or 15% of the world's population. Europe
Europe
Europe is, by convention, one of the world's seven continents. Comprising the westernmost peninsula of Eurasia, Europe is generally 'divided' from Asia to its east by the watershed divides of the Ural and Caucasus Mountains, the Ural River, the Caspian and Black Seas, and the waterways connecting...
's 733 million people make up 11% of the world's population, while the Latin America
Latin America
Latin America is a region of the Americas where Romance languages – particularly Spanish and Portuguese, and variably French – are primarily spoken. Latin America has an area of approximately 21,069,500 km² , almost 3.9% of the Earth's surface or 14.1% of its land surface area...
n and Caribbean
Caribbean
The Caribbean is a crescent-shaped group of islands more than 2,000 miles long separating the Gulf of Mexico and the Caribbean Sea, to the west and south, from the Atlantic Ocean, to the east and north...
regions are home to 589 million (9%). Northern America
Northern America
Northern America is the northernmost region of the Americas, and is part of the North American continent. It lies directly north of the region of Middle America; the land border between the two regions coincides with the border between the United States and Mexico...
has a population of around 352 million (5%), and Oceania
Oceania
Oceania is a region centered on the islands of the tropical Pacific Ocean. Conceptions of what constitutes Oceania range from the coral atolls and volcanic islands of the South Pacific to the entire insular region between Asia and the Americas, including Australasia and the Malay Archipelago...
, the least-populated region, has about 35 million inhabitants (0.5%). Though it is not permanently inhabited by any fixed population, Antarctica has a small, fluctuating international population, based mainly in polar science stations. This population tends to rise in the summer months and decrease significantly in winter, as visiting researchers return to their home countries.
Population by continent
| Continent name | Density (inhab./km2) | Population (2011) | Most populous country | Most populous city |
|---|---|---|---|---|
| Asia Asia Asia is the world's largest and most populous continent, located primarily in the eastern and northern hemispheres. It covers 8.7% of the Earth's total surface area and with approximately 3.879 billion people, it hosts 60% of the world's current human population... |
86.7 | 4,140,336,501 |  People's Republic of China (1,341,403,687) People's Republic of China (1,341,403,687) |
 Tokyo TokyoGreater Tokyo Area The Greater Tokyo Area is a large metropolitan area in Kantō region, Japan, consisting of most of the prefectures of Chiba, Kanagawa, Saitama, and Tokyo . In Japanese, it is referred to by various terms, including the , , and others.... (35,676,000) |
| Africa Africa Africa is the world's second largest and second most populous continent, after Asia. At about 30.2 million km² including adjacent islands, it covers 6% of the Earth's total surface area and 20.4% of the total land area... |
32.7 | 994,527,534 |  Nigeria (152,217,341) Nigeria (152,217,341) |
 Cairo CairoCairo Cairo , is the capital of Egypt and the largest city in the Arab world and Africa, and the 16th largest metropolitan area in the world. Nicknamed "The City of a Thousand Minarets" for its preponderance of Islamic architecture, Cairo has long been a centre of the region's political and cultural life... (19,439,541) |
| Europe Europe Europe is, by convention, one of the world's seven continents. Comprising the westernmost peninsula of Eurasia, Europe is generally 'divided' from Asia to its east by the watershed divides of the Ural and Caucasus Mountains, the Ural River, the Caspian and Black Seas, and the waterways connecting... |
70 | 738,523,843 |  Russia (142,905,200) Russia (142,905,200) |
 Moscow MoscowMoscow Moscow is the capital, the most populous city, and the most populous federal subject of Russia. The city is a major political, economic, cultural, scientific, religious, financial, educational, and transportation centre of Russia and the continent... (14,837,510) |
| North America North America North America is a continent wholly within the Northern Hemisphere and almost wholly within the Western Hemisphere. It is also considered a northern subcontinent of the Americas... |
22.9 | 528,720,588 |  United States (308,745,538) United States (308,745,538) |
 Mexico City Mexico CityGreater Mexico City Greater Mexico City refers to the conurbation around Mexico City, officially called Mexico City Metropolitan Area , constituted by the Federal District—itself composed of 16 boroughs—and 41 adjacent municipalities of the states of Mexico and Hidalgo... (21,163,226) |
| South America South America South America is a continent situated in the Western Hemisphere, mostly in the Southern Hemisphere, with a relatively small portion in the Northern Hemisphere. The continent is also considered a subcontinent of the Americas. It is bordered on the west by the Pacific Ocean and on the north and east... |
21.4 | 385,742,554 |  Brazil (190,732,694) Brazil (190,732,694) |
 São Paulo São PauloSão Paulo São Paulo is the largest city in Brazil, the largest city in the southern hemisphere and South America, and the world's seventh largest city by population. The metropolis is anchor to the São Paulo metropolitan area, ranked as the second-most populous metropolitan area in the Americas and among... (19,672,582) |
| Oceania Oceania Oceania is a region centered on the islands of the tropical Pacific Ocean. Conceptions of what constitutes Oceania range from the coral atolls and volcanic islands of the South Pacific to the entire insular region between Asia and the Americas, including Australasia and the Malay Archipelago... |
4.25 | 36,102,071 |  Australia (22,612,355) Australia (22,612,355) |
Sydney Sydney Sydney is the most populous city in Australia and the state capital of New South Wales. Sydney is located on Australia's south-east coast of the Tasman Sea. As of June 2010, the greater metropolitan area had an approximate population of 4.6 million people... (4,575,532) |
| Antarctica | 0 | 4,490 (varies) | N/A | McMurdo Station McMurdo Station McMurdo Station is a U.S. Antarctic research center located on the southern tip of Ross Island, which is in the New Zealand-claimed Ross Dependency on the shore of McMurdo Sound in Antarctica. It is operated by the United States through the United States Antarctic Program, a branch of the National... (955) |
Milestones by the billions
| Population (in billions) |
1 | | 2 | | 3 | | 4 | | 5 | | 6 | | 7 | | 8 | | 9 | |||||||||
|---|---|---|---|---|---|---|---|---|---|---|---|---|---|---|---|---|---|---|
| Year | 1804 | 1927 | 1960 | 1974 | 1987 | 1999 | 2012 | 2027 | 2046 | |||||||||
| Years elapsed | –– | 123 | 33 | 14 | 13 | 12 | 13 | 15 | 19 | |||||||||
It is estimated that the population of the world reached one billion for the first time in 1804. It would be another 122 years before it reached two billion in 1927, but it took only 33 years to rise by another billion people, reaching three billion in 1960. Thereafter, the global population reached four billion in 1974, five billion in 1987, six billion in 1999 and, by some estimates, seven billion in October 2011. However, other estimates hold that the world population will not reach seven billion until early 2012.
According to current projections, the global population will reach eight billion by 2025–2030, and will likely reach around nine billion by 2045–2050. Alternative scenarios for 2050 range from a low of 7.4 billion to a high of more than 10.6 billion. Projected figures vary depending on underlying statistical assumptions and which variables are manipulated in projection calculations, especially the fertility variable. Long-range predictions to 2150 range from a population decline to 3.2 billion in the 'low scenario', to 'high scenarios' of 24.8 billion. One scenario predicts a massive increase to 256 billion by 2150, assuming fertility remains at 1995 levels.
There is no estimation for the exact day or month the world's population surpassed each of the one and two billion marks. The days of three and four billion were not officially noted, but the International Database of the United States Census Bureau places them in July 1959 and April 1974. The United Nations did determine, and celebrate, the "Day of 5 Billion" on 11 July 1987, and the "Day of 6 Billion" on 12 October 1999. The "Day of 7 Billion" was declared by the Population Division of the United Nations to be 31 October 2011.
Regional milestones by the billions
The first of Earth's regions to attain a billion inhabitants was the Northern HemisphereNorthern Hemisphere
The Northern Hemisphere is the half of a planet that is north of its equator—the word hemisphere literally means “half sphere”. It is also that half of the celestial sphere north of the celestial equator...
, followed shortly by the Eastern Hemisphere
Eastern Hemisphere
The Eastern Hemisphere, also Eastern hemisphere or eastern hemisphere, is a geographical term for the half of the Earth that is east of the Prime Meridian and west of 180° longitude. It is also used to refer to Europe, Asia, Africa, and Australasia, vis-à-vis the Western Hemisphere, which includes...
, well before the world total hit two billion. The first single continent to reach this milestone was Asia
Asia
Asia is the world's largest and most populous continent, located primarily in the eastern and northern hemispheres. It covers 8.7% of the Earth's total surface area and with approximately 3.879 billion people, it hosts 60% of the world's current human population...
, followed by the sub-regions of East Asia
East Asia
East Asia or Eastern Asia is a subregion of Asia that can be defined in either geographical or cultural terms...
and South Asia
South Asia
South Asia, also known as Southern Asia, is the southern region of the Asian continent, which comprises the sub-Himalayan countries and, for some authorities , also includes the adjoining countries to the west and the east...
. China
China
Chinese civilization may refer to:* China for more general discussion of the country.* Chinese culture* Greater China, the transnational community of ethnic Chinese.* History of China* Sinosphere, the area historically affected by Chinese culture...
became the first country with a billion inhabitants in 1980, and was followed by India
India
India , officially the Republic of India , is a country in South Asia. It is the seventh-largest country by geographical area, the second-most populous country with over 1.2 billion people, and the most populous democracy in the world...
in 1999. The Western Hemisphere
Western Hemisphere
The Western Hemisphere or western hemisphere is mainly used as a geographical term for the half of the Earth that lies west of the Prime Meridian and east of the Antimeridian , the other half being called the Eastern Hemisphere.In this sense, the western hemisphere consists of the western portions...
reached the one-billion milestone in the 2000s, and the population of Africa
Africa
Africa is the world's second largest and second most populous continent, after Asia. At about 30.2 million km² including adjacent islands, it covers 6% of the Earth's total surface area and 20.4% of the total land area...
reached one billion in 2010. The next areas expected by demographers to exceed one billion inhabitants are the Americas
Americas
The Americas, or America , are lands in the Western hemisphere, also known as the New World. In English, the plural form the Americas is often used to refer to the landmasses of North America and South America with their associated islands and regions, while the singular form America is primarily...
, with a current population of around 920 million, and the Southern Hemisphere
Southern Hemisphere
The Southern Hemisphere is the part of Earth that lies south of the equator. The word hemisphere literally means 'half ball' or "half sphere"...
and Sub-Saharan Africa
Sub-Saharan Africa
Sub-Saharan Africa as a geographical term refers to the area of the African continent which lies south of the Sahara. A political definition of Sub-Saharan Africa, instead, covers all African countries which are fully or partially located south of the Sahara...
, currently each with around 850 million people. It is not known when, or if, Europe
Europe
Europe is, by convention, one of the world's seven continents. Comprising the westernmost peninsula of Eurasia, Europe is generally 'divided' from Asia to its east by the watershed divides of the Ural and Caucasus Mountains, the Ural River, the Caspian and Black Seas, and the waterways connecting...
, Southeast Asia
Southeast Asia
Southeast Asia, South-East Asia, South East Asia or Southeastern Asia is a subregion of Asia, consisting of the countries that are geographically south of China, east of India, west of New Guinea and north of Australia. The region lies on the intersection of geological plates, with heavy seismic...
, or North America
North America
North America is a continent wholly within the Northern Hemisphere and almost wholly within the Western Hemisphere. It is also considered a northern subcontinent of the Americas...
will each surpass 1 billion inhabitants.
Antiquity and Middle Ages
A dramatic population bottleneckPopulation bottleneck
A population bottleneck is an evolutionary event in which a significant percentage of a population or species is killed or otherwise prevented from reproducing....
is theorized for the period around 70,000 BC as a result of the Toba supervolcano eruption
Toba catastrophe theory
The Toba supereruption was a supervolcanic eruption that occurred some time between 69,000 and 77,000 years ago at Lake Toba . It is recognized as one of the Earth's largest known eruptions...
. After this time, and until the development of agriculture
Agriculture
Agriculture is the cultivation of animals, plants, fungi and other life forms for food, fiber, and other products used to sustain life. Agriculture was the key implement in the rise of sedentary human civilization, whereby farming of domesticated species created food surpluses that nurtured the...
around the 11th millennium BC, it is estimated that the world population stabilized at about one million people whose subsistence entailed hunting and foraging
Hunter-gatherer
A hunter-gatherer or forage society is one in which most or all food is obtained from wild plants and animals, in contrast to agricultural societies which rely mainly on domesticated species. Hunting and gathering was the ancestral subsistence mode of Homo, and all modern humans were...
, a lifestyle that by its nature ensured a low population density. The total world population probably never exceeded 15 million inhabitants before the invention of agriculture. By contrast, it is estimated that more than 50–60 million people lived in the combined eastern and western Roman Empire
Roman Empire
The Roman Empire was the post-Republican period of the ancient Roman civilization, characterised by an autocratic form of government and large territorial holdings in Europe and around the Mediterranean....
(AD 300–400).
The plague
Plague of Justinian
The Plague of Justinian was a pandemic that afflicted the Eastern Roman Empire , including its capital Constantinople, in 541–542 AD. It was one of the greatest plagues in history. The most commonly accepted cause of the pandemic is bubonic plague, which later became infamous for either causing or...
which first emerged during the reign of Justinian caused Europe's population
Medieval demography
This article discusses human demography in Europe during the Middle Ages, including population trends and movements. Demographic changes helped to shape and define the Middle Ages...
to drop by around 50% between 541 and the 8th century. The population of Europe was more than 70 million in 1340. The Black Death
Black Death
The Black Death was one of the most devastating pandemics in human history, peaking in Europe between 1348 and 1350. Of several competing theories, the dominant explanation for the Black Death is the plague theory, which attributes the outbreak to the bacterium Yersinia pestis. Thought to have...
pandemic
Pandemic
A pandemic is an epidemic of infectious disease that is spreading through human populations across a large region; for instance multiple continents, or even worldwide. A widespread endemic disease that is stable in terms of how many people are getting sick from it is not a pandemic...
in the 14th century may have reduced the world's population from an estimated 450 million to between 350 and 375 million in 1400. It took roughly 200 years for Europe's population to regain its 1340 level. China experienced a population decline from an estimated 123 million around 1200 to an estimated 65 million in 1393, which was presumably due to a combination of Mongol
Mongol Empire
The Mongol Empire , initially named as Greater Mongol State was a great empire during the 13th and 14th centuries...
invasions and plague.
At the founding of the Ming Dynasty
Ming Dynasty
The Ming Dynasty, also Empire of the Great Ming, was the ruling dynasty of China from 1368 to 1644, following the collapse of the Mongol-led Yuan Dynasty. The Ming, "one of the greatest eras of orderly government and social stability in human history", was the last dynasty in China ruled by ethnic...
in 1368, China
China
Chinese civilization may refer to:* China for more general discussion of the country.* Chinese culture* Greater China, the transnational community of ethnic Chinese.* History of China* Sinosphere, the area historically affected by Chinese culture...
's population was reported to be close to 60 million; toward the end of the dynasty in 1644, it might have approached 150 million. England
England
England is a country that is part of the United Kingdom. It shares land borders with Scotland to the north and Wales to the west; the Irish Sea is to the north west, the Celtic Sea to the south west, with the North Sea to the east and the English Channel to the south separating it from continental...
's population reached an estimated 5.6 million in 1650, up from an estimated 2.6 million in 1500. New crops that had come to Asia
Asia
Asia is the world's largest and most populous continent, located primarily in the eastern and northern hemispheres. It covers 8.7% of the Earth's total surface area and with approximately 3.879 billion people, it hosts 60% of the world's current human population...
and Europe
Europe
Europe is, by convention, one of the world's seven continents. Comprising the westernmost peninsula of Eurasia, Europe is generally 'divided' from Asia to its east by the watershed divides of the Ural and Caucasus Mountains, the Ural River, the Caspian and Black Seas, and the waterways connecting...
from the Americas via the Spanish colonizers in the 16th century are believed to have contributed to population growth. Since being introduced by Portuguese traders in the 16th century, maize
Maize
Maize known in many English-speaking countries as corn or mielie/mealie, is a grain domesticated by indigenous peoples in Mesoamerica in prehistoric times. The leafy stalk produces ears which contain seeds called kernels. Though technically a grain, maize kernels are used in cooking as a vegetable...
and manioc have replaced traditional Africa
Africa
Africa is the world's second largest and second most populous continent, after Asia. At about 30.2 million km² including adjacent islands, it covers 6% of the Earth's total surface area and 20.4% of the total land area...
n crops as the continent’s most important staple food crops. Alfred W. Crosby speculated that increased production of maize, manioc, and other
American crops "...enabled the slave traders [who] drew many, perhaps most, of their cargoes from the rain forest areas, precisely those areas where American crops enabled heavier settlement than
before."
The population of the Americas
Americas
The Americas, or America , are lands in the Western hemisphere, also known as the New World. In English, the plural form the Americas is often used to refer to the landmasses of North America and South America with their associated islands and regions, while the singular form America is primarily...
in 1500 may have been between 50 and 100 million. The pre-Columbian North America
North America
North America is a continent wholly within the Northern Hemisphere and almost wholly within the Western Hemisphere. It is also considered a northern subcontinent of the Americas...
n population probably numbered somewhere between 2 million and 18 million. Encounters between European explorers and populations in the rest of the world often introduced local epidemics of extraordinary virulence. Archaeological evidence indicates that the death of around 90% of the Native American population
Population history of American indigenous peoples
The population figures for Indigenous peoples in the Americas before the 1492 voyage of Christopher Columbus have proven difficult to establish and rely on archaeological data and written records from European settlers...
of the New World
New World
The New World is one of the names used for the Western Hemisphere, specifically America and sometimes Oceania . The term originated in the late 15th century, when America had been recently discovered by European explorers, expanding the geographical horizon of the people of the European middle...
was caused by Old World
Old World
The Old World consists of those parts of the world known to classical antiquity and the European Middle Ages. It is used in the context of, and contrast with, the "New World" ....
diseases such as smallpox
Smallpox
Smallpox was an infectious disease unique to humans, caused by either of two virus variants, Variola major and Variola minor. The disease is also known by the Latin names Variola or Variola vera, which is a derivative of the Latin varius, meaning "spotted", or varus, meaning "pimple"...
, measles, and influenza. Over the centuries, the Europeans had developed high degrees of immunity to these diseases, while the indigenous peoples had no such immunity.
Modern era
British Agricultural Revolution
British Agricultural Revolution describes a period of development in Britain between the 17th century and the end of the 19th century, which saw an epoch-making increase in agricultural productivity and net output. This in turn supported unprecedented population growth, freeing up a significant...
and Industrial Revolution
Industrial Revolution
The Industrial Revolution was a period from the 18th to the 19th century where major changes in agriculture, manufacturing, mining, transportation, and technology had a profound effect on the social, economic and cultural conditions of the times...
s, the life expectancy
Life expectancy
Life expectancy is the expected number of years of life remaining at a given age. It is denoted by ex, which means the average number of subsequent years of life for someone now aged x, according to a particular mortality experience...
of children increased dramatically. The percentage of the children born in London
London
London is the capital city of :England and the :United Kingdom, the largest metropolitan area in the United Kingdom, and the largest urban zone in the European Union by most measures. Located on the River Thames, London has been a major settlement for two millennia, its history going back to its...
who died before the age of five
Infant mortality
Infant mortality is defined as the number of infant deaths per 1000 live births. Traditionally, the most common cause worldwide was dehydration from diarrhea. However, the spreading information about Oral Re-hydration Solution to mothers around the world has decreased the rate of children dying...
decreased from 74.5% in 1730–1749 to 31.8% in 1810–1829. Between 1700 and 1900, Europe
Europe
Europe is, by convention, one of the world's seven continents. Comprising the westernmost peninsula of Eurasia, Europe is generally 'divided' from Asia to its east by the watershed divides of the Ural and Caucasus Mountains, the Ural River, the Caspian and Black Seas, and the waterways connecting...
’s population increased from about 100 million to over 400 million. Altogether, the areas of European settlement comprised 36% of the world's population in 1900.
Population growth in the West became more rapid after the introduction of compulsory vaccination
Vaccination
Vaccination is the administration of antigenic material to stimulate the immune system of an individual to develop adaptive immunity to a disease. Vaccines can prevent or ameliorate the effects of infection by many pathogens...
and improvements in medicine
Medicine
Medicine is the science and art of healing. It encompasses a variety of health care practices evolved to maintain and restore health by the prevention and treatment of illness....
and sanitation
Sanitation
Sanitation is the hygienic means of promoting health through prevention of human contact with the hazards of wastes. Hazards can be either physical, microbiological, biological or chemical agents of disease. Wastes that can cause health problems are human and animal feces, solid wastes, domestic...
. As living conditions and health care improved during the 19th century, the United Kingdom
United Kingdom
The United Kingdom of Great Britain and Northern IrelandIn the United Kingdom and Dependencies, other languages have been officially recognised as legitimate autochthonous languages under the European Charter for Regional or Minority Languages...
's population doubled every fifty years. By 1801 the population of England had grown to 8.3 million, and by 1901 it had reached 30.5 million.
The first half of the 20th century in Russia
Russian Empire
The Russian Empire was a state that existed from 1721 until the Russian Revolution of 1917. It was the successor to the Tsardom of Russia and the predecessor of the Soviet Union...
and the Soviet Union
Soviet Union
The Soviet Union , officially the Union of Soviet Socialist Republics , was a constitutionally socialist state that existed in Eurasia between 1922 and 1991....
were marked by a succession of disasters, each accompanied by large–scale population losses. By the end of World War II
World War II
World War II, or the Second World War , was a global conflict lasting from 1939 to 1945, involving most of the world's nations—including all of the great powers—eventually forming two opposing military alliances: the Allies and the Axis...
in 1945, therefore, the Russian population was about 90 million fewer than it could have been otherwise.
The population of the Indian subcontinent
Indian subcontinent
The Indian subcontinent, also Indian Subcontinent, Indo-Pak Subcontinent or South Asian Subcontinent is a region of the Asian continent on the Indian tectonic plate from the Hindu Kush or Hindu Koh, Himalayas and including the Kuen Lun and Karakoram ranges, forming a land mass which extends...
, which stood at about 125 million in 1750, had reached 389 million by 1941. Today, the region is home to over 1.22 billion people. The total number of inhabitants of Java
Java
Java is an island of Indonesia. With a population of 135 million , it is the world's most populous island, and one of the most densely populated regions in the world. It is home to 60% of Indonesia's population. The Indonesian capital city, Jakarta, is in west Java...
increased from about five million in 1815 to more than 130 million in the early 21st century. Mexico
Mexico
The United Mexican States , commonly known as Mexico , is a federal constitutional republic in North America. It is bordered on the north by the United States; on the south and west by the Pacific Ocean; on the southeast by Guatemala, Belize, and the Caribbean Sea; and on the east by the Gulf of...
's population grew from 13.6 million in 1900 to about 112 million in 2009. Between the 1920s and 2000s, Kenya
Kenya
Kenya , officially known as the Republic of Kenya, is a country in East Africa that lies on the equator, with the Indian Ocean to its south-east...
's population grew from 2.9 million to 37 million.
Overpopulation
The scientific consensusScientific consensus
Scientific consensus is the collective judgment, position, and opinion of the community of scientists in a particular field of study. Consensus implies general agreement, though not necessarily unanimity. Scientific consensus is not by itself a scientific argument, and it is not part of the...
is that the current population expansion
Population growth
Population growth is the change in a population over time, and can be quantified as the change in the number of individuals of any species in a population using "per unit time" for measurement....
and accompanying increase in usage of resources is linked to threats to the ecosystem
Ecosystem
An ecosystem is a biological environment consisting of all the organisms living in a particular area, as well as all the nonliving , physical components of the environment with which the organisms interact, such as air, soil, water and sunlight....
. The InterAcademy Panel Statement on Population Growth
IAP statement on population growth
The InterAcademy Panel Statement on Population Growth is an international scientist consensus document discussing and demanding a halt of the population expansion. This was the first worldwide joint statement of academies of sciences, and their cooperative InterAcademy Panel on International Issues...
, which was ratified by 58 member national academies
National academy
A national academy is an organizational body, usually operating with state financial support and approval, that co-ordinates scholarly research activities and standards for academic disciplines, most frequently in the sciences but also the humanities. Typically the country's learned societies in...
in 1994, called the growth in human numbers "unprecedented", and stated that many environmental problems, such as rising levels of atmospheric carbon dioxide, global warming
Global warming
Global warming refers to the rising average temperature of Earth's atmosphere and oceans and its projected continuation. In the last 100 years, Earth's average surface temperature increased by about with about two thirds of the increase occurring over just the last three decades...
, and pollution
Pollution
Pollution is the introduction of contaminants into a natural environment that causes instability, disorder, harm or discomfort to the ecosystem i.e. physical systems or living organisms. Pollution can take the form of chemical substances or energy, such as noise, heat or light...
, were aggravated by the population expansion. At the time, the world population stood at 5.5 billion, and lower-bound scenarios predicted a peak of 7.8 billion by 2050, a number that current estimates show will be reached around 2030.
Population control
Human population control is the practice of artificially altering the rate of growth of a human population. Historically, human population control has been implemented by limiting the population's birth rateBirth rate
Crude birth rate is the nativity or childbirths per 1,000 people per year . Another word used interchangeably with "birth rate" is "natality". When the crude birth rate is subtracted from the crude death rate, it reveals the rate of natural increase...
, by contraception or by government mandate, and has been undertaken as a response to factors including high or increasing levels of poverty
Poverty
Poverty is the lack of a certain amount of material possessions or money. Absolute poverty or destitution is inability to afford basic human needs, which commonly includes clean and fresh water, nutrition, health care, education, clothing and shelter. About 1.7 billion people are estimated to live...
, environmental concerns
Carrying capacity
The carrying capacity of a biological species in an environment is the maximum population size of the species that the environment can sustain indefinitely, given the food, habitat, water and other necessities available in the environment...
, religious reasons
Religion
Religion is a collection of cultural systems, belief systems, and worldviews that establishes symbols that relate humanity to spirituality and, sometimes, to moral values. Many religions have narratives, symbols, traditions and sacred histories that are intended to give meaning to life or to...
, and overpopulation
Overpopulation
Overpopulation is a condition where an organism's numbers exceed the carrying capacity of its habitat. The term often refers to the relationship between the human population and its environment, the Earth...
. The use of abortion
Abortion
Abortion is defined as the termination of pregnancy by the removal or expulsion from the uterus of a fetus or embryo prior to viability. An abortion can occur spontaneously, in which case it is usually called a miscarriage, or it can be purposely induced...
in some strategies has made human population control a controversial issue, with organisations such as the Roman Catholic Church
Roman Catholic Church
The Catholic Church, also known as the Roman Catholic Church, is the world's largest Christian church, with over a billion members. Led by the Pope, it defines its mission as spreading the gospel of Jesus Christ, administering the sacraments and exercising charity...
explicitly opposing the artificial limitation of the human population.
Largest populations by country
| Rank | Country / Territory | Population | Date | % of world population |
Source |
|---|---|---|---|---|---|
| 1 | People's Republic of China |
Chinese Official Population Clock | |||
| 2 |  India India |
1,203,710,000 | March 2011 | 17% | Census of India Organisation |
| 3 | United States |
United States Official Population Clock | |||
| 4 |  Indonesia Indonesia |
238,400,000 | May 2010 | % | SuluhNusantara Indonesia Census report |
| 5 | Brazil |
, | % | Brazilian Official Population Clock | |
| 6 |  Pakistan Pakistan |
Official Pakistani Population Clock | |||
| 7 |  Bangladesh Bangladesh |
158,570,535 | July 2011 | % | 2011 CIA World Factbook estimate |
| 8 | Nigeria |
155,215,000 | July 2011 | % | 2011 CIA World Factbook estimate |
| 9 | Russia |
141,927,297 | January 1, 2010 | % | Federal State Statistics Service of Russia |
| 10 |  Japan Japan |
127,380,000 | June 1, 2010 | % | Official Japan Statistics Bureau |
Approximately 4.03 billion people live in these ten countries, representing 58.7% of the world's population as of November 2010.
Most densely populated countries
| Rank | Country/Region | Population | Area (km2) | Density (Pop per km2) | Notes |
|---|---|---|---|---|---|
| 1 |  Singapore Singapore |
5,183,700 | 707.1 | 7,331 | |
| 2 | Bangladesh |
142,325,250 | 147,570 | 1,069 | |
| 3 |  Mauritius Mauritius |
1,288,000 | 2,040 | ||
| 4 |  Palestinian territories Palestinian territories |
4,223,760 | 6,020 | 702 | |
| 5 |  Republic of China (Taiwan) Republic of China (Taiwan) |
22,955,395 | 36,190 | 640 | |
| 6 |  South Korea South Korea |
48,456,369 | 99,538 | ||
| 7 |  Lebanon Lebanon |
4,224,000 | 10,452 | ||
| 8 |  Netherlands Netherlands |
||||
| 9 |  Rwanda Rwanda |
9,998,000 | 26,338 | ||
| 10 |  Israel Israel |
7,697,600 | 20,770 |
| Country | Population | Area (km2) | Density (Pop. per km2) | Notes |
|---|---|---|---|---|
| India |
Growing country | |||
| Bangladesh |
142,325,250 | 143,998 | 1,069 | Fast-growing country |
| Japan |
127,170,110 | 377,873 | 337 | Declining in population |
 Philippines Philippines |
94,013,200 | 300,076 | 313 | Fast-growing country |
 Vietnam Vietnam |
85,789,573 | 331,689 | 259 | Growing country |
 United Kingdom United Kingdom |
62,041,708 | 243,610 | 255 | Growing country |
| South Korea |
49,354,980 | 99,538 | 493 | Steady in population |
| Republic of China (Taiwan) |
22,955,395 | 35,980 | 640 | Steady in population |
 Sri Lanka Sri Lanka |
20,238,000 | 65,610 | 309 | Growing country |
| Netherlands |
Steady in population |
Demographics
As of 2011, the global sex ratioSex ratio
Sex ratio is the ratio of males to females in a population. The primary sex ratio is the ratio at the time of conception, secondary sex ratio is the ratio at time of birth, and tertiary sex ratio is the ratio of mature organisms....
is approximately 1.01 males to 1 woman – the slightly higher number of men is possibly due to the gender imbalances evident in the Indian and Chinese populations. Approximately 26.3% of the global population is aged under 15, while 65.9% is aged 15-64 and 7.9% is aged 65 or over. The global average life expectancy is 67.07 years, with women living an average of 69 years and men approximately 65 years. 83% of the world's over-15s are considered literate.
The Han Chinese
Han Chinese
Han Chinese are an ethnic group native to China and are the largest single ethnic group in the world.Han Chinese constitute about 92% of the population of the People's Republic of China , 98% of the population of the Republic of China , 78% of the population of Singapore, and about 20% of the...
are the world's largest ethnic group, constituting over 19% of the global population. The world's most-spoken first language
First language
A first language is the language a person has learned from birth or within the critical period, or that a person speaks the best and so is often the basis for sociolinguistic identity...
s are Mandarin Chinese (spoken by 12.44% of the world's population), Spanish
Spanish language
Spanish , also known as Castilian , is a Romance language in the Ibero-Romance group that evolved from several languages and dialects in central-northern Iberia around the 9th century and gradually spread with the expansion of the Kingdom of Castile into central and southern Iberia during the...
(4.85%), English
English language
English is a West Germanic language that arose in the Anglo-Saxon kingdoms of England and spread into what was to become south-east Scotland under the influence of the Anglian medieval kingdom of Northumbria...
(4.83%), Arabic
Arabic language
Arabic is a name applied to the descendants of the Classical Arabic language of the 6th century AD, used most prominently in the Quran, the Islamic Holy Book...
(3.25%) and Hindi (2.68%). The world's largest religion is Christianity
Christianity
Christianity is a monotheistic religion based on the life and teachings of Jesus as presented in canonical gospels and other New Testament writings...
, whose adherents account for 33.35% of the global population; Islam
Islam
Islam . The most common are and . : Arabic pronunciation varies regionally. The first vowel ranges from ~~. The second vowel ranges from ~~~...
is the second-largest, accounting for 22.43%, and Hinduism
Hinduism
Hinduism is the predominant and indigenous religious tradition of the Indian Subcontinent. Hinduism is known to its followers as , amongst many other expressions...
the third, accounting for 13.78%.
Growth
.svg.png)
Population growth
Population growth is the change in a population over time, and can be quantified as the change in the number of individuals of any species in a population using "per unit time" for measurement....
. According to the United Nations, the growth in population of the different regions of the world from 2000 to 2005 was:
- 227.771 million in AsiaAsiaAsia is the world's largest and most populous continent, located primarily in the eastern and northern hemispheres. It covers 8.7% of the Earth's total surface area and with approximately 3.879 billion people, it hosts 60% of the world's current human population...
. - 92.293 million in AfricaAfricaAfrica is the world's second largest and second most populous continent, after Asia. At about 30.2 million km² including adjacent islands, it covers 6% of the Earth's total surface area and 20.4% of the total land area...
. - 38.052 million in Latin AmericaLatin AmericaLatin America is a region of the Americas where Romance languages – particularly Spanish and Portuguese, and variably French – are primarily spoken. Latin America has an area of approximately 21,069,500 km² , almost 3.9% of the Earth's surface or 14.1% of its land surface area...
. - 16.241 million in Northern AmericaNorthern AmericaNorthern America is the northernmost region of the Americas, and is part of the North American continent. It lies directly north of the region of Middle America; the land border between the two regions coincides with the border between the United States and Mexico...
. - 3.264 million in EuropeEuropeEurope is, by convention, one of the world's seven continents. Comprising the westernmost peninsula of Eurasia, Europe is generally 'divided' from Asia to its east by the watershed divides of the Ural and Caucasus Mountains, the Ural River, the Caspian and Black Seas, and the waterways connecting...
. - 1.955 million in OceaniaOceaniaOceania is a region centered on the islands of the tropical Pacific Ocean. Conceptions of what constitutes Oceania range from the coral atolls and volcanic islands of the South Pacific to the entire insular region between Asia and the Americas, including Australasia and the Malay Archipelago...
. - 383.047 million in the entire world.
During the 20th century, the world saw the greatest increase in its population in human history. This was due to a number of factors, including the lessening of the mortality rate
Mortality rate
Mortality rate is a measure of the number of deaths in a population, scaled to the size of that population, per unit time...
in many countries by improved sanitation and medical advances, and a massive increase in agricultural productivity attributed to the Green Revolution
Green Revolution
Green Revolution refers to a series of research, development, and technology transfer initiatives, occurring between the 1940s and the late 1970s, that increased agriculture production around the world, beginning most markedly in the late 1960s....
.
In 2000, the United Nations
United Nations
The United Nations is an international organization whose stated aims are facilitating cooperation in international law, international security, economic development, social progress, human rights, and achievement of world peace...
estimated that the world's population was growing at an annual rate of 1.14% (equivalent to around 75 million people), down from a peak of 88 million per year in 1989. By 2000, there were approximately ten times as many people on Earth as there had been in 1700. According to data from the CIA's 2005–2006 World Factbooks
The World Factbook
The World Factbook is a reference resource produced by the Central Intelligence Agency of the United States with almanac-style information about the countries of the world. The official paper copy version is available from the National Technical Information Service and the Government Printing Office...
, the world human population increased by an average of 203,800 people every day in the mid-2000s. The CIA Factbook increased this to 211,090 people every day in 2007, and again to 220,980 people every day in 2009.

Population growth
Population growth is the change in a population over time, and can be quantified as the change in the number of individuals of any species in a population using "per unit time" for measurement....
has been steadily declining from its peak of 2.19% in 1963, but growth remains high in Latin America
Latin America
Latin America is a region of the Americas where Romance languages – particularly Spanish and Portuguese, and variably French – are primarily spoken. Latin America has an area of approximately 21,069,500 km² , almost 3.9% of the Earth's surface or 14.1% of its land surface area...
, the Middle East
Middle East
The Middle East is a region that encompasses Western Asia and Northern Africa. It is often used as a synonym for Near East, in opposition to Far East...
and Sub-Saharan Africa
Sub-Saharan Africa
Sub-Saharan Africa as a geographical term refers to the area of the African continent which lies south of the Sahara. A political definition of Sub-Saharan Africa, instead, covers all African countries which are fully or partially located south of the Sahara...
.
In some countries, there is negative population growth (i.e. net
Net (economics)
In economics, net means after deductions. A related concept is gross, meaning before deductions.Nett is an alternative spelling used in British English.-Usage:...
decrease in population over time), especially in Central
Central Europe
Central Europe or alternatively Middle Europe is a region of the European continent lying between the variously defined areas of Eastern and Western Europe...
and Eastern Europe
Eastern Europe
Eastern Europe is the eastern part of Europe. The term has widely disparate geopolitical, geographical, cultural and socioeconomic readings, which makes it highly context-dependent and even volatile, and there are "almost as many definitions of Eastern Europe as there are scholars of the region"...
– this is mainly due to low fertility rates. During the 2010s, Japan
Japan
Japan is an island nation in East Asia. Located in the Pacific Ocean, it lies to the east of the Sea of Japan, China, North Korea, South Korea and Russia, stretching from the Sea of Okhotsk in the north to the East China Sea and Taiwan in the south...
and some countries in Western Europe
Western Europe
Western Europe is a loose term for the collection of countries in the western most region of the European continents, though this definition is context-dependent and carries cultural and political connotations. One definition describes Western Europe as a geographic entity—the region lying in the...
are also expected to encounter negative population growth, due to sub-replacement fertility
Sub-replacement fertility
Sub-replacement fertility is a total fertility rate that leads to each new generation being less populous than the previous one in a given area. In developed countries sub-replacement fertility is any rate below approximately 2.1 children born per woman, but the threshold can be as high as 3.4...
rates.
In 2006, the United Nations
United Nations
The United Nations is an international organization whose stated aims are facilitating cooperation in international law, international security, economic development, social progress, human rights, and achievement of world peace...
stated that the rate of population growth is diminishing due to the ongoing global demographic transition
Demographic transition
The demographic transition model is the transition from high birth and death rates to low birth and death rates as a country develops from a pre-industrial to an industrialized economic system. The theory is based on an interpretation of demographic history developed in 1929 by the American...
. If this trend continues, the rate of growth may diminish to zero by 2050, concurrent with a world population plateau of 9.2 billion. However, this is only one of many estimates published by the UN. In 2009, UN population projections for 2050 ranged from about 8 billion to 10.5 billion.
Forecasts
| Year | UN est (millions) |
Diff. | US est (millions) |
Diff. |
|---|---|---|---|---|
| 2000 | 6,123 | – | 6,090 | – |
| 2010 | 6,896 | 773 | 6,852 | 763 |
| 2020 | 7,657 | 761 | 7,593 | 740 |
| 2030 | 8,321 | 665 | 8,249 | 656 |
| 2040 | 8,874 | 553 | 8,801 | 552 |
| 2050 | 9,306 | 432 | 9,256 | 456 |
In the long run, the future population growth of the world is difficult to predict. The United Nations
United Nations
The United Nations is an international organization whose stated aims are facilitating cooperation in international law, international security, economic development, social progress, human rights, and achievement of world peace...
and the US Census Bureau both give different estimates. According to the latter, world population will hit seven billion in July 2012, while the UN asserted that this occurred in late 2011.
Average global birth rates are declining slightly, but vary greatly between developed countries (where birth rates are often at or below replacement levels) and developing countries (where birth rates typically remain high). Different ethnicities also display varying birth rates. Death rates can change unexpectedly due to disease, wars and other mass catastrophes, or advances in medicine.
The UN has issued multiple projections of future world population, based on different assumptions. From 2000 to 2005, the UN consistently revised these projections downward, until the 2006 revision, issued on March 14, 2007, revised the 2050 mid-range estimate upwards by 273 million.
According to some scenarios, disasters triggered by the growing population's demand for scarce resources will eventually lead to a sudden population crash, or even a Malthusian catastrophe
Malthusian catastrophe
A Malthusian catastrophe was originally foreseen to be a forced return to subsistence-level conditions once population growth had outpaced agricultural production...
, where overpopulation
Overpopulation
Overpopulation is a condition where an organism's numbers exceed the carrying capacity of its habitat. The term often refers to the relationship between the human population and its environment, the Earth...
would compromise global food security
Food security
Food security refers to the availability of food and one's access to it. A household is considered food-secure when its occupants do not live in hunger or fear of starvation. According to the World Resources Institute, global per capita food production has been increasing substantially for the past...
, leading to mass starvation.
| Year | World | Asia | Africa | Europe | Latin America | Northern America | Oceania |
|---|---|---|---|---|---|---|---|
| 2000 | 6,115 | 3,698 (60.5%) | 819 (13.4%) | 727 (11.9%) | 521 (8.5%) | 319 (5.2%) | 31 (0.5%) |
| 2005 | 6,512 | 3,937 (60.5%) | 921 (14.1%) | 729 (11.2%) | 557 (8.6%) | 335 (5.1%) | 34 (0.5%) |
| 2010 | 6,909 | 4,167 (60.3%) | 1,033 (15.0%) | 733 (10.6%) | 589 (8.5%) | 352 (5.1%) | 36 (0.5%) |
| 2015 | 7,302 | 4,391 (60.1%) | 1,153 (15.8%) | 734 (10.1%) | 618 (8.5%) | 368 (5.0%) | 38 (0.5%) |
| 2020 | 7,675 | 4,596 (59.9%) | 1,276 (16.6%) | 733 (9.6%) | 646 (8.4%) | 383 (5.0%) | 40 (0.5%) |
| 2025 | 8,012 | 4,773 (59.6%) | 1,400 (17.5%) | 729 (9.1%) | 670 (8.4%) | 398 (5.0%) | 43 (0.5%) |
| 2030 | 8,309 | 4,917 (59.2%) | 1,524 (18.3%) | 723 (8.7%) | 690 (8.3%) | 410 (4.9%) | 45 (0.5%) |
| 2035 | 8,571 | 5,032 (58.7%) | 1,647 (19.2%) | 716 (8.4%) | 706 (8.2%) | 421 (4.9%) | 46 (0.5%) |
| 2040 | 8,801 | 5,125 (58.2%) | 1,770 (20.1%) | 708 (8.0%) | 718 (8.2%) | 431 (4.9%) | 48 (0.5%) |
| 2045 | 8,996 | 5,193 (57.7%) | 1,887 (21.0%) | 700 (7.8%) | 726 (8.1%) | 440 (4.9%) | 50 (0.6%) |
| 2050 | 9,150 | 5,231 (57.2%) | 1,998 (21.8%) | 691 (7.6%) | 729 (8.0%) | 448 (4.9%) | 51 (0.6%) |
Growth in population by region
The table below shows historical and predicted regional population figures in millions. The availability of historical population figures varies by region.| Region | 1500 | 1600 | 1700 | 1750 | 1800 | 1850 | 1900 | 1950 | 1999 | 2008 | 2050 | 2150 |
|---|---|---|---|---|---|---|---|---|---|---|---|---|
| World | 458 | 580 | 682 | 791 | 978 | 1,262 | 1,650 | 2,521 | 5,978 | 6,707 | 8,909 | 9,746 |
| Africa | 86 | 114 | 106 | 106 | 107 | 111 | 133 | 221 | 767 | 973 | 1,766 | 2,308 |
| Asia | 243 | 339 | 436 | 502 | 635 | 809 | 947 | 1,402 | 3,634 | 4,054 | 5,268 | 5,561 |
| Europe | 84 | 111 | 125 | 163 | 203 | 276 | 408 | 547 | 729 | 732 | 628 | 517 |
| 39 | 10 | 10 | 16 | 24 | 38 | 74 | 167 | 511 | 577 | 809 | 912 | |
| 3 | 3 | 2 | 2 | 7 | 26 | 82 | 172 | 307 | 337 | 392 | 398 | |
| Oceania | 3 | 3 | 3 | 2 | 2 | 2 | 6 | 13 | 30 | 34 | 46 | 51 |
| Region | 1500 | 1600 | 1700 | 1750 | 1800 | 1850 | 1900 | 1950 | 1999 | 2008 | 2050 | 2150 |
|---|---|---|---|---|---|---|---|---|---|---|---|---|
| World | 100 | 100 | 100 | 100 | 100 | 100 | 100 | 100 | 100 | 100 | 100 | 100 |
| Africa | 18.8 | 19.7 | 15.5 | 13.4 | 10.9 | 8.8 | 8.1 | 8.8 | 12.8 | 14.5 | 19.8 | 23.7 |
| Asia | 53.1 | 58.4 | 63.9 | 63.5 | 64.9 | 64.1 | 57.4 | 55.6 | 60.8 | 60.4 | 59.1 | 57.1 |
| Europe | 18.3 | 19.1 | 18.3 | 20.6 | 20.8 | 21.9 | 24.7 | 21.7 | 12.2 | 10.9 | 7.0 | 5.3 |
| 8.5 | 1.7 | 1.5 | 2.0 | 2.5 | 3.0 | 4.5 | 6.6 | 8.5 | 8.6 | 9.1 | 9.4 | |
| 0.7 | 0.5 | 0.3 | 0.3 | 0.7 | 2.1 | 5.0 | 6.8 | 5.1 | 5.0 | 4.4 | 4.1 | |
| Oceania | 0.7 | 0.5 | 0.4 | 0.3 | 0.2 | 0.2 | 0.4 | 0.5 | 0.5 | 0.5 | 0.5 | 0.5 |
| Year | World | Africa Africa Africa is the world's second largest and second most populous continent, after Asia. At about 30.2 million km² including adjacent islands, it covers 6% of the Earth's total surface area and 20.4% of the total land area... |
Asia Asia Asia is the world's largest and most populous continent, located primarily in the eastern and northern hemispheres. It covers 8.7% of the Earth's total surface area and with approximately 3.879 billion people, it hosts 60% of the world's current human population... |
Europe Europe Europe is, by convention, one of the world's seven continents. Comprising the westernmost peninsula of Eurasia, Europe is generally 'divided' from Asia to its east by the watershed divides of the Ural and Caucasus Mountains, the Ural River, the Caspian and Black Seas, and the waterways connecting... |
Latin America Latin America Latin America is a region of the Americas where Romance languages – particularly Spanish and Portuguese, and variably French – are primarily spoken. Latin America has an area of approximately 21,069,500 km² , almost 3.9% of the Earth's surface or 14.1% of its land surface area... |
Northern America Northern America Northern America is the northernmost region of the Americas, and is part of the North American continent. It lies directly north of the region of Middle America; the land border between the two regions coincides with the border between the United States and Mexico... |
Oceania Oceania Oceania is a region centered on the islands of the tropical Pacific Ocean. Conceptions of what constitutes Oceania range from the coral atolls and volcanic islands of the South Pacific to the entire insular region between Asia and the Americas, including Australasia and the Malay Archipelago... |
Notes |
|---|---|---|---|---|---|---|---|---|
| 70,000 BC | < 0.015 | |||||||
| 10,000 BC | 1 | |||||||
| 9000 BC | 3 | |||||||
| 8000 BC | 5 | |||||||
| 7000 BC | 7 | |||||||
| 6000 BC | 10 | |||||||
| 5000 BC | 15 | |||||||
| 4000 BC | 20 | |||||||
| 3000 BC | 25 | |||||||
| 2000 BC | 35 | |||||||
| 1000 BC | 50 | |||||||
| 500 BC | 100 | |||||||
| AD 1 | 200 | |||||||
| 1000 | 310 | |||||||
| 1750 | 791 | 106 | 502 | 163 | 16 | 2 | 2 | |
| 1800 | 978 | 107 | 635 | 203 | 24 | 7 | 2 | |
| 1850 | 1,262 | 111 | 809 | 276 | 38 | 26 | 2 | |
| 1900 | 1,650 | 133 | 947 | 408 | 74 | 82 | 6 | |
| 1950 | 2,519 | 221 | 1,398 | 547 | 167 | 172 | 12.8 | |
| 1955 | 2,756 | 247 | 1,542 | 575 | 191 | 187 | 14.3 | |
| 1960 | 2,982 | 277 | 1,674 | 601 | 209 | 204 | 15.9 | |
| 1965 | 3,335 | 314 | 1,899 | 634 | 250 | 219 | 17.6 | |
| 1970 | 3,692 | 357 | 2,143 | 656 | 285 | 232 | 19.4 | |
| 1975 | 4,068 | 408 | 2,397 | 675 | 322 | 243 | 21.5 | |
| 1980 | 4,435 | 470 | 2,632 | 692 | 361 | 256 | 22.8 | |
| 1985 | 4,831 | 542 | 2,887 | 706 | 401 | 269 | 24.7 | |
| 1990 | 5,263 | 622 | 3,168 | 721 | 441 | 283 | 26.7 | |
| 1995 | 5,674 | 707 | 3,430 | 727 | 481 | 299 | 28.9 | |
| 2000 | 6,070 | 796 | 3,680 | 728 | 520 | 316 | 31.0 | |
| 2005 | 6,454 | 888 | 3,917 | 725 | 558 | 332 | 32.9 | |
| 2010 | 6,972 | 1,022 | 4,252 | 732 | 580 | 351 | 35.6 | http://www.xist.org/earth/pop_region.aspx |
| Year | World | Africa Africa Africa is the world's second largest and second most populous continent, after Asia. At about 30.2 million km² including adjacent islands, it covers 6% of the Earth's total surface area and 20.4% of the total land area... |
Asia Asia Asia is the world's largest and most populous continent, located primarily in the eastern and northern hemispheres. It covers 8.7% of the Earth's total surface area and with approximately 3.879 billion people, it hosts 60% of the world's current human population... |
Europe Europe Europe is, by convention, one of the world's seven continents. Comprising the westernmost peninsula of Eurasia, Europe is generally 'divided' from Asia to its east by the watershed divides of the Ural and Caucasus Mountains, the Ural River, the Caspian and Black Seas, and the waterways connecting... |
Latin America Latin America Latin America is a region of the Americas where Romance languages – particularly Spanish and Portuguese, and variably French – are primarily spoken. Latin America has an area of approximately 21,069,500 km² , almost 3.9% of the Earth's surface or 14.1% of its land surface area... |
Northern America Northern America Northern America is the northernmost region of the Americas, and is part of the North American continent. It lies directly north of the region of Middle America; the land border between the two regions coincides with the border between the United States and Mexico... |
Oceania Oceania Oceania is a region centered on the islands of the tropical Pacific Ocean. Conceptions of what constitutes Oceania range from the coral atolls and volcanic islands of the South Pacific to the entire insular region between Asia and the Americas, including Australasia and the Malay Archipelago... |
Notes |
The figures for North America only refer to post-European contact settlers, and not native populations from before European settlement.
Mathematical approximations
Hoerner (1975) proposed a formula for population growth which represented hyperbolic growthHyperbolic growth
When a quantity grows towards a singularity under a finite variation it is said to undergo hyperbolic growth.More precisely, the reciprocal function 1/x has a hyperbola as a graph, and has a singularity at 0, meaning that the limit as x \to 0 is infinity: any similar graph is said to exhibit...
with an infinite population in 2025.
According to Kapitsa (1997), the world population grew between 67,000 BC and 1965 according to the following formula:

where
- N is current population
- T is the current year
- C = (1.86±0.01)•1011
- T0 = 2007±1
-
 = 42±1
The transition from hyperbolic growth to slower rates of growth is related to the demographic transition
Demographic transition
The demographic transition model is the transition from high birth and death rates to low birth and death rates as a country develops from a pre-industrial to an industrialized economic system. The theory is based on an interpretation of demographic history developed in 1929 by the American...
.
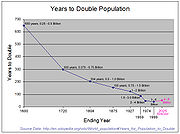
Years for world population to double
Using linear interpolation of UNDESA population estimatesWorld population estimates
A list of data for historical and projected human population of planet Earth from various sources is recorded here for reference...
, the world population has doubled, or will double, in the following years (with two different starting points). Note how, during the 2nd millennium
2nd millennium
File:2nd millennium montage.png|From left, clockwise: In 1492, Christopher Columbus; The American Revolution; The French Revolution; The Atomic Bomb from World War II; An alternate source of light, the Light Bulb; For the first time, a human being sets foot on the moon in 1969 during the Apollo 11...
, each doubling took roughly half as long as the previous doubling, fitting the hyperbolic growth model mentioned above. However, it is unlikely that there will be another doubling of the global population in the 21st century.
| Population (in billions) |
0.5 | | 1 | | 2 | | 4 | | 8 | |||||
|---|---|---|---|---|---|---|---|---|---|---|
| Year | 1500 | 1804 | 1927 | 1974 | 2025 | |||||
| Years elapsed | 304 | 123 | 47 | 51 | ||||||
| Population (in billions) |
0.375 | | 0.75 | | 1.5 | | 3 | | 6 | |||||
|---|---|---|---|---|---|---|---|---|---|---|
| Year | 1171 | 1715 | 1881 | 1960 | 1999 | |||||
| Years elapsed | 544 | 166 | 79 | 39 | ||||||
Forecasts of scarcity
In 1798, the economist Thomas MalthusThomas Malthus
The Reverend Thomas Robert Malthus FRS was an English scholar, influential in political economy and demography. Malthus popularized the economic theory of rent....
incorrectly predicted that population growth would out-run food supply by the mid-19th century. In 1968, Paul R. Ehrlich
Paul R. Ehrlich
Paul Ralph Ehrlich is an American biologist and educator who is the Bing Professor of Population Studies in the department of Biological Sciences at Stanford University and president of Stanford's Center for Conservation Biology. By training he is an entomologist specializing in Lepidoptera , but...
reprised this argument in The Population Bomb
The Population Bomb
The Population Bomb was a best-selling book written by Paul R. Ehrlich and his wife, Anne Ehrlich , in 1968. It warned of the mass starvation of humans in the 1970s and 1980s due to overpopulation, as well as other major societal upheavals, and advocated immediate action to limit population growth...
, predicting famine
Famine
A famine is a widespread scarcity of food, caused by several factors including crop failure, overpopulation, or government policies. This phenomenon is usually accompanied or followed by regional malnutrition, starvation, epidemic, and increased mortality. Every continent in the world has...
in the 1970s and 1980s. The dire predictions of Ehrlich and other neo-Malthusians were vigorously challenged by a number of economist
Economist
An economist is a professional in the social science discipline of economics. The individual may also study, develop, and apply theories and concepts from economics and write about economic policy...
s, notably Julian Lincoln Simon
Julian Lincoln Simon
Julian Lincoln Simon was a professor of business administration at the University of Maryland and a Senior Fellow at the Cato Institute at the time of his death, after previously serving as a longtime business professor at the University of Illinois at Urbana-Champaign.Simon wrote many books and...
. Agricultural research already under way, such as the Green Revolution
Green Revolution
Green Revolution refers to a series of research, development, and technology transfer initiatives, occurring between the 1940s and the late 1970s, that increased agriculture production around the world, beginning most markedly in the late 1960s....
, led to dramatic improvements in crop yields. Food production has so far kept pace with population growth, but Malthusians point out that the Green Revolution relies heavily on petroleum
Petroleum
Petroleum or crude oil is a naturally occurring, flammable liquid consisting of a complex mixture of hydrocarbons of various molecular weights and other liquid organic compounds, that are found in geologic formations beneath the Earth's surface. Petroleum is recovered mostly through oil drilling...
-based fertilizer
Fertilizer
Fertilizer is any organic or inorganic material of natural or synthetic origin that is added to a soil to supply one or more plant nutrients essential to the growth of plants. A recent assessment found that about 40 to 60% of crop yields are attributable to commercial fertilizer use...
s, and that many crops have become so genetically uniform that a crop failure could potentially have global repercussions. Food prices in the early 21st century are rising sharply on a global scale, and causing serious malnutrition to spread widely.

Agriculture
Agriculture is the cultivation of animals, plants, fungi and other life forms for food, fiber, and other products used to sustain life. Agriculture was the key implement in the rise of sedentary human civilization, whereby farming of domesticated species created food surpluses that nurtured the...
around the world, grain production increased by over 250%. The world population has grown by about four billion since the beginning of the Green Revolution and most believe that, without the Revolution, there would be greater famine
Famine
A famine is a widespread scarcity of food, caused by several factors including crop failure, overpopulation, or government policies. This phenomenon is usually accompanied or followed by regional malnutrition, starvation, epidemic, and increased mortality. Every continent in the world has...
and malnutrition
Malnutrition
Malnutrition is the condition that results from taking an unbalanced diet in which certain nutrients are lacking, in excess , or in the wrong proportions....
than the UN presently documents (approximately 850 million people suffering from chronic malnutrition in 2005). The energy for the Green Revolution was provided by fossil fuels, in the form of natural gas-derived fertilizers, oil-derived pesticides, and hydrocarbon
Hydrocarbon
In organic chemistry, a hydrocarbon is an organic compound consisting entirely of hydrogen and carbon. Hydrocarbons from which one hydrogen atom has been removed are functional groups, called hydrocarbyls....
-fueled irrigation
Irrigation
Irrigation may be defined as the science of artificial application of water to the land or soil. It is used to assist in the growing of agricultural crops, maintenance of landscapes, and revegetation of disturbed soils in dry areas and during periods of inadequate rainfall...
.
The potential peaking of world oil production
Peak oil
Peak oil is the point in time when the maximum rate of global petroleum extraction is reached, after which the rate of production enters terminal decline. This concept is based on the observed production rates of individual oil wells, projected reserves and the combined production rate of a field...
may test the critics of Malthus and Ehrlich, as oil is of crucial importance to global transportation, power generation and agriculture. In May 2008, the price of grain
GRAIN
GRAIN is a small international non-profit organisation that works to support small farmers and social movements in their struggles for community-controlled and biodiversity-based food systems. Our support takes the form of independent research and analysis, networking at local, regional and...
was pushed up severely by the increased cultivation of biofuel
Biofuel
Biofuel is a type of fuel whose energy is derived from biological carbon fixation. Biofuels include fuels derived from biomass conversion, as well as solid biomass, liquid fuels and various biogases...
s, the increase of world oil prices to over $140 per barrel ($880/m3), global population growth
Population growth
Population growth is the change in a population over time, and can be quantified as the change in the number of individuals of any species in a population using "per unit time" for measurement....
, the effects of climate change
Climate change
Climate change is a significant and lasting change in the statistical distribution of weather patterns over periods ranging from decades to millions of years. It may be a change in average weather conditions or the distribution of events around that average...
, the loss of agricultural land to residential and industrial development, and growing consumer demand in the population centres of China
China
Chinese civilization may refer to:* China for more general discussion of the country.* Chinese culture* Greater China, the transnational community of ethnic Chinese.* History of China* Sinosphere, the area historically affected by Chinese culture...
and India
India
India , officially the Republic of India , is a country in South Asia. It is the seventh-largest country by geographical area, the second-most populous country with over 1.2 billion people, and the most populous democracy in the world...
. Food riots
2007–2008 world food price crisis
World food prices increased dramatically in 2007 and the 1st and 2nd quarter of 2008 creating a global crisis and causing political and economical instability and social unrest in both poor and developed nations. Systemic causes for the worldwide increases in food prices continue to be the subject...
subsequently occurred in some countries across the world. However, oil prices then fell sharply, and remaining below $100/barrel until around 2010. Resource demands are expected to ease as population growth declines, but it is unclear whether rising living standards in developing countries will once again create resource shortages.
Richard C. Duncan
Richard C. Duncan
Richard Duncan is chief author of the Olduvai theory, a prediction of rapidly declining world energy production. He has an MS in Electrical Engineering and a PhD in Systems Engineering from the University of Washington. He has taught engineering, worked for Lear Jet and Boeing, and worked in...
claims the that the world population will decline to about 2 billion around 2050. David Pimentel, professor of ecology and agriculture at Cornell University
Cornell University
Cornell University is an Ivy League university located in Ithaca, New York, United States. It is a private land-grant university, receiving annual funding from the State of New York for certain educational missions...
, estimates that the sustainable agricultural carrying capacity
Carrying capacity
The carrying capacity of a biological species in an environment is the maximum population size of the species that the environment can sustain indefinitely, given the food, habitat, water and other necessities available in the environment...
for the United States is about 200 million people; its population as of 2011 is over 310 million. In 2009, the UK government's chief scientific advisor, Professor John Beddington
John Beddington
Sir John Rex Beddington, CMG, FRS is the Chief Scientific Adviser to the UK Government and Professor of Applied Population Biology at Imperial College London.-Early life:...
, warned that growing populations, falling energy reserves and food shortages would create a "perfect storm" by 2030. Beddington claimed that food reserves were at a fifty-year low, and that the world would require 50% more energy, food and water by 2030. According to a 2009 report by the United Nations Food and Agriculture Organisation (FAO), the world will have to produce 70% more food by 2050 to feed a projected extra 2.3 billion people.
The observed figures for 2007 showed an actual increase in absolute numbers of undernourished people in the world, with 923 million undernourished in 2007, versus 832 million in 1995. The 2009 FAO estimates showed an even more dramatic increase, to 1.02 billion.
Number of humans who have ever lived
An estimate of the total number of people who have ever lived was prepared by Carl Haub of the nonprofit Population Reference BureauPopulation Reference Bureau
The Population Reference Bureau is a private, nonprofit organization which informs people around the world about population, health and the environment for research or academic purposes...
in 1995, and subsequently updated in 2002; the updated figure totalled approximately 106 billion. Haub characterized this figure as an estimate that required "selecting population sizes for different points from antiquity to the present and applying assumed birth rates to each period". Given an estimated global population of 6.2 billion in 2002, it could be inferred that about 6% of all people who had ever existed were alive in 2002. Various estimates published in the first decade of the 21st century give figures ranging from approximately 100 billion to 115 billion.
In the 1970s, claims emerged that 75% of all the people who had ever lived were alive in the 1970s. This would mean that significantly more people would be alive in 2011 than had ever lived before. This view was eventually debunked as unscientific.
An accurate estimate of the number of people who have ever lived is difficult to produce for the following reasons:
- The set of specific characteristics that define a human is a matter of definition, and it is open to debate which members of early Homo sapiensArchaic Homo sapiensArchaic Homo sapiens is a loosely defined term used to describe a number of varieties of Homo, as opposed to anatomically modern humans , in the period beginning 500,000 years ago....
and earlier or related species of HomoHomo (genus)Homo is the genus that includes modern humans and species closely related to them. The genus is estimated to be about 2.3 to 2.4 million years old, evolving from australopithecine ancestors with the appearance of Homo habilis....
to include in the estimate (see also Sorites paradoxSorites paradoxThe sorites paradox is a paradox that arises from vague predicates. The paradox of the heap is an example of this paradox which arises when one considers a heap of sand, from which grains are individually removed...
). Even if the scientific community reached a broad consensus regarding which characteristics distinguished human beings, it would be nearly impossible to pinpoint the time of their first appearance to even the nearest millennium, due to the scarcity of fossil evidence. However, the very limited size of the world population in prehistoric times (as compared to its current size) makes this source of uncertainty of limited importance. - Robust statistical data only exist for the last two or three centuries. Until the late 18th century, few governments had ever performed an accurate census. In many early attempts, such as Ancient EgyptCensus in EgyptThe practice of conducting a periodic census began in Egypt in the second millennium BC, where it was used for tax gathering and to determine fitness for military services.-Pharaonic era :Egypt is one of the first world countries to conduct a census...
and in the Persian Empire the focus was on counting merely a subset of the people for purposes of taxation or military service. All claims of population sizes preceding the 18th century are estimates, and thus the margin of error for the total number of humans who have ever lived should be in the billions, or even tens of billions of people. - A critical factor for such an estimate is life expectancyLife expectancyLife expectancy is the expected number of years of life remaining at a given age. It is denoted by ex, which means the average number of subsequent years of life for someone now aged x, according to a particular mortality experience...
. Using an average figure of twenty years and the population estimates above, one can compute about fifty-eight billion. Using a figure of forty yields half of that. Life expectancy varies greatly when taking into account children who died within the first year of birthInfant mortalityInfant mortality is defined as the number of infant deaths per 1000 live births. Traditionally, the most common cause worldwide was dehydration from diarrhea. However, the spreading information about Oral Re-hydration Solution to mothers around the world has decreased the rate of children dying...
, a number very difficult to estimate for earlier times. Haub states that "life expectancy at birth probably averaged only about ten years for most of human history" His estimates for infant mortality suggest that around 40% of those who have ever lived did not survive beyond one year.
United Nations population agencies
The United NationsUnited Nations
The United Nations is an international organization whose stated aims are facilitating cooperation in international law, international security, economic development, social progress, human rights, and achievement of world peace...
operates several organisations with various population-related competencies, including the Commission on Population and Development
Commission on Population and Development
The Commission on Population and Development is one of the ten Functional Commissions of the United Nations Economic and Social Council. At its establishment by ECOSOC in October 1946, the Commission's name was "Population Commission" and in December 1994, was changed to "Commission on Population...
, the United Nations Population Division, and the United Nations Population Fund
United Nations Population Fund
The United Nations Population Fund is a UN organization. The work of the UNFPA involves promotion of the right of every woman, man and child to enjoy a life of health and equal opportunity. This is done through major national and demographic surveys and with population censuses...
.
See also
- Birth controlBirth controlBirth control is an umbrella term for several techniques and methods used to prevent fertilization or to interrupt pregnancy at various stages. Birth control techniques and methods include contraception , contragestion and abortion...
- Demographic transitionDemographic transitionThe demographic transition model is the transition from high birth and death rates to low birth and death rates as a country develops from a pre-industrial to an industrialized economic system. The theory is based on an interpretation of demographic history developed in 1929 by the American...
- Depopulation
- Doomsday argumentDoomsday argumentThe Doomsday argument is a probabilistic argument that claims to predict the number of future members of the human species given only an estimate of the total number of humans born so far...
- Family planningFamily planningFamily planning is the planning of when to have children, and the use of birth control and other techniques to implement such plans. Other techniques commonly used include sexuality education, prevention and management of sexually transmitted infections, pre-conception counseling and...
- Food securityFood securityFood security refers to the availability of food and one's access to it. A household is considered food-secure when its occupants do not live in hunger or fear of starvation. According to the World Resources Institute, global per capita food production has been increasing substantially for the past...
- Green RevolutionGreen RevolutionGreen Revolution refers to a series of research, development, and technology transfer initiatives, occurring between the 1940s and the late 1970s, that increased agriculture production around the world, beginning most markedly in the late 1960s....
- MegacityMegacityA megacity is usually defined as a metropolitan area with a total population in excess of 10 million people. Some definitions also set a minimum level for population density . A megacity can be a single metropolitan area or two or more metropolitan areas that converge. The terms conurbation,...
- Coastal population
- NatalismNatalismNatalism is a belief that promotes human reproduction. The term is taken from the Latin adjective form for "birth", natalis. Natalism promotes child-bearing and glorifies parenthood...
- One child policy
- OverpopulationOverpopulationOverpopulation is a condition where an organism's numbers exceed the carrying capacity of its habitat. The term often refers to the relationship between the human population and its environment, the Earth...
- Population controlPopulation controlHuman population control is the practice of artificially altering the rate of growth of a human population.Historically, human population control has been implemented by limiting the population's birth rate, usually by government mandate, and has been undertaken as a response to factors including...
- Population growthPopulation growthPopulation growth is the change in a population over time, and can be quantified as the change in the number of individuals of any species in a population using "per unit time" for measurement....
- Two-child policy
- World's largest citiesWorld's largest citiesThis article ranks the world's largest cities, in population or land area, using a variety of ranking methods.-Ambiguities in measuring the "size" of a city:...
- World population estimatesWorld population estimatesA list of data for historical and projected human population of planet Earth from various sources is recorded here for reference...
Historical:
- Historical demographyHistorical demographyHistorical demography is the quantitative study of human population in the past. It is concerned both with the three basic components of population change--fertility, mortality, and migration--and with population characteristics related to those components, such as marriage, socioeconomic status,...
- Classical demographyClassical demographyClassical demography refers to the study of human demography in the Classical period. It often focuses on the absolute number of people who were alive in civilizations around the Mediterranean Sea between the Bronze Age and the Fall of the Roman Empire, but in recent decades historians have been...
- Medieval demographyMedieval demographyThis article discusses human demography in Europe during the Middle Ages, including population trends and movements. Demographic changes helped to shape and define the Middle Ages...
- National Commission for the Observance of World Population Year 1974National Commission for the Observance of World Population Year 1974National Commission for the Observance of World Population Year 1974The United Nations observed 1974 as “World Population Year”. President Richard Nixon established the National Commission to aid U.S. participation in this United Nations observance...
- The Day of Six Billion
Lists:
- List of religious populations
- List of countries by past and future population
- List of countries by population
- List of countries by population in 1900
- List of countries by population density
- List of countries by population growth rate
- List of countries by fertility rate
External links
Further reading- World Population Prospects, the 2008 Revision (United Nations Population Division).
- Symptoms of The Global Demographic Decline
- Central Intelligence AgencyCentral Intelligence AgencyThe Central Intelligence Agency is a civilian intelligence agency of the United States government. It is an executive agency and reports directly to the Director of National Intelligence, responsible for providing national security intelligence assessment to senior United States policymakers...
(2004). CIA The World Factbook 2004. URL accessed on February 13, 2005. - The World in Balance Transcript of two-part PBS' Nova on World Population
- The Environmental Politics of Population and Overpopulation A University of California, Berkeley summary covering historical and contemporary population dynamics, forecasts, resource scarcity, population control, and environmental concerns
Organizations
- Optimum Population Trust
- The Day of 6 Billion official homepage
- World Population Day United Nations: 11 July
- United NationsUnited NationsThe United Nations is an international organization whose stated aims are facilitating cooperation in international law, international security, economic development, social progress, human rights, and achievement of world peace...
(2001). United Nations Population Information Network. URL accessed on February 13, 2005. - Population Reference Bureau www.prb.org – News and issues related to population.
- Berlin Institute for Population and DevelopmentBerlin Institute for Population and DevelopmentThe Berlin Institute for Population and Development is an independent scientific research institute that aims to improve the way in which international demographic change is perceived and dealt with in the context of sustainable development. To reach this goal, the institute publishes studies and...
Statistics and maps
- World population statistics presented in a treemap interface
- World Population Map, Statistical Graph
- Year-by-Year World Population Estimates: 10,000 BC to AD 2007.
- Trend of growth rate with total global population
- United States Census BureauUnited States Census BureauThe United States Census Bureau is the government agency that is responsible for the United States Census. It also gathers other national demographic and economic data...
(2004). Historical Estimates of World Population. URL accessed on February 13, 2005. - The AfriPop Project, showing African population statistics
- PopulationData.net (2005). PopulationData.net – Information and maps about populations around the world.
- GeoHive GeoHive.com – World Statistics including population and future predictions.
- World maps, including maps of population from 1 AD to 2300 AD
- World countries mapped by population size
- World Population from the US Census Bureau in an interactive Excel dashboard
- Trendalyzer: interactive population graphs
Population clocks