
Demographics of Russia
Encyclopedia
The demographics of Russia is about the demographic features of the population of the Russian Federation, including population growth, population density, ethnic composition
, education level, health, economic status, and other aspects of the population.
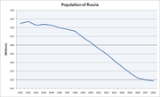
The population of Russia was 142,905,200 as per the preliminary results of the 2010 Census. The population hit a historic peak at 148,689,000 in 1991, just before the breakup of the Soviet Union, but then began a decade-long decline, falling at a rate of about 0.5% per year due to declining birth rates and rising death rates. However the decline began to slow considerably in recent years, and in 2009 Russia recorded annual population growth for the first time in 15 years, with growth of 23,300.
According to the 2002 census
, ethnic Russians
make up 80% of the total population, while six other ethnicities have a population exceeding 1 million – Tatars
(3.8%), Ukrainians
(2%), Bashkir
(1.1%), Chuvash
(1.1%), Chechens (0.9%) and Armenians
(0.8%). In total, 160 different ethnic groups and indigenous peoples live within the Russian federation's borders.
Russia's population density is 8.4 people per square kilometre (22 per square mile), making it one of the most sparsely populated countries in the world. The population is most dense in the European part of the country, centering around Moscow and Saint Petersburg
. 74% of the population is urban.
The number of Russians living in poverty has halved since the economic crisis following the disintegration of the Soviet Union, and the improving economy had a positive impact on the country's low birth rate. The birth rate of Russia rose from its lowest point of 8.27 births per 1000 people in 1999 to 12.6 per 1000 in 2010. Likewise, the fertility rate rose from its lowest point of 1.16 in 1999 to 1.54 in 2009. 2007 marked the highest growth in birth rates that the country had seen in 25 years, and 2009 marked the highest total birth rate since 1991. For comparison, the United States birth rate in 2009 was 13.8 per 1000 . While the Russian birth rate is comparable to that of other developed countries, its death rate is much higher, especially among working-age males due to a comparatively high rate of fatalities caused by heart disease and other external causes such as accidents. The Russian death rate in 2010 was 14.3 per 1000 citizens. For comparison, the US death rate in 2009 was 8.4 per 1000 .
The causes for this sharp increase in mortality are widely debated, with some academics citing alcohol abuse as the main culprit, and others citing the drastic and widely negative changes in lifestyle caused by economic reforms that followed the dissolution of the Soviet Union. According to a 2009 report by The Lancet
, a British medical journal, mass privatization
, an element of the economic-reform package nicknamed shock therapy
, clearly correlates with higher mortality rates. The report argues that the advocates of the economic reforms ignored the human cost of the policies they were promoting, such as unemployment and human suffering, leading to an early death. These conclusions were criticized by The Economist
. According to the Russian demographic publication Demoscope, the rising male death rate was a long-term trend from 1960 to 2005. The only significant reversion of the trend was caused by Mikhail Gorbachev
's anti-alcohol campaign, but its effect was only temporary. According to the publication, the sharp rise of death rates in the early 1990s was caused by the exhaustion of the effect of the anti-alcohol campaign, while the market reforms were of only secondary importance. The authors also claimed the Lancet's study is flawed because it used 1985 death rate as the base, while that was in fact the very maximum of the effect of the anti-alcohol campaign.
Government measures to halt the demographic crisis was a key subject of Vladimir Putin
's 2006 state of the nation address. As a result, a national programme was developed with the goal to reverse the trend by 2020. Soon after, a study published in 2007 showed that the rate of population decrease had begun to slow: if the net decrease in January–August 2006 was 408,200 people, it was 196,600 in the same period in 2007. The death rate accounted for 357,000 of these, which is 137,000 less than in 2006. At the same time period in 2007, there were just over 1 million births in Russia (981,600 in 2006), whilst deaths decreased from 1,475,000 to 1,402,300. In all, the number of deaths exceeded the number of births by 1.3 times, down from 1.5 in 2006. Eighteen of the 83 provinces showed a natural growth of population (in 2006: 16). The Russian Ministry of Economic Development expressed hope that by 2020 the population would stabilize at 138–139 million, and by 2025, to increase again to its present day status of 143–145, also raising the life expectancy to 75 years.
The natural population decline continued to slow through 2008—2010 due to declining death rates and increasing birth rates, and in 2009 the population saw yearly growth for the first time in 15 years. In September 2009, the Ministry of Health and Social Development reported that Russia recorded natural population growth for the first time in 15 years, with 1,000 more births than deaths in August. In April 2011 the Russian Prime Minister Vladimir Putin pledged to spend the 1.5 trillion rubles (£32.5 billion or $54 billion) on various measures to boost Russia's declining birthrate by 30 per cent in the next four years.
p=preliminary
, Russia's total fertility rate
(TFR) stood at 1.89. Fertility rates had already begun to decline in the late 80s due to the natural progression of Russia's demographic structure, but the rapid and widely negative changes in society following the collapse greatly influenced the rate of decline. The TFR hit an historic low of 1.16 in 1999 and has since begun to rise again, reaching 1.54 in 2009 (growth of 34.4%). The only federal subject of Russia
to see a decline in fertility since 1999 is Ingushetia
, where the TFR has fallen by 20% from 2.44 to 1.97 as of 2009.
In 2009, 8 of Russia's federal subjects had a TFR above 2.1 children per woman (the approximate minimum required to ensure population replacement). These federal subjects are Chechnya
(3.38), Tyva
(2.81), Ust-Orda Buryat Okrug (2.73), Agin-Buryat Okrug (2.63), Komi-Permyak
(2.16), Evenk Okrug (2.58), Altai Republic
(2.36), Nenets Autonomous Okrug
(2.1). Of these federal subjects, four have an ethnic Russian majority (Altai, Evenk, Ust-Orda and Nenets).
In every region in Russia rural areas reported higher TFR compared to urban areas. In most of the federal subjects in Siberia
and the Russian Far East
, the total fertility rates were high, but not high enough to ensure population replacement. For example, Zabaykalsky Krai had a TFR of 1.82, which is higher than the national average, but less than the 2.1 needed for population replacement.
, in 2010, Russian TFR of 1,59 children/ woman was significantly lower than that of the United States (2,09),
  Early Modern France (2,01), the (1,92). Yet it approximately equals to the TFR of
  Canada (1,57), and is higher than in other G8 countries:
  Germany (1,36),
  Japan (1,39), and
  Italy (1,40).
Compared to other most populous nations, Russia has a lower TFR than Nigeria (4,82),
 Pakistan (3,13),
 India (2,65),
  Indonesia (2,28),
  Brazil (2,19), the USA, and the same TFR as
  Mainland China (1,54).
Compared to it's neighbors, in 2010 Russia has a lower TFR than Kazakhstan (2,67),
  Mongolia (2,22),
  Azerbaijan (2,03),
  Norway (1,97),
 North Korea (1,94),
  Finland (1,88) and
  Estonia (1,63). Russian TFR close to the Chinese one, and is higher than in
  Lithuania (1,53),
  Georgia (country) (1,52),
 Belarus (1,47),
  Ukraine (1,44),
  Poland (1,38) and
  Latvia (1,17).
See also: List of countries by fertility rate
, followed by (groups larger than one million):
Most smaller groups live compactly in their respective regions and can be categorized by language group
The ethnic divisions used here are those of the official census, and may in some respects be controversial. The following lists all ethnicites resolved by the 2002 census, grouped by language:
 Some 1.6% of the population are ethnicities not native to the Russian territory. The census has an additional group of 'other' ethnicities of 42,980 (0.03%), including Hungarians, Czechs
, Japanese
, Chinese
, Spaniards, Italians
, Scandinavians
and Romanians
. There are even Africans in Russia (See Afro-Russian
).
See also: Northern indigenous peoples of Russia, Detailed Table of 2002 census
. By 2002, due to Jewish emigration, their number fell as low as 230,000. A sizeable emigration of other minorities has been enduring, too. Predominantly these are European peoples like Germans, Czechs, Greeks and members of their families. The main destinations are the USA (Jews, Belarussians, Chechens, Meskhetian Turks, Ukrainians and others), Israel
(Jews), Germany (Germans and Jews), Poland
(Poles and Jews), Canada (Finns and Ukrainians), Finland
(Finns), France (Jews, Armenians and Romani) and the United Kingdom (mainly rich Russians).
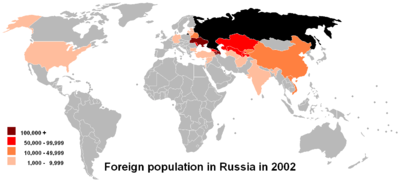
At the same time, Russia experiences a constant flow of immigration. On average, close to 300,000 legal immigrants enter the country every year; about half are ethnic Russians from the other republics of the former Soviet Union. In addition, There are an estimated 4 million illegal immigrants from the ex-Soviet
states in Russia. There is a significant inflow of ethnic Georgians
, Armenians
, Azerbaijanis, Uzbeks
, Kyrgyz, Tajiks, and Ukrainians
into big Russian cities, something that is viewed unfavorably by some citizens.
Median ages are strongly correlated with fertility rates
, ethnic groups with higher fertility rates have lower median ages, and vice versa. For example, in 2002, in the ethnic group with the lowest median age – Ingush
– women 35 or older had, on average, 4.05 children; in the ethnic group with the highest median age – Jews – women 35 or older averaged only 1.37 children.
Ethnic Jews have both the highest median age and the lowest fertility rate; this is a consequence of Jewish emigration
.
Ethnic Russians represent a significant deviation from the pattern, with second lowest fertility rate of all major groups, but relatively low median age (37.6 years). This phenomenon is at least partly due to the fact that children from mixed marriages are often registered as ethnic Russians in the census. The most noticeable trend in the past couple of decades is the convergence of birth rates between minorities (including Muslim minorities) and the Russian majority.
The following table shows the variation in median age and fertility rates according to 2002 census.
understood by 99% of its current inhabitants and widespread in many adjacent areas of Asia and Eastern Europe. National subdivisions of Russia have additional official languages (see their respective articles). There are more than 100 languages spoken in Russia, many of which are in danger of extinction
.
 The most widespread religion in Russia is Eastern Orthodox Christianity, represented by the Russian Orthodox Church
. A survey by ВЦИОМ
in 2010 (with a 3.4% margin of error) found that 73% of the Russian population is Orthodox and 6% is Muslim. 1% believed in other faiths and the remainder were non-religious, or self-identified atheists or agnostics (self identified religious people and non-religious people can be atheists or agnostics). 16% of the population observed fasting during Lent
.
Over 80% of ethnic Russians identify themselves as Orthodox. Of these, approximately 2–4% of the general population are integrated into church life (воцерковленные), while others attend on a less regular basis or not at all. Many non-religious ethnic Russians identify with the Orthodox faith for cultural reasons. The majority of Muslims live in the Volga–Ural region and the North Caucasus
, although Moscow, Saint Petersburg, and parts of Siberia also have sizable Muslim populations. Other branches of Christianity present in Russia include Roman Catholicism (approx. 1%), Baptists, Pentecostals, Lutherans and other Protestant churches (together totalling about 0.5% of the population) and Old Believers
. There is some presence of Judaism, Buddhism
, and Krishnaism
, as well. Shamanism
and other pagan beliefs are present to some extent in remote areas, sometimes syncretized
with one of the mainstream religions.
According to the 2002 Census, 9.96% of the Russian population belongs to ethnic groups which had traditionally practiced Islam (such as Tatars, Bashkirs, Chechens and Azeris). However the actual number of Muslims is expected to be much lower than this amount, due to the existence of a large number of Christian congregations among these groups (Keräşens and Nağaybäk
s among Tatars, Mozdok Christians among Kabardians, etc. According to Vyacheslav Sanin, one-third of Adzharians, 25% each of Tatars and Adyghe and more than 10% of Kazakhs living in Russia practice Christianity, with many more being atheist). The number of Muslims among other ethnic groups is believed to be much smaller, amounting to only a few thousand. Most of the Russian sources give a figure of around 6% of the total population based on surveys, while Western sources give a figure of 10% to 15%. Depending on sources the population varies, muslim population has also been estimated as high as 20 million, the Dawn newspaper says this value is a usual estimate.
Roman Silantyev
, an expert on Islam in Russia, claims that there are between 5,500 and 6,000 ethnic Slavs who are Muslim. At the same time there are more than 500,000 people of traditionally Muslim ethnicities who believe in Orthodoxy. One percent of all the adherents and over 400 priests in the Russian Orthodox Church are from Muslim ethnic groups.
total literacy: 99.4% (2002)
male: 99.7%
female: 99.2%
Russia's free, widespread and in-depth educational system, inherited with almost no changes from the Soviet Union, has produced nearly 100% literacy. 97% of children receive their compulsory 9-year basic or complete 11-year education in Russian. Other languages are also used in their respective republics, for instance Tatar
(1%), Yakut (0.4%) etc.
About 3 million students attend Russia's 519 institutions of higher education and 48 universities. As a result of great emphasis on science and technology
in education, Russian medical, mathematical, scientific, and space and aviation research is generally of a high order.
) as of May 2008, up from $455 per year in August 1999.
According to the FMS, as of 2011, there were 7,000,000 immigrants working in Russia. Half of these were from Ukraine, while the remainder was mostly from Central Asia. Only 3 million or less than half of all the immigrants are legal. Illegal immigrants number 4 million, mostly from Tajikistan, Uzbekistan and Moldova. The Census usually covers only a part of this population and the last one (2002 Census) counted one million non-citizens.
. The second leading cause of death was cancer which claimed 292,310 lives (14.3%). External causes of death such as suicide (1.7%), road accidents (1.4%), murders (0.9%), accidental alcohol poisoning (0.7%), and accidental drowning (0.5%), claimed 206,336 lives in total (10.2%). Other major causes of death were diseases of the digestive system (4.5%), respiratory disease (3.6%), infectious and parasitic diseases (1.6%), and tuberculosis (1.1%). The infant mortality rate in 2010 was 7.5 deaths per 1,000 (down from 8.2 in 2009 and 16.9 in 1999).
As of 2010, the average life expectancy in Russia was 63.03 years for males and 74.87 years for females. The average Russian life expectancy of 68.98 years at birth is nearly 10 years shorter than the overall average figure for the European Union, or the United States. The largest contributing factor to the relatively low life expectancy is high mortality among working-age males due to preventable causes such as accidents, alcohol poisoning, violent crimes, heart disease etc. Some infectious diseases are also implicated, such as AIDS/HIV and tuberculosis
, which became more widespread in Russia in the 1990s because of the deterioration in the healthcare system. In the late 1950s, the USSR had a higher life expectancy than the United States, but the Soviet Union has lagged behind Western countries in terms of mortality and life expectancy since the late 1960s. The life expectancy was about 70 in 1986, prior to the transition-induced disruption of the healthcare system. The turmoil in the early 1990s caused life expectancy in Russia to steadily decrease while it was steadily increasing in the rest of the world. Recently however, Russian life expectancy has again begun to rise. Between 2005—2010 the male life expectancy in Russia rose by over four years, increasing the overall life expectancy by nearly 4 years to 68.98.
methods, compared to 20–40% in developed countries. This led to much higher abortion
rates in Russia compared to developed countries: in the 1980s Russia had a figure of 120 abortions per 1,000 women of reproductive age compared with only 20 per 1,000 in Western countries. However, after the dissolution of the Soviet Union many changes took place, such as the demonopolization of the market for contraceptive drugs and media liberalization, which lead to a rapid conversion to more efficient pregnancy control practices. Abortion rates fell in the first half of the 1990s for the first time in Russia's history, even despite declining fertility rates. From the early 1990s to 2006, the number of expected abortions per women during her lifetime fell by nearly 2.5 times, from 3.4 to 1.2. As of 2004, the share of women of reproductive age using hormonal or intrauterine birth control methods was about 46% (29% intrauterine, 17% hormonal).
Despite clear progress in family planning, the target of desired children at the desired time for a large portion of Russian families has not yet been achieved. According to a 2004 study, current pregnancies were termed "desired and timely" by 58% of respondents, while 23% described them as "desired, but untimely", and 19% said they were "undesired". The share of unexpected pregnancies remains much lower in countries with developed family planning culture, such as the Netherlands
, whose percentage of unwanted pregnancies 20 years ago was half of that in Russia today.
is distinct from many other nations. Russia is one of few nations that have small towns hundreds of kilometres from major population centres. Villages far from towns are classified by poor living conditions: low salaries, lack of heating equipment and sewage systems, and sometimes lack of electricity (mostly in Siberia
). Sanitation and hygiene is also very poor in some areas that completely lack any plumbing whatsoever. Relatively few Russian people live in villages—rural population accounted for 27% of the total population according to the 2002 Russian Census
. Some people rent village houses and use them as dachas (summer houses).
male: 63.04 years
female: 74.87 years (2010)
male: 36.1 years
female: 41.1 years (2009)
Population (2010 est.): 139,390,205 (growth rate: –0.5%); birth rate: 11.1/1000; infant mortality rate: 10.3/1000; life expectancy: 66.1; density per sq mi: 21
Read more: Russia: History, Geography, Government, and Culture — Infoplease.com http://www.infoplease.com/ipa/A0107909.html#ixzz1en9EB9rN
under 15 years: 1.05 male(s)/female
15–64 years: 0.92 male(s)/female
65 years and over: 0.46 male(s)/female
total population: 0.86 male(s)/female (2009)
Ethnic group
An ethnic group is a group of people whose members identify with each other, through a common heritage, often consisting of a common language, a common culture and/or an ideology that stresses common ancestry or endogamy...
, education level, health, economic status, and other aspects of the population.
The population of Russia was 142,905,200 as per the preliminary results of the 2010 Census. The population hit a historic peak at 148,689,000 in 1991, just before the breakup of the Soviet Union, but then began a decade-long decline, falling at a rate of about 0.5% per year due to declining birth rates and rising death rates. However the decline began to slow considerably in recent years, and in 2009 Russia recorded annual population growth for the first time in 15 years, with growth of 23,300.
According to the 2002 census
Russian Census (2002)
Russian Census of 2002 was the first census of the Russian Federation carried out on October 9 through October 16, 2002. It was carried out by the Russian Federal Service of State Statistics .-Resident population:...
, ethnic Russians
Russians
The Russian people are an East Slavic ethnic group native to Russia, speaking the Russian language and primarily living in Russia and neighboring countries....
make up 80% of the total population, while six other ethnicities have a population exceeding 1 million – Tatars
Tatars
Tatars are a Turkic speaking ethnic group , numbering roughly 7 million.The majority of Tatars live in the Russian Federation, with a population of around 5.5 million, about 2 million of which in the republic of Tatarstan.Significant minority populations are found in Uzbekistan, Kazakhstan,...
(3.8%), Ukrainians
Ukrainians
Ukrainians are an East Slavic ethnic group native to Ukraine, which is the sixth-largest nation in Europe. The Constitution of Ukraine applies the term 'Ukrainians' to all its citizens...
(2%), Bashkir
Bashkirs
The Bashkirs are a Turkic people indigenous to Bashkortostan extending on both parts of the Ural mountains, on the place where Europe meets Asia. Groups of Bashkirs also live in the republic of Tatarstan, Perm Krai, Chelyabinsk, Orenburg, Tyumen, Sverdlovsk, Kurgan, Samara and Saratov Oblasts of...
(1.1%), Chuvash
Chuvash people
The Chuvash people are a Turkic ethnic group, native to an area stretching from the Volga Region to Siberia. Most of them live in Republic of Chuvashia and surrounding areas, although Chuvash communities may be found throughout all Russia.- Etymology :...
(1.1%), Chechens (0.9%) and Armenians
Armenians
Armenian people or Armenians are a nation and ethnic group native to the Armenian Highland.The largest concentration is in Armenia having a nearly-homogeneous population with 97.9% or 3,145,354 being ethnic Armenian....
(0.8%). In total, 160 different ethnic groups and indigenous peoples live within the Russian federation's borders.
Russia's population density is 8.4 people per square kilometre (22 per square mile), making it one of the most sparsely populated countries in the world. The population is most dense in the European part of the country, centering around Moscow and Saint Petersburg
Saint Petersburg
Saint Petersburg is a city and a federal subject of Russia located on the Neva River at the head of the Gulf of Finland on the Baltic Sea...
. 74% of the population is urban.
Declining population
The population of Russia peaked at 148,689,000 in 1991, just before the breakup of the Soviet Union. Low birth rates and abnormally high death rates caused Russia's population to decline at a 0.5% annual rate, or about 750,000 to 800,000 people per year from the mid 1990s to the mid 2000s. The UN warned in 2005 that Russia's then population of about 143 million could fall by a third by 2050 if trends did not improve. However, the Russian state statistics service Rosstat had more optimistic forecasts in 2009, whose Medium variant predicted that Russia's population would only fall to 139 million by 2030 (Low: 127 million; High: 147 million). Furthermore, in 2008 one demographic analyst (correctly) predicted a resumption in population growth by 2010.The number of Russians living in poverty has halved since the economic crisis following the disintegration of the Soviet Union, and the improving economy had a positive impact on the country's low birth rate. The birth rate of Russia rose from its lowest point of 8.27 births per 1000 people in 1999 to 12.6 per 1000 in 2010. Likewise, the fertility rate rose from its lowest point of 1.16 in 1999 to 1.54 in 2009. 2007 marked the highest growth in birth rates that the country had seen in 25 years, and 2009 marked the highest total birth rate since 1991. For comparison, the United States birth rate in 2009 was 13.8 per 1000 . While the Russian birth rate is comparable to that of other developed countries, its death rate is much higher, especially among working-age males due to a comparatively high rate of fatalities caused by heart disease and other external causes such as accidents. The Russian death rate in 2010 was 14.3 per 1000 citizens. For comparison, the US death rate in 2009 was 8.4 per 1000 .
The causes for this sharp increase in mortality are widely debated, with some academics citing alcohol abuse as the main culprit, and others citing the drastic and widely negative changes in lifestyle caused by economic reforms that followed the dissolution of the Soviet Union. According to a 2009 report by The Lancet
The Lancet
The Lancet is a weekly peer-reviewed general medical journal. It is one of the world's best known, oldest, and most respected general medical journals...
, a British medical journal, mass privatization
Privatization
Privatization is the incidence or process of transferring ownership of a business, enterprise, agency or public service from the public sector to the private sector or to private non-profit organizations...
, an element of the economic-reform package nicknamed shock therapy
Shock therapy (economics)
In economics, shock therapy refers to the sudden release of price and currency controls, withdrawal of state subsidies, and immediate trade liberalization within a country, usually also including large scale privatization of previously public owned assets....
, clearly correlates with higher mortality rates. The report argues that the advocates of the economic reforms ignored the human cost of the policies they were promoting, such as unemployment and human suffering, leading to an early death. These conclusions were criticized by The Economist
The Economist
The Economist is an English-language weekly news and international affairs publication owned by The Economist Newspaper Ltd. and edited in offices in the City of Westminster, London, England. Continuous publication began under founder James Wilson in September 1843...
. According to the Russian demographic publication Demoscope, the rising male death rate was a long-term trend from 1960 to 2005. The only significant reversion of the trend was caused by Mikhail Gorbachev
Mikhail Gorbachev
Mikhail Sergeyevich Gorbachev is a former Soviet statesman, having served as General Secretary of the Communist Party of the Soviet Union from 1985 until 1991, and as the last head of state of the USSR, having served from 1988 until its dissolution in 1991...
's anti-alcohol campaign, but its effect was only temporary. According to the publication, the sharp rise of death rates in the early 1990s was caused by the exhaustion of the effect of the anti-alcohol campaign, while the market reforms were of only secondary importance. The authors also claimed the Lancet's study is flawed because it used 1985 death rate as the base, while that was in fact the very maximum of the effect of the anti-alcohol campaign.
Government measures to halt the demographic crisis was a key subject of Vladimir Putin
Vladimir Putin
Vladimir Vladimirovich Putin served as the second President of the Russian Federation and is the current Prime Minister of Russia, as well as chairman of United Russia and Chairman of the Council of Ministers of the Union of Russia and Belarus. He became acting President on 31 December 1999, when...
's 2006 state of the nation address. As a result, a national programme was developed with the goal to reverse the trend by 2020. Soon after, a study published in 2007 showed that the rate of population decrease had begun to slow: if the net decrease in January–August 2006 was 408,200 people, it was 196,600 in the same period in 2007. The death rate accounted for 357,000 of these, which is 137,000 less than in 2006. At the same time period in 2007, there were just over 1 million births in Russia (981,600 in 2006), whilst deaths decreased from 1,475,000 to 1,402,300. In all, the number of deaths exceeded the number of births by 1.3 times, down from 1.5 in 2006. Eighteen of the 83 provinces showed a natural growth of population (in 2006: 16). The Russian Ministry of Economic Development expressed hope that by 2020 the population would stabilize at 138–139 million, and by 2025, to increase again to its present day status of 143–145, also raising the life expectancy to 75 years.
The natural population decline continued to slow through 2008—2010 due to declining death rates and increasing birth rates, and in 2009 the population saw yearly growth for the first time in 15 years. In September 2009, the Ministry of Health and Social Development reported that Russia recorded natural population growth for the first time in 15 years, with 1,000 more births than deaths in August. In April 2011 the Russian Prime Minister Vladimir Putin pledged to spend the 1.5 trillion rubles (£32.5 billion or $54 billion) on various measures to boost Russia's declining birthrate by 30 per cent in the next four years.
Before WW II
No exact vital statistics for Russia are available for the period before WW II. Andreev made the following estimates:| Average population | Live births | Deaths | Natural change | Crude birth rate (per 1,000) | Crude death rate (per 1,000) | Natural change (per 1,000) | |
|---|---|---|---|---|---|---|---|
| 1927 | 94,596,000 | 4,688,000 | 2,705,000 | 1,983,000 | 49.6 | 28.6 | 21.0 |
| 1928 | 96,654,000 | 4,723,000 | 2,589,000 | 2,134,000 | 48.9 | 26.8 | 22.1 |
| 1929 | 98,644,000 | 4,633,000 | 2,819,000 | 1,814,000 | 47.0 | 28.6 | 18.4 |
| 1930 | 100,419,000 | 4,413,000 | 2,738,000 | 1,675,000 | 43.9 | 27.3 | 16.7 |
| 1931 | 101,948,000 | 4,412,000 | 3,090,000 | 1,322,000 | 43.3 | 30.3 | 13.0 |
| 1932 | 103,136,000 | 4,058,000 | 3,077,000 | 981,000 | 39.3 | 29.8 | 9.5 |
| 1933 | 102,706,000 | 3,313,000 | 5,239,000 | -1,926,000 | 32.3 | 51.0 | -18.8 |
| 1934 | 101,922,000 | 2,923,000 | 2,659,000 | 264,000 | 28.7 | 26.1 | 2.6 |
| 1935 | 102,684,000 | 3,577,000 | 2,421,000 | 1,156,000 | 34.8 | 23.6 | 11.3 |
| 1936 | 103,904,000 | 3,899,000 | 2,719,000 | 1,180,000 | 37.5 | 26.2 | 11.4 |
| 1937 | 105,358,000 | 4,377,000 | 2,760,000 | 1,617,000 | 41.5 | 26.2 | 15.3 |
| 1938 | 107,044,000 | 4,379,000 | 2,739,000 | 1,640,000 | 40.9 | 25.6 | 15.3 |
| 1939 | 108,785,000 | 4,329,000 | 2,600,000 | 1,729,000 | 39.8 | 23.9 | 15.9 |
| 1940 | 110,333,000 | 3,814,000 | 2,561,000 | 1,253,000 | 34.6 | 23.2 | 11.4 |
After WW II
| Average population | Live births | Deaths | Natural change | Crude birth rate (per 1,000) | Crude death rate (per 1,000) | Natural change (per 1,000) | Fertility rates | |
|---|---|---|---|---|---|---|---|---|
| 1946 | 98,028,000 | 2,546,000 | 1,210,000 | 1,336,000 | 26.0 | 12.3 | 13.6 | |
| 1947 | 98,834,000 | 2,715,000 | 1,680,000 | 1,035,000 | 27.5 | 17.0 | 10.5 | |
| 1948 | 99,706,000 | 2,516,000 | 1,310,000 | 1,206,000 | 25.2 | 13.1 | 12.1 | |
| 1949 | 101,160,000 | 3,089,000 | 1,187,000 | 1,902,000 | 30.5 | 11.7 | 18.8 | |
| 1950 | 102,833,000 | 2,859,000 | 1,180,000 | 1,719,000 | 27.8 | 11.5 | 16.7 | |
| 1951 | 104,439,000 | 2,938,000 | 1,210,000 | 1,779,000 | 28.1 | 11.6 | 17.0 | |
| 1952 | 106,164,000 | 2,928,000 | 1,138,000 | 1,807,000 | 27.6 | 10.7 | 17.0 | |
| 1953 | 107,828,000 | 2,822,000 | 1,118,000 | 1,696,000 | 26.2 | 10.4 | 15.7 | |
| 1954 | 109,643,000 | 3,048,000 | 1,133,000 | 1,932,000 | 27.8 | 10.3 | 17.6 | |
| 1955 | 111,572,000 | 2,942,000 | 1,037,000 | 1,921,000 | 26.4 | 9.3 | 17.2 | |
| 1956 | 113,327,000 | 2,827,000 | 956,000 | 1,906,000 | 24.9 | 8.4 | 16.8 | |
| 1957 | 115,035,000 | 2,880,000 | 1,017,000 | 1,916,000 | 25.0 | 8.8 | 16.7 | |
| 1958 | 116,749,000 | 2,861,000 | 931,000 | 1,982,000 | 24.5 | 8.0 | 17.0 | |
| 1959 | 118,307,000 | 2,796,228 | 920,225 | 1,876,003 | 23.6 | 7.8 | 15.9 | |
| 1960 | 119,906,000 | 2,782,353 | 886,090 | 1,896,263 | 23.2 | 7.4 | 15.8 | 2,52 |
| 1961 | 121,586,000 | 2,662,135 | 901,637 | 1,760,498 | 21.9 | 7.4 | 14.5 | 2,45 |
| 1962 | 123,128,000 | 2,482,539 | 949,648 | 1,532,891 | 20.2 | 7.7 | 12.4 | 2,36 |
| 1963 | 124,514,000 | 2,331,505 | 932,055 | 1,399,450 | 18.7 | 7.5 | 11.2 | 2,27 |
| 1964 | 125,744,000 | 2,121,994 | 901,751 | 1,220,243 | 16.9 | 7.2 | 9.7 | 2,18 |
| 1965 | 126,749,000 | 1,990,520 | 958,789 | 1,031,731 | 15.7 | 7.6 | 8.1 | 2,13 |
| 1966 | 127,608,000 | 1,957,763 | 974,299 | 983,464 | 15.3 | 7.6 | 7.7 | 2,10 |
| 1967 | 128,361,000 | 1,851,041 | 1,017,034 | 834,007 | 14.4 | 7.9 | 6.5 | 2,04 |
| 1968 | 129,037,000 | 1,816,509 | 1,040,096 | 776,413 | 14.1 | 8.1 | 6.0 | 1,99 |
| 1969 | 129,660,000 | 1,847,592 | 1,106,640 | 740,952 | 14.2 | 8.5 | 5.7 | 1,97 |
| 1970 | 130,252,000 | 1,903,713 | 1,131,183 | 772,530 | 14.6 | 8.7 | 5.9 | 1,99 |
| 1971 | 130,934,000 | 1,974,637 | 1,143,359 | 831,278 | 15.1 | 8.7 | 6.3 | 2,03 |
| 1972 | 131,687,000 | 2,014,638 | 1,181,802 | 832,836 | 15.3 | 9.0 | 6.3 | 2,04 |
| 1973 | 132,434,000 | 1,994,621 | 1,214,204 | 780,417 | 15.1 | 9.2 | 5.9 | 2,01 |
| 1974 | 133,217,000 | 2,079,812 | 1,222,495 | 857,317 | 15.6 | 9.2 | 6.4 | 2,00 |
| 1975 | 134,092,000 | 2,106,147 | 1,309,710 | 796,437 | 15.7 | 9.8 | 5.9 | 1,98 |
| 1976 | 135,026,000 | 2,146,711 | 1,352,950 | 793,761 | 15.9 | 10.0 | 5.9 | 1,97 |
| 1977 | 135,979,000 | 2,156,724 | 1,387,986 | 768,738 | 15.9 | 10.2 | 5.7 | 1,95 |
| 1978 | 136,922,000 | 2,179,030 | 1,417,377 | 761,653 | 15.9 | 10.4 | 5.6 | 1,92 |
| 1979 | 137,758,000 | 2,178,542 | 1,490,057 | 688,485 | 15.8 | 10.8 | 5.0 | 1,90 |
| 1980 | 138,483,000 | 2,202,779 | 1,525,755 | 677,024 | 15.9 | 11.0 | 4.9 | 1,89 |
| 1981 | 139,221,000 | 2,236,608 | 1,524,286 | 712,322 | 16.1 | 10.9 | 5.1 | 1,91 |
| 1982 | 140,067,000 | 2,328,044 | 1,504,200 | 823,844 | 16.6 | 10.7 | 5.9 | 2,04 |
| 1983 | 141,056,000 | 2,478,322 | 1,563,995 | 914,327 | 17.6 | 11.1 | 6.5 | 2,11 |
| 1984 | 142,061,000 | 2,409,614 | 1,650,866 | 758,748 | 17.0 | 11.6 | 5.3 | 2,06 |
| 1985 | 143,033,000 | 2,375,147 | 1,625,266 | 749,881 | 16.6 | 11.4 | 5.2 | 2,05 |
| 1986 | 144,156,000 | 2,485,915 | 1,497,975 | 987,940 | 17.2 | 10.4 | 6.9 | 2,15 |
| 1987 | 145,386,000 | 2,499,974 | 1,531,585 | 968,389 | 17.2 | 10.5 | 6.7 | 2,23 |
| 1988 | 146,505,000 | 2,348,494 | 1,569,112 | 779,382 | 16.0 | 10.7 | 5.3 | 2,12 |
| 1989 | 147,342,000 | 2,160,559 | 1,583,743 | 576,816 | 14.7 | 10.7 | 3.9 | 2,01 |
| 1990 | 147,969,000 | 1,988,858 | 1,655,993 | 332,865 | 13.4 | 11.2 | 2.3 | 1,89 |
| 1991 | 148,394,000 | 1,794,626 | 1,690,657 | 103,969 | 12.1 | 11.4 | 0.7 | 1,73 |
| 1992 | 148,538,000 | 1,587,644 | 1,807,441 | -219,797 | 10.7 | 12.2 | -1.5 | 1,55 |
| 1993 | 148,459,000 | 1,378,983 | 2,129,339 | -750,356 | 9.3 | 14.3 | -5.1 | 1,39 |
| 1994 | 148,408,000 | 1,408,159 | 2,301,366 | -893,207 | 9.5 | 15.5 | -6.0 | 1,40 |
| 1995 | 148,376,000 | 1,363,806 | 2,203,811 | -840,005 | 9.2 | 14.9 | -5.7 | 1,34 |
| 1996 | 148,160,000 | 1,304,638 | 2,082,249 | -777,611 | 8.8 | 14.1 | -5.2 | 1,28 |
| 1997 | 147,915,000 | 1,259,943 | 2,015,779 | -755,836 | 8.5 | 13.6 | -5.1 | 1,23 |
| 1998 | 147,671,000 | 1,283,292 | 1,988,744 | -705,452 | 8.7 | 13.5 | -4.8 | 1,24 |
| 1999 | 147,215,000 | 1,214,689 | 2,144,316 | -929,627 | 8.3 | 14.6 | -6.3 | 1,16 |
| 2000 | 146,597,000 | 1,266,800 | 2,225,332 | -958,532 | 8.6 | 15.2 | -6.5 | 1,21 |
| 2001 | 145,976,000 | 1,311,604 | 2,254,856 | -943,252 | 9.0 | 15.4 | -6.5 | 1,25 |
| 2002 | 145,306,000 | 1,396,967 | 2,332,272 | -935,305 | 9.6 | 16.1 | -6.4 | 1,30 |
| 2003 | 144,566,000 | 1,477,301 | 2,365,826 | -888,525 | 10.2 | 16.4 | -6.1 | 1,31 |
| 2004 | 143,821,000 | 1,502,477 | 2,295,402 | -792,925 | 10.4 | 16.0 | -5.5 | 1,33 |
| 2005 | 143,114,000 | 1,457,376 | 2,303,935 | -846,559 | 10.2 | 16.1 | -5.9 | 1,29 |
| 2006 | 142,487,000 | 1,479,637 | 2,166,703 | -687,066 | 10.4 | 15.2 | -4.8 | 1,30 |
| 2007 | 142,115,000 | 1,610,122 | 2,080,445 | -470,323 | 11.3 | 14.6 | -3.3 | 1,41 |
| 2008 | 141,956,000 | 1,713,947 | 2,075,954 | -362,007 | 12.1 | 14.6 | -2.6 | 1,49 |
| 2009 | 141,909,000 | 1,761,687 | 2,010,543 | -248,856 | 12.4 | 14.2 | -1.8 | 1,54 |
| 2010 (p) | 142,938,285 | 1,788,948 | 2,028,516 | -239,568 | 12.6 | 14.2 | -1.7 | 1,59 |
p=preliminary
Total fertility rates
In 1990, just prior to the dissolution of the Soviet UnionDissolution of the Soviet Union
The dissolution of the Soviet Union was the disintegration of the federal political structures and central government of the Union of Soviet Socialist Republics , resulting in the independence of all fifteen republics of the Soviet Union between March 11, 1990 and December 25, 1991...
, Russia's total fertility rate
Total Fertility Rate
The total fertility rate of a population is the average number of children that would be born to a woman over her lifetime if she were to experience the exact current age-specific fertility rates through her lifetime, and she...
(TFR) stood at 1.89. Fertility rates had already begun to decline in the late 80s due to the natural progression of Russia's demographic structure, but the rapid and widely negative changes in society following the collapse greatly influenced the rate of decline. The TFR hit an historic low of 1.16 in 1999 and has since begun to rise again, reaching 1.54 in 2009 (growth of 34.4%). The only federal subject of Russia
Federal subjects of Russia
Russia is a federation which, since March 1, 2008, consists of 83 federal subjects . In 1993, when the Constitution was adopted, there were 89 federal subjects listed...
to see a decline in fertility since 1999 is Ingushetia
Ingushetia
The Republic of Ingushetia is a federal subject of Russia , located in the North Caucasus region with its capital at Magas. In terms of area, the republic is the smallest of Russia's federal subjects except for the two federal cities, Moscow and Saint Petersburg...
, where the TFR has fallen by 20% from 2.44 to 1.97 as of 2009.
In 2009, 8 of Russia's federal subjects had a TFR above 2.1 children per woman (the approximate minimum required to ensure population replacement). These federal subjects are Chechnya
Chechnya
The Chechen Republic , commonly referred to as Chechnya , also spelled Chechnia or Chechenia, sometimes referred to as Ichkeria , is a federal subject of Russia . It is located in the southeastern part of Europe in the Northern Caucasus mountains. The capital of the republic is the city of Grozny...
(3.38), Tyva
Tuva
The Tyva Republic , or Tuva , is a federal subject of Russia . It lies in the geographical center of Asia, in southern Siberia. The republic borders with the Altai Republic, the Republic of Khakassia, Krasnoyarsk Krai, Irkutsk Oblast, and the Republic of Buryatia in Russia and with Mongolia to the...
(2.81), Ust-Orda Buryat Okrug (2.73), Agin-Buryat Okrug (2.63), Komi-Permyak
Komi-Permyak Okrug
Komi-Permyak Okrug , or Permyakia is a territory with special status within Perm Krai, Russia. Population: It was a federal subject of Russia until December 1, 2005. It was called Komi-Permyak Autonomous Okrug at that time.-History:Komi-Permyak Autonomous Okrug was established on February...
(2.16), Evenk Okrug (2.58), Altai Republic
Altai Republic
Altai Republic is a federal subject of Russia . Its capital is the town of Gorno-Altaysk. The area of the republic is . Population: -Geography:...
(2.36), Nenets Autonomous Okrug
Nenets Autonomous Okrug
Nenets Autonomous Okrug is a federal subject of Russia .It has an area of 176,700 km2 and population of 42,628 as of the preliminary results of the 2010 Census , 21,296 of whom live in Naryan-Mar, the administrative center.-Geography and ecology:The arctic ecology of this...
(2.1). Of these federal subjects, four have an ethnic Russian majority (Altai, Evenk, Ust-Orda and Nenets).
In every region in Russia rural areas reported higher TFR compared to urban areas. In most of the federal subjects in Siberia
Siberia
Siberia is an extensive region constituting almost all of Northern Asia. Comprising the central and eastern portion of the Russian Federation, it was part of the Soviet Union from its beginning, as its predecessor states, the Tsardom of Russia and the Russian Empire, conquered it during the 16th...
and the Russian Far East
Russian Far East
Russian Far East is a term that refers to the Russian part of the Far East, i.e., extreme east parts of Russia, between Lake Baikal in Eastern Siberia and the Pacific Ocean...
, the total fertility rates were high, but not high enough to ensure population replacement. For example, Zabaykalsky Krai had a TFR of 1.82, which is higher than the national average, but less than the 2.1 needed for population replacement.
TFR in comparison with other countries
Compared to other G8 countriesG8
The Group of Eight is a forum, created by France in 1975, for the governments of seven major economies: Canada, France, Germany, Italy, Japan, the United Kingdom, and the United States. In 1997, the group added Russia, thus becoming the G8...
, in 2010, Russian TFR of 1,59 children/ woman was significantly lower than that of the
United States (2,09), Early Modern France (2,01), the (1,92). Yet it approximately equals to the TFR of Canada (1,57), and is higher than in other G8 countries: Germany (1,36), Japan (1,39), and Italy (1,40).Compared to other most populous nations, Russia has a lower TFR than
Nigeria (4,82), Pakistan (3,13), India (2,65), Indonesia (2,28), Brazil (2,19), the USA, and the same TFR as Mainland China (1,54).Compared to it's neighbors, in 2010 Russia has a lower TFR than
Kazakhstan (2,67), Mongolia (2,22), Azerbaijan (2,03), Norway (1,97), North Korea (1,94), Finland (1,88) and Estonia (1,63). Russian TFR close to the Chinese one, and is higher than in Lithuania (1,53), Georgia (country) (1,52), Belarus (1,47), Ukraine (1,44), Poland (1,38) and Latvia (1,17).See also: List of countries by fertility rate
Ethnic groups
The Russian Federation is home to as many as 160 different ethnic groups and indigenous peoples. As of the 2002 census, 79.83% of the population (115,889,107 people) is ethnically RussianRussians
The Russian people are an East Slavic ethnic group native to Russia, speaking the Russian language and primarily living in Russia and neighboring countries....
, followed by (groups larger than one million):
- 3.83% TatarsTatarsTatars are a Turkic speaking ethnic group , numbering roughly 7 million.The majority of Tatars live in the Russian Federation, with a population of around 5.5 million, about 2 million of which in the republic of Tatarstan.Significant minority populations are found in Uzbekistan, Kazakhstan,...
(5,554,601) - 2.03% UkrainiansUkrainiansUkrainians are an East Slavic ethnic group native to Ukraine, which is the sixth-largest nation in Europe. The Constitution of Ukraine applies the term 'Ukrainians' to all its citizens...
(2,942,961) - 1.15% BashkirsBashkirsThe Bashkirs are a Turkic people indigenous to Bashkortostan extending on both parts of the Ural mountains, on the place where Europe meets Asia. Groups of Bashkirs also live in the republic of Tatarstan, Perm Krai, Chelyabinsk, Orenburg, Tyumen, Sverdlovsk, Kurgan, Samara and Saratov Oblasts of...
(1,673,389) - 1.13% ChuvashsChuvash peopleThe Chuvash people are a Turkic ethnic group, native to an area stretching from the Volga Region to Siberia. Most of them live in Republic of Chuvashia and surrounding areas, although Chuvash communities may be found throughout all Russia.- Etymology :...
(1,637,094) - 0.94% ChechensChechen peopleChechens constitute the largest native ethnic group originating in the North Caucasus region. They refer to themselves as Noxçi . Also known as Sadiks , Gargareans, Malkhs...
(1,360,253) - 0.78% ArmeniansArmeniansArmenian people or Armenians are a nation and ethnic group native to the Armenian Highland.The largest concentration is in Armenia having a nearly-homogeneous population with 97.9% or 3,145,354 being ethnic Armenian....
(1,130,491)
Most smaller groups live compactly in their respective regions and can be categorized by language group
The ethnic divisions used here are those of the official census, and may in some respects be controversial. The following lists all ethnicites resolved by the 2002 census, grouped by language:
- Indo-EuropeanIndo-European languagesThe Indo-European languages are a family of several hundred related languages and dialects, including most major current languages of Europe, the Iranian plateau, and South Asia and also historically predominant in Anatolia...
122,687,275 (total 84.07%; 83.27% Slavs)- RussiansRussiansThe Russian people are an East Slavic ethnic group native to Russia, speaking the Russian language and primarily living in Russia and neighboring countries....
115,889,107 (79.83%) - UkrainiansUkrainiansUkrainians are an East Slavic ethnic group native to Ukraine, which is the sixth-largest nation in Europe. The Constitution of Ukraine applies the term 'Ukrainians' to all its citizens...
2,942,961 (2.03%) - ArmeniansArmeniansArmenian people or Armenians are a nation and ethnic group native to the Armenian Highland.The largest concentration is in Armenia having a nearly-homogeneous population with 97.9% or 3,145,354 being ethnic Armenian....
1,130,491 (0.78%) - Belarusians 807,970 (0.56%)
- GermansHistory of Germans in Russia and the Soviet UnionThe German minority in Russia and the Soviet Union was created from several sources and in several waves. The 1914 census puts the number of Germans living in Russian Empire at 2,416,290. In 1989, the German population of the Soviet Union was roughly 2 million. In the 2002 Russian census, 597,212...
597,212 (0.41%) - OssetiansOssetiansThe Ossetians are an Iranic ethnic group of the Caucasus Mountains, eponymous of the region known as Ossetia.They speak Ossetic, an Iranian language of the Eastern branch, with most also fluent in Russian as a second language....
514,875 (0.35%) - Roma 182,766 (0.13%)
- MoldovansMoldovansMoldovans or Moldavians are the largest population group of Moldova...
172,330 (0.12%) - Tajiks 120,136 (0.08%)
- GreeksGreeksThe Greeks, also known as the Hellenes , are a nation and ethnic group native to Greece, Cyprus and neighboring regions. They also form a significant diaspora, with Greek communities established around the world....
97,827 (0.07%) - PolesPolesthumb|right|180px|The state flag of [[Poland]] as used by Polish government and diplomatic authoritiesThe Polish people, or Poles , are a nation indigenous to Poland. They are united by the Polish language, which belongs to the historical Lechitic subgroup of West Slavic languages of Central Europe...
73,001 (0.05%) - IraniansPersian peopleThe Persian people are part of the Iranian peoples who speak the modern Persian language and closely akin Iranian dialects and languages. The origin of the ethnic Iranian/Persian peoples are traced to the Ancient Iranian peoples, who were part of the ancient Indo-Iranians and themselves part of...
50,242 (0.036%) - LithuaniansLithuaniansLithuanians are the Baltic ethnic group native to Lithuania, where they number around 2,765,600 people. Another million or more make up the Lithuanian diaspora, largely found in countries such as the United States, Brazil, Canada, Colombia, Russia, United Kingdom and Ireland. Their native language...
45,569 (0.03%) - BulgariansBulgariansThe Bulgarians are a South Slavic nation and ethnic group native to Bulgaria and neighbouring regions. Emigration has resulted in immigrant communities in a number of other countries.-History and ethnogenesis:...
31,965 (0.02%) - LatviansLatviansLatvians or Letts are the indigenous Baltic people of Latvia.-History:Latvians occasionally refer to themselves by the ancient name of Latvji, which may have originated from the word Latve which is a name of the river that presumably flowed through what is now eastern Latvia...
28,520 (0.02%) - TatsTatsTats are an Iranian people, presently living within Azerbaijan, Armenia, and Russia ....
2,303 (0.00%)
- Russians
- TurkicTurkic peoplesThe Turkic peoples are peoples residing in northern, central and western Asia, southern Siberia and northwestern China and parts of eastern Europe. They speak languages belonging to the Turkic language family. They share, to varying degrees, certain cultural traits and historical backgrounds...
12,106,587 (total 8.36%)- TatarsTatarsTatars are a Turkic speaking ethnic group , numbering roughly 7 million.The majority of Tatars live in the Russian Federation, with a population of around 5.5 million, about 2 million of which in the republic of Tatarstan.Significant minority populations are found in Uzbekistan, Kazakhstan,...
5,554,601 (3.83%) - BashkirsBashkirsThe Bashkirs are a Turkic people indigenous to Bashkortostan extending on both parts of the Ural mountains, on the place where Europe meets Asia. Groups of Bashkirs also live in the republic of Tatarstan, Perm Krai, Chelyabinsk, Orenburg, Tyumen, Sverdlovsk, Kurgan, Samara and Saratov Oblasts of...
1,673,389 (1.15%) - ChuvashsChuvash peopleThe Chuvash people are a Turkic ethnic group, native to an area stretching from the Volga Region to Siberia. Most of them live in Republic of Chuvashia and surrounding areas, although Chuvash communities may be found throughout all Russia.- Etymology :...
1,637,094 (1.13%) - KazakhsKazakhsThe Kazakhs are a Turkic people of the northern parts of Central Asia ....
653,962 (0.45%) - Azerbaijani 621,840 (0.43%)
- YakutsYakutsYakuts , are a Turkic people associated with the Sakha Republic.The Yakut or Sakha language belongs to the Northern branch of the Turkic family of languages....
443,852 (0.31%) - KumyksKumyksKumyks are a Turkic people occupying the Kumyk plateau in north Dagestan and south Terek, and the lands bordering the Caspian Sea. They comprise 14% of the population of the Russian republic of Dagestan. They speak the Kumyk language...
422,409 (0.29%) - TuvansTuvansTuvans or Tuvinians are Turkic peoples living in southern Siberia. They are historically known as one of the Uriankhai, from the Mongolian designation...
243,442 (0.17%) - KarachaysKarachaysThe Karachays are Turkic speaking people of the North Caucasus, mostly situated in the Russian Karachay-Cherkess Republic.-History:The Karachays are a Turkic speaking people descending from the Kipchaks and probably the Cumans, with some admixture of the medieval Alans and native Caucasians; their...
192,182 (0.13%) - UzbeksUzbeksThe Uzbeks are a Turkic ethnic group in Central Asia. They comprise the majority population of Uzbekistan, and large populations can also be found in Afghanistan, Tajikstan, Kyrgyzstan, Turkmenistan, Kazakhstan, Russia, Pakistan, Mongolia and the Xinjiang Uyghur Autonomous Region of China...
122,916 (0.08%) - BalkarsBalkarsThe Balkars are a Turkic people of the Caucasus region, one of the titular populations of Kabardino-Balkaria. They are possibly Bulgars or are descended from them...
108,426 (0.07%) - TurksTurkish peopleTurkish people, also known as the "Turks" , are an ethnic group primarily living in Turkey and in the former lands of the Ottoman Empire where Turkish minorities had been established in Bulgaria, Cyprus, Bosnia and Herzegovina, Georgia, Greece, Kosovo, Macedonia, and Romania...
95,672 (0.06%) - NogaisNogaisThe Nogai people are a Turkic ethnic group in Southern Russia: northern Dagestan and Stavropol Krai, as well as in Karachay-Cherkessia and the Astrakhan Oblast; undefined number live in Chechnya...
90,666 (0.06%) - KhakasKhakasThe Khakas, or Khakass , are a Turkic-speaking people, who live in Russia, in the republic of Khakassia in southern Siberia. They speak the Khakas language.The origin of the Khakas people is disputed...
75,622 (0.05%) - Altay peoplesAltay languageAltay is a language of the Turkic group of languages. It is an official language of Altai Republic, Russia. The language was called Oyrot prior to 1948. There were ca...
67,239 (0.05%) - TurkmensTurkmen peopleThe Turkmen are a Turkic people located primarily in the Central Asian states of Turkmenistan, Afghanistan, and northeastern Iran. They speak the Turkmen language, which is classified as a part of the Western Oghuz branch of the Turkic languages family together with Turkish, Azerbaijani, Qashqai,...
33,053 (0.02%) - Kyrgyz 31,808 (0.02%)
- ShorsShorsShors or Shorians are a Turkic people in the Kemerovo Oblast in Russia. Their self designation is Шор, or Shor. They were also called Kuznetskie Tatars , Kondoma Tatars , Mras-Su Tatars in some of the documents of the 17th-18th centuries.Most of Shors live in the Tom basin along the Kondoma and...
13,975 (0.01%) - GagauzGagauz peopleThe Gagauz people are Turkic speaking group living mostly in southern Moldova , southwestern Ukraine , south-eastern Romania and northeastern Bulgaria. Unlike most other Turkic speaking people, the Gagauz are predominantly Orthodox Christians...
12,210 (0.01%) - DolgansDolgansDolgans are a Turkic-speaking people, who mostly inhabit Krasnoyarsk Krai, Russia. The 2002 Census counted 7,261 Dolgans. This number includes 5,517 in former Taymyr Autonomous Okrug. There are 26 Dolgans in Ukraine, four of whom speak Dolgan .Dolgans speak Dolgan language. Some believe that it is...
7,261 (0.01%) - Crimean TatarsCrimean TatarsCrimean Tatars or Crimeans are a Turkic ethnic group that originally resided in Crimea. They speak the Crimean Tatar language...
4,131 (0.00%) - TofalarTofalarTofalars ; or the "Tof people" are a Turkic people in the Irkutsk Oblast in Russia. Their origins, Tofa language, and culture are close to those of the eastern Tuvans-Todzhins. Before the 1917 October Coup, the Tofalars used to be engaged in nomadic reindeer breeding in taiga and hunting...
837 (0.00%)
- Tatars
- CaucasianLanguages of the CaucasusThe languages of the Caucasus are a large and extremely varied array of languages spoken by more than ten million people in and around the Caucasus Mountains, which lie between the Black Sea and the Caspian Sea....
4,822,600 (total 3.30%)- ChechensChechen peopleChechens constitute the largest native ethnic group originating in the North Caucasus region. They refer to themselves as Noxçi . Also known as Sadiks , Gargareans, Malkhs...
1,360,253 (0.94%) - AvarsCaucasian AvarsAvars or Caucasian Avars are a modern people of Caucasus, mainly of Dagestan, in which they are the predominant group. The Caucasian Avar language belongs to the Northeast Caucasian language family ....
814,473 (0.56%) - KabardKabardKabarda or Kabard ; are terms referring to a people of the northern Caucasus more commonly known by the plural term Kabardin . Originally they Kabarda or Kabard ; are terms referring to a people of the northern Caucasus more commonly known by the plural term Kabardin (or Kebertei as they term...
ians 519,958 (0.36%) - DarginsDargin peopleThe Dargwa or Dargin people are a Northeast Caucasian ethnic group of the Caucasus who live mainly in the Russian republic of Dagestan. They speak the Dargwa language...
510,156 (0.35%) - IngushIngush peopleThe Ingush are a native ethnic group of the North Caucasus, mostly inhabiting the Russian republic of Ingushetia. They refer to themselves as Ghalghai . The Ingush are predominantly Sunni Muslims and speak the Ingush language...
413,016 (0.28%) - LezginsLezginsThe Lezgians are an ethnic group living predominantly in southern Dagestan and northeastern Azerbaijan and who speak the Lezgian language.- Historical concept :While ancient Greek historians, including Herodotus, Strabo, and Pliny the Elder, referred...
411,535 (0.28%) - GeorgiansGeorgian peopleThe Georgians are an ethnic group that have originated in Georgia, where they constitute a majority of the population. Large Georgian communities are also present throughout Russia, European Union, United States, and South America....
197,934 (0.14%) - LaksLak people (Dagestan)The Laks, self-designation Lak, are an indigenous people of Dagestan, speaking the Lak language. There are about 170,000 ethnic Laks.-History:An ancient polity on the Lak territory was the principality of Gumik...
156,545 (0.11%) - Tabasarans 131,785 (0.09%)
- AdygheAdyghe peopleThe Adyghe or Adygs , also often known as Circassians or Cherkess, are in origin a North Caucasian ethnic groupwho were displaced in the course of the Russian conquest of the Caucasus in the 19th century, especially after the Russian–Circassian War of 1862.Adyghe people mostly speak Adyghe and most...
128,528 (0.09%) - Circassians 60,517 (0.04%)
- AbazasAbazinsThe Abazins are a people who live mostly in Karachay-Cherkessia and Adygea of Russia.An Abazin diaspora exists in Turkey, Jordan, Syria, Egypt , and other Islamic countries, most of which are descendants of refugees from the Caucasian War...
37,942 (0.03%) - RutulsRutulsRutuls are an ethnic group in Dagestan and some parts of Azerbaijan. According to the 2002 Russian Census, there were 29,929 Rutuls in Russia . In Azerbaijan there are more than 45.000 Rutuls. Today, total population of rutuls in the world - more than 97 500 people...
29,929 (0.02%) - AgulsAgulsAguls are a people in Dagestan, Russia. According to the 2002 census, there were 28,297 Aguls in Russia . The Aghul language belongs to the Lezgian language family, a group of the Northeast Caucasian family. Ethnically, the Aguls are close to the Lezgins...
28,297 (0.02%) - AbkhazAbkhaz peopleThe Abkhaz or Abkhazians are a Caucasian ethnic group, mainly living in Abkhazia, a disputed region on the Black Sea coast. A large Abkhazian diaspora population resides in Turkey, the origins of which lie in the emigration from the Caucasus in the late 19th century known as Muhajirism...
11,366 (0.01%) - Tsakhurs 10,366 (0.01%)
- Chechens
- UralicUralic languagesThe Uralic languages constitute a language family of some three dozen languages spoken by approximately 25 million people. The healthiest Uralic languages in terms of the number of native speakers are Hungarian, Finnish, Estonian, Mari and Udmurt...
2,757,488 (1.91%)- Mordvins 843,350 (0.58%)
- UdmurtsUdmurt peopleThe Udmurts are a people who speak the Udmurt language. Through history they have been known in Russian as Chud Otyatskaya , Otyaks, or Votyaks , and in Tatar as Ar....
636,906 (0.44%) - Mari 604,298 (0.42%)
- KomiKomi peoplesThe Komi people is an ethnic group whose homeland is in the north-east of European Russia around the basins of the Vychegda, Pechora and Kama rivers. They mostly live in the Komi Republic, Perm Krai, Murmansk Oblast, Khanty-Mansi Autonomous Okrug, and Yamalo-Nenets Autonomous Okrug in the Russian...
293,406 (0.20%) - Komi-PermyakKomi peoplesThe Komi people is an ethnic group whose homeland is in the north-east of European Russia around the basins of the Vychegda, Pechora and Kama rivers. They mostly live in the Komi Republic, Perm Krai, Murmansk Oblast, Khanty-Mansi Autonomous Okrug, and Yamalo-Nenets Autonomous Okrug in the Russian...
125,235 (0.09%) - KareliansKareliansThe Karelians are a Baltic-Finnic ethnic group living mostly in the Republic of Karelia and in other north-western parts of the Russian Federation. The historic homeland of Karelians includes also parts of present-day Eastern Finland and the formerly Finnish territory of Ladoga Karelia...
93,344 (0.06%) - Finns 34,050 (0.02%)
- KhantyKhanty peopleKhanty / Hanti are an indigenous people calling themselves Khanti, Khande, Kantek , living in Khanty-Mansi Autonomous Okrug, a region historically known as "Yugra" in Russia, together with the Mansi. In the autonomous okrug, the Khanty and Mansi languages are given co-official status with Russian...
28,678 (0.02%) - EstoniansEstoniansEstonians are a Finnic people closely related to the Finns and inhabiting, primarily, the country of Estonia. They speak a Finnic language known as Estonian...
28,113 (0.02%) - Mansi 11,432 (0.01%)
- Veps 8,240 (0.01%)
- SamiSami peopleThe Sami people, also spelled Sámi, or Saami, are the arctic indigenous people inhabiting Sápmi, which today encompasses parts of far northern Sweden, Norway, Finland, the Kola Peninsula of Russia, and the border area between south and middle Sweden and Norway. The Sámi are Europe’s northernmost...
1,991 (0.00%) - IzhoriansIzhoriansThe Izhorians , along with the Votes are an indigenous people of Ingria. Small numbers can still be found in the Western part of Ingria, between the Narva and Neva rivers in northwestern Russia.- History :The history of the Izhorians is bound to the history of Ingria...
314 (0.00%) - SamoyedicSamoyedic languagesThe Samoyedic languages are spoken on both sides of the Ural mountains, in northernmost Eurasia, by approximately 30,000 speakers altogether....
48,131 (0.03%)- NenetsNenets peopleThe Nenets are an indigenous people in Russia. According to the latest census in 2002, there are 41,302 Nenets in the Russian Federation, most of them living in the Yamalo-Nenets Autonomous Okrug and Nenets Autonomous Okrug...
41,302 (0.03%) - Selkups 4,249 (0.00%)
- NganasansNganasan peopleThe Nganasans are one of the indigenous peoples of Siberia. They are the northernmost of the Samoyedic peoples, living on the Taymyr Peninsula by the Arctic Ocean. Their territory is part of Krasnoyarsk Krai. Their "capital" is the settlement of Ust-Avam...
834 (0.00%) - EnetsEnets peopleThe Enets people , or Yenetses, Entsy, Entsi, Yenisei, Yenisei-Samoyed, Yenisey Samoyeds or Yeniseian people are a traditionally nomadic people who live on the east bank, near the mouth, of the Yenisei River. Many live in the village of Potapovo in Krasnoyarsk Krai in western Siberia near the...
237 (0.00%)
- Nenets
- YukaghirYukaghirThe Yukaghir, or Yukagirs , деткиль ) are a people in East Siberia, living in the basin of the Kolyma River.-Region:The Tundra Yukaghirs live in the Lower Kolyma region in the Sakha Republic; the Taiga Yukaghirs in the Upper Kolyma region in the Sakha Republic and in Srednekansky District of...
1,509 (0.00%)
- MongolsMongolsMongols ) are a Central-East Asian ethnic group that lives mainly in the countries of Mongolia, China, and Russia. In China, ethnic Mongols can be found mainly in the central north region of China such as Inner Mongolia...
619,171 (0.43%)- BuryatsBuryatsThe Buryats or Buriyads , numbering approximately 436,000, are the largest ethnic minority group in Siberia and are mainly concentrated in their homeland, the Buryat Republic, a federal subject of Russia...
445,175 (0.31%) - Kalmyks 173,996 (0.12%)
- Buryats
- VietnameseVietnamese peopleThe Vietnamese people are an ethnic group originating from present-day northern Vietnam and southern China. They are the majority ethnic group of Vietnam, comprising 86% of the population as of the 1999 census, and are officially known as Kinh to distinguish them from other ethnic groups in Vietnam...
296,556 (0.20%)
- Semitic peoplesSemitic languagesThe Semitic languages are a group of related languages whose living representatives are spoken by more than 270 million people across much of the Middle East, North Africa and the Horn of Africa...
243,587 (0.17%)- JewsHistory of the Jews in Russia and the Soviet UnionThe vast territories of the Russian Empire at one time hosted the largest populations of Jews in the diaspora. Within these territories the Jewish community flourished and developed many of modern Judaism's most distinctive theological and cultural traditions, while also facing periods of...
229,938 (0.16%) - AssyriansAssyrian peopleThe Assyrian people are a distinct ethnic group whose origins lie in ancient Mesopotamia...
13,649 (0.01%)
- Jews
- Koreans 148,556 (0.10%)
- Manchu-TungusTungusic languagesThe Tungusic languages form a language family spoken in Eastern Siberia and Manchuria by Tungusic peoples. Many Tungusic languages are endangered, and the long-term future of the family is uncertain...
72,927 (0.02%)- EvenksEvenksThe Evenks are a Tungusic people of Northern Asia. In Russia, the Evenks are recognized as one of the Indigenous peoples of the Russian North, with a population of 35,527...
35,527 (0.02%) - EvensEvensThe Evens or Eveny are a people in Siberia and the Russian Far East. They live in some of the regions of the Magadan Oblast and Kamchatka Krai and northern parts of Sakha east of the Lena River. According to the 2002 census, there were 19,071 Evens in Russia...
19,071 (0.01%) - Nanais 12,160 (0.01%)
- UlchsUlchsThe Ulch are an indigenous people of the Russian Far East who speak a Tungusic language, Ulch. Over 90% of Ulchis live in Ulchsky District of Khabarovsk Krai, Russia...
2,913 (0.00%) - Udege 1,657 (0.00%)
- Orochs 686 (0.00%)
- NegidalsNegidalsNegidals are a people in the Khabarovsk Krai in Russia, who live along the Amgun River and Amur River...
567 (0.00%) - Oroks 346 (0.00%)
- Evenks
- Chukotko-KamchatkanChukotko-Kamchatkan languagesThe Chukotko-Kamchatkan or Chukchi–Kamchatkan languages are a language family of extreme northeastern Siberia. Its speakers are indigenous hunter-gatherers and reindeer-herders....
28,777 (0.02%)- ChukchiChukchi peopleThe Chukchi, or Chukchee , ) are an indigenous people inhabiting the Chukchi Peninsula and the shores of the Chukchi Sea and the Bering Sea region of the Arctic Ocean within the Russian Federation. They speak the Chukchi language...
15,767 (0.01%) - KoryakKoryaksKoryaks are an indigenous people of Kamchatka Krai in the Russian Far East, who inhabit the coastlands of the Bering Sea to the south of the Anadyr basin and the country to the immediate north of the Kamchatka Peninsula, the southernmost limit of their range being Tigilsk. They are akin to the...
8,743 (0.01%) - ItelmeniItelmensThe Itelmen, sometimes known as Kamchadal, are an ethnic group who are the original inhabitants living on the Kamchatka Peninsula in Russia. The Itelmen language is distantly related to Chukchi and Koryak, forming the Chukotko-Kamchatkan language family, but it is now virtually extinct, the vast...
3,180 (0.00%) - ChuvansChuvansChuvans are one of the forty or so "less-numerous peoples of the North" recognized by the Russian government. Most Chuvans today live within Chukotka Autonomous Okrug in the far northeast of Russia...
1,087 (0.00%)
- Chukchi
- Nivkh 5,162 (0.00%)
- Eskimo–Aleut 2,290 (0.00%)
- EskimoEskimoEskimos or Inuit–Yupik peoples are indigenous peoples who have traditionally inhabited the circumpolar region from eastern Siberia , across Alaska , Canada, and Greenland....
1,750 (0.00%) - AleutAleut languageAleut is a language of the Eskimo–Aleut language family. It is the heritage language of the Aleut people living in the Aleutian Islands, Pribilof Islands, and Commander Islands. As of 2007 there were about 150 speakers of Aleut .- Dialects :Aleut is alone with the Eskimo languages in the...
540 (0.00%)
- Eskimo
- KetKet peopleKets are a Siberian people who speak the Ket language. In Imperial Russia they were called Ostyaks, without differentiating them from several other Siberian peoples. Later they became known as Yenisey ostyaks, because they lived in the middle and lower basin of the Yenisei River in the Krasnoyarsk...
1,494 (0.00%)
Czech people
Czechs, or Czech people are a western Slavic people of Central Europe, living predominantly in the Czech Republic. Small populations of Czechs also live in Slovakia, Austria, the United States, the United Kingdom, Chile, Argentina, Canada, Germany, Russia and other countries...
, Japanese
Japanese people
The are an ethnic group originating in the Japanese archipelago and are the predominant ethnic group of Japan. Worldwide, approximately 130 million people are of Japanese descent; of these, approximately 127 million are residents of Japan. People of Japanese ancestry who live in other countries...
, Chinese
Chinese people
The term Chinese people may refer to any of the following:*People with Han Chinese ethnicity ....
, Spaniards, Italians
Italian people
The Italian people are an ethnic group that share a common Italian culture, ancestry and speak the Italian language as a mother tongue. Within Italy, Italians are defined by citizenship, regardless of ancestry or country of residence , and are distinguished from people...
, Scandinavians
Scandinavians
Scandinavians are a group of Germanic peoples, inhabiting Scandinavia and to a lesser extent countries associated with Scandinavia, and speaking Scandinavian languages. The group includes Danes, Norwegians and Swedes, and additionally the descendants of Scandinavian settlers such as the Icelandic...
and Romanians
Romanians
The Romanians are an ethnic group native to Romania, who speak Romanian; they are the majority inhabitants of Romania....
. There are even Africans in Russia (See Afro-Russian
Afro-Russian
Afro-Russians are Russians of Black African descent, including Black people who have settled in Russia and their mixed-race children. The Metis Foundation estimates that there are about 40,000 mixed-race Russians.-First African arrivals:...
).
See also: Northern indigenous peoples of Russia, Detailed Table of 2002 census
Gradient
The demographic structure of Russia has gradually changed over time. In 1970, the Soviet Union had the third largest population of Jews in the world, estimated at 2,150,000, following only that of the United States and IsraelIsrael
The State of Israel is a parliamentary republic located in the Middle East, along the eastern shore of the Mediterranean Sea...
. By 2002, due to Jewish emigration, their number fell as low as 230,000. A sizeable emigration of other minorities has been enduring, too. Predominantly these are European peoples like Germans, Czechs, Greeks and members of their families. The main destinations are the USA (Jews, Belarussians, Chechens, Meskhetian Turks, Ukrainians and others), Israel
Israel
The State of Israel is a parliamentary republic located in the Middle East, along the eastern shore of the Mediterranean Sea...
(Jews), Germany (Germans and Jews), Poland
Poland
Poland , officially the Republic of Poland , is a country in Central Europe bordered by Germany to the west; the Czech Republic and Slovakia to the south; Ukraine, Belarus and Lithuania to the east; and the Baltic Sea and Kaliningrad Oblast, a Russian exclave, to the north...
(Poles and Jews), Canada (Finns and Ukrainians), Finland
Finland
Finland , officially the Republic of Finland, is a Nordic country situated in the Fennoscandian region of Northern Europe. It is bordered by Sweden in the west, Norway in the north and Russia in the east, while Estonia lies to its south across the Gulf of Finland.Around 5.4 million people reside...
(Finns), France (Jews, Armenians and Romani) and the United Kingdom (mainly rich Russians).
At the same time, Russia experiences a constant flow of immigration. On average, close to 300,000 legal immigrants enter the country every year; about half are ethnic Russians from the other republics of the former Soviet Union. In addition, There are an estimated 4 million illegal immigrants from the ex-Soviet
Republics of the Soviet Union
The Republics of the Soviet Union or the Union Republics of the Soviet Union were ethnically-based administrative units that were subordinated directly to the Government of the Soviet Union...
states in Russia. There is a significant inflow of ethnic Georgians
Georgians
The Georgians are an ethnic group that have originated in Georgia, where they constitute a majority of the population. Large Georgian communities are also present throughout Russia, European Union, United States, and South America....
, Armenians
Armenians
Armenian people or Armenians are a nation and ethnic group native to the Armenian Highland.The largest concentration is in Armenia having a nearly-homogeneous population with 97.9% or 3,145,354 being ethnic Armenian....
, Azerbaijanis, Uzbeks
Uzbeks
The Uzbeks are a Turkic ethnic group in Central Asia. They comprise the majority population of Uzbekistan, and large populations can also be found in Afghanistan, Tajikstan, Kyrgyzstan, Turkmenistan, Kazakhstan, Russia, Pakistan, Mongolia and the Xinjiang Uyghur Autonomous Region of China...
, Kyrgyz, Tajiks, and Ukrainians
Ukrainians
Ukrainians are an East Slavic ethnic group native to Ukraine, which is the sixth-largest nation in Europe. The Constitution of Ukraine applies the term 'Ukrainians' to all its citizens...
into big Russian cities, something that is viewed unfavorably by some citizens.
Median age and fertility
Median ages of ethnic groups vary considerably between groups. Ethnic Russians and other Slavic and Finnic groups have higher median age compared to the Caucasian groups.Median ages are strongly correlated with fertility rates
Total Fertility Rate
The total fertility rate of a population is the average number of children that would be born to a woman over her lifetime if she were to experience the exact current age-specific fertility rates through her lifetime, and she...
, ethnic groups with higher fertility rates have lower median ages, and vice versa. For example, in 2002, in the ethnic group with the lowest median age – Ingush
Ingush people
The Ingush are a native ethnic group of the North Caucasus, mostly inhabiting the Russian republic of Ingushetia. They refer to themselves as Ghalghai . The Ingush are predominantly Sunni Muslims and speak the Ingush language...
– women 35 or older had, on average, 4.05 children; in the ethnic group with the highest median age – Jews – women 35 or older averaged only 1.37 children.
Ethnic Jews have both the highest median age and the lowest fertility rate; this is a consequence of Jewish emigration
Aliyah
Aliyah is the immigration of Jews to the Land of Israel . It is a basic tenet of Zionist ideology. The opposite action, emigration from Israel, is referred to as yerida . The return to the Holy Land has been a Jewish aspiration since the Babylonian exile...
.
Ethnic Russians represent a significant deviation from the pattern, with second lowest fertility rate of all major groups, but relatively low median age (37.6 years). This phenomenon is at least partly due to the fact that children from mixed marriages are often registered as ethnic Russians in the census. The most noticeable trend in the past couple of decades is the convergence of birth rates between minorities (including Muslim minorities) and the Russian majority.
The following table shows the variation in median age and fertility rates according to 2002 census.
| Ethnic Group |
Median Age |
Male |
Female |
Urban |
Urban M |
Urban F |
Rural |
Rural M |
Rural F |
Children / woman (15+) |
Children / woman (35+) |
Predominant religion |
|---|---|---|---|---|---|---|---|---|---|---|---|---|
| Russian | 37.6 | 34.0 | 40.5 | 37.1 | 33.5 | 40.1 | 39.0 | 35.7 | 41.7 | 1.446 | 1.828 | Christianity |
| Tatar | 37.7 | 35.3 | 39.6 | 37.2 | 34.7 | 39.1 | 38.8 | 36.5 | 41.1 | 1.711 | 2.204 | Islam |
| Ukrainian | 45.9 | 44.7 | 47.3 | 45.6 | 44.5 | 46.8 | 47.0 | 45.2 | 49.0 | 1.726 | 1.946 | Christianity |
| Bashkir | 34.2 | 32.1 | 36.2 | 32.9 | 30.6 | 34.7 | 35.4 | 33.3 | 37.6 | 1.969 | 2.658 | Islam |
| Chuvash | 38.6 | 36.4 | 40.4 | 37.9 | 36.3 | 39.1 | 39.4 | 36.5 | 42.5 | 1.884 | 2.379 | Christianity |
| Chechen | 22.8 | 22.1 | 23.5 | 22.9 | 22.5 | 23.4 | 22.7 | 21.9 | 23.5 | 2.163 | 3.456 | Islam |
| Armenian | 32.8 | 33.4 | 32.0 | 33.0 | 33.7 | 32.2 | 32.1 | 32.6 | 31.5 | 1.68 | 2.225 | Christianity |
| Mordvin | 44.4 | 42.1 | 46.9 | 44.2 | 42.3 | 45.9 | 44.7 | 41.7 | 48.5 | 1.986 | 2.303 | Christianity |
| Avar | 24.6 | 23.8 | 25.4 | 23.8 | 23.4 | 24.1 | 25.1 | 24.0 | 26.2 | 2.09 | 3.319 | Islam |
| Belarusian | 48.0 | 45.9 | 50.2 | 47.7 | 45.8 | 49.6 | 49.1 | 46.1 | 52.4 | 1.765 | 1.941 | Christianity |
| Kazakh/Kyrgyz | 30.2 | 29.4 | 31 | 29.5 | 29 | 30.1 | 30.6 | 29.7 | 31.4 | 2.015 | 2.964 | Islam |
| Udmurt | 40.0 | 37.4 | 42.0 | 41.2 | 39.0 | 42.6 | 38.9 | 36.1 | 41.3 | 1.93 | 2.378 | Christianity |
| Azerbaijani | 29.5 | 31.9 | 24.6 | 30.0 | 32.3 | 24.7 | 26.5 | 28.7 | 24.1 | 1.83 | 2.619 | Islam |
| Mari | 36.7 | 34.5 | 38.5 | 36.4 | 34.6 | 37.7 | 36.9 | 34.5 | 39.3 | 1.917 | 2.493 | Christianity |
| German | 39.7 | 38.2 | 41.2 | 39.6 | 38.0 | 41.0 | 40.0 | 38.4 | 41.4 | 1.864 | 2.443 | Christianity |
| Kabardin | 28.2 | 27.1 | 29.3 | 28.8 | 27.4 | 30.2 | 27.7 | 26.9 | 28.4 | 1.799 | 2.654 | Islam |
| Ossetian | 34.1 | 32.5 | 35.7 | 34.0 | 32.2 | 35.7 | 34.4 | 33.2 | 35.6 | 1.665 | 2.267 | Christianity |
| Dargwa | 24.6 | 23.9 | 25.3 | 24.3 | 23.8 | 24.8 | 24.8 | 24.0 | 25.6 | 2.162 | 3.476 | Islam |
| Buryat | 28.6 | 26.6 | 30.5 | 27.6 | 25.7 | 29.5 | 29.5 | 27.4 | 31.5 | 1.949 | 2.861 | Buddhism |
| Yakut | 26.9 | 25.1 | 28.7 | 26.9 | 25.2 | 28.5 | 27.0 | 25.1 | 28.8 | 1.972 | 2.843 | Christianity |
| Kumyk | 24.6 | 23.7 | 25.4 | 24.8 | 23.9 | 25.6 | 24.4 | 23.5 | 25.2 | 1.977 | 3.123 | Islam |
| Ingush | 22.7 | 22.4 | 23.0 | 22.9 | 22.5 | 23.4 | 22.5 | 22.3 | 22.7 | 2.325 | 4.05 | Islam |
| Lezgian | 25.4 | 25.2 | 25.7 | 25.0 | 25.2 | 24.8 | 25.9 | 25.2 | 26.6 | 2.045 | 3.275 | Islam |
| Komi | 38.8 | 35.8 | 41.0 | 39.4 | 35.5 | 41.6 | 38.3 | 36.0 | 40.4 | 1.869 | 2.363 | Christianity |
| Tuvan | 23.0 | 21.7 | 24.2 | 22.3 | 21.4 | 23.3 | 23.6 | 22.0 | 25.1 | 1.996 | 3.407 | Buddhism |
| Jewish | 57.5 | 55.7 | 61.1 | 57.6 | 55.7 | 61.2 | 53.5 | 52.0 | 55.3 | 1.264 | 1.371 | Judaism |
| Karachay | 29.5 | 28.3 | 30.5 | 27.6 | 26.4 | 28.9 | 30.5 | 29.5 | 31.5 | 1.86 | 2.836 | Islam |
| Kalmyk | 31.3 | 29.2 | 33.3 | 28.6 | 26.3 | 31.3 | 33.9 | 32.6 | 35.1 | 1.853 | 2.625 | Buddhism |
| Adyghe | 34.2 | 32.4 | 36.0 | 32.0 | 30.3 | 33.7 | 36.2 | 34.2 | 38.2 | 1.757 | 2.363 | Islam |
| Permyak | 40.8 | 38.6 | 42.7 | 41.3 | 39.5 | 42.5 | 40.5 | 38.1 | 42.8 | 2.145 | 2.604 | Christianity |
| Balkar | 30.1 | 29.5 | 30.7 | 29.3 | 28.8 | 29.8 | 30.9 | 30.1 | 31.9 | 1.689 | 2.624 | Islam |
| Karelian | 45.7 | 42.4 | 48.6 | 44.7 | 41.3 | 47.2 | 47.0 | 43.5 | 51.2 | 1.823 | 2.108 | Christianity |
| Kazakh | 30.7 | 28.4 | 32.9 | 30.1 | 27.9 | 32.4 | 31.2 | 28.8 | 33.5 | 1.872 | 2.609 | Islam |
| Altay | 27.5 | 25.5 | 29.4 | 22.7 | 21.5 | 24.2 | 28.9 | 26.9 | 30.8 | 2.021 | 2.933 | Buddhism |
| Cherkess | 31.2 | 30.1 | 32.3 | 29.7 | 28.3 | 30.9 | 32.1 | 31.1 | 33.3 | 1.807 | 2.607 | Islam |
Languages
Russian is the common official language throughout RussiaRussia
Russia or , officially known as both Russia and the Russian Federation , is a country in northern Eurasia. It is a federal semi-presidential republic, comprising 83 federal subjects...
understood by 99% of its current inhabitants and widespread in many adjacent areas of Asia and Eastern Europe. National subdivisions of Russia have additional official languages (see their respective articles). There are more than 100 languages spoken in Russia, many of which are in danger of extinction
Endangered language
An endangered language is a language that is at risk of falling out of use. If it loses all its native speakers, it becomes a dead language. If eventually no one speaks the language at all it becomes an "extinct language"....
.
Religion
Russian Orthodox Church
The Russian Orthodox Church or, alternatively, the Moscow Patriarchate The ROC is often said to be the largest of the Eastern Orthodox churches in the world; including all the autocephalous churches under its umbrella, its adherents number over 150 million worldwide—about half of the 300 million...
. A survey by ВЦИОМ
VCIOM
All-Russian Center for the Study of Public Opinion, VTsIOM, [established in 1987; till 1992 – All-Union Center for the Study of Public Opinion] is the oldest polling institution in the post-Soviet space and is one of the leading sociological and market research companies in Russia.-General...
in 2010 (with a 3.4% margin of error) found that 73% of the Russian population is Orthodox and 6% is Muslim. 1% believed in other faiths and the remainder were non-religious, or self-identified atheists or agnostics (self identified religious people and non-religious people can be atheists or agnostics). 16% of the population observed fasting during Lent
Lent
In the Christian tradition, Lent is the period of the liturgical year from Ash Wednesday to Easter. The traditional purpose of Lent is the preparation of the believer – through prayer, repentance, almsgiving and self-denial – for the annual commemoration during Holy Week of the Death and...
.
Over 80% of ethnic Russians identify themselves as Orthodox. Of these, approximately 2–4% of the general population are integrated into church life (воцерковленные), while others attend on a less regular basis or not at all. Many non-religious ethnic Russians identify with the Orthodox faith for cultural reasons. The majority of Muslims live in the Volga–Ural region and the North Caucasus
North Caucasus
The North Caucasus is the northern part of the Caucasus region between the Black and Caspian Seas and within European Russia. The term is also used as a synonym for the North Caucasus economic region of Russia....
, although Moscow, Saint Petersburg, and parts of Siberia also have sizable Muslim populations. Other branches of Christianity present in Russia include Roman Catholicism (approx. 1%), Baptists, Pentecostals, Lutherans and other Protestant churches (together totalling about 0.5% of the population) and Old Believers
Old Believers
In the context of Russian Orthodox church history, the Old Believers separated after 1666 from the official Russian Orthodox Church as a protest against church reforms introduced by Patriarch Nikon between 1652–66...
. There is some presence of Judaism, Buddhism
Buddhism
Buddhism is a religion and philosophy encompassing a variety of traditions, beliefs and practices, largely based on teachings attributed to Siddhartha Gautama, commonly known as the Buddha . The Buddha lived and taught in the northeastern Indian subcontinent some time between the 6th and 4th...
, and Krishnaism
Krishnaism
Krishnaism is a group of Hindu denominations within Vaishnavism, centered on devotion to Radha Krishna or other forms of Krishna, identified with Vishnu.The central text of Krishnaism is the Bhagavad Gita....
, as well. Shamanism
Shamanism
Shamanism is an anthropological term referencing a range of beliefs and practices regarding communication with the spiritual world. To quote Eliade: "A first definition of this complex phenomenon, and perhaps the least hazardous, will be: shamanism = technique of ecstasy." Shamanism encompasses the...
and other pagan beliefs are present to some extent in remote areas, sometimes syncretized
Syncretism
Syncretism is the combining of different beliefs, often while melding practices of various schools of thought. The term means "combining", but see below for the origin of the word...
with one of the mainstream religions.
According to the 2002 Census, 9.96% of the Russian population belongs to ethnic groups which had traditionally practiced Islam (such as Tatars, Bashkirs, Chechens and Azeris). However the actual number of Muslims is expected to be much lower than this amount, due to the existence of a large number of Christian congregations among these groups (Keräşens and Nağaybäk
Nagaybäk
Nağaybäk are an ethnoconfessional group in Russia. They are Christian descendents of Volga Tatars , and former cossacks of the Orenburg Host. The majority of the Nağaybäks live in Nagaybaksky and Chebarkulsky Districts of Chelyabinsk Oblast. They speak a sub-dialect of Tatar language's Middle dialect...
s among Tatars, Mozdok Christians among Kabardians, etc. According to Vyacheslav Sanin, one-third of Adzharians, 25% each of Tatars and Adyghe and more than 10% of Kazakhs living in Russia practice Christianity, with many more being atheist). The number of Muslims among other ethnic groups is believed to be much smaller, amounting to only a few thousand. Most of the Russian sources give a figure of around 6% of the total population based on surveys, while Western sources give a figure of 10% to 15%. Depending on sources the population varies, muslim population has also been estimated as high as 20 million, the Dawn newspaper says this value is a usual estimate.
Roman Silantyev
Roman Silantyev
Roman Silantyev is a Russian sociologist Islamic expert, former executive secretary of the Interreligious Council of Russia , director of the human rights center of the World Russian People's Council, a staff member of the Moscow Patriarchate Department for External Church Relations.In 2005...
, an expert on Islam in Russia, claims that there are between 5,500 and 6,000 ethnic Slavs who are Muslim. At the same time there are more than 500,000 people of traditionally Muslim ethnicities who believe in Orthodoxy. One percent of all the adherents and over 400 priests in the Russian Orthodox Church are from Muslim ethnic groups.
Literacy
definition: age 15 and over can read and writetotal literacy: 99.4% (2002)
male: 99.7%
female: 99.2%
Russia's free, widespread and in-depth educational system, inherited with almost no changes from the Soviet Union, has produced nearly 100% literacy. 97% of children receive their compulsory 9-year basic or complete 11-year education in Russian. Other languages are also used in their respective republics, for instance Tatar
Tatar language
The Tatar language , or more specifically Kazan Tatar, is a Turkic language spoken by the Tatars of historical Kazan Khanate, including modern Tatarstan and Bashkiria...
(1%), Yakut (0.4%) etc.
About 3 million students attend Russia's 519 institutions of higher education and 48 universities. As a result of great emphasis on science and technology
Science and technology
Science and technology is a term of art used to encompass the relationship between science and technology. It frequently appears within titles of academic disciplines and government offices.-See also:...
in education, Russian medical, mathematical, scientific, and space and aviation research is generally of a high order.
Labour force
The Russian labour force is undergoing tremendous changes. Although well-educated and skilled, it is largely mismatched to the rapidly changing needs of the Russian economy. The unemployment rate in Russia was 8.1% as of 2009. Unemployment is highest among women and young people. Following the breakup of the Soviet Union and the economic dislocation it engendered, the standard of living fell dramatically. However, since recovering from the 1998 economic crisis, the standard of living has been on the rise. As of 2007 about 15% of the population was living below the poverty line, compared to 40% in 1999. The average yearly salary in Russia was $7,680 (about $13,800 PPPPurchasing power parity
In economics, purchasing power parity is a condition between countries where an amount of money has the same purchasing power in different countries. The prices of the goods between the countries would only reflect the exchange rates...
) as of May 2008, up from $455 per year in August 1999.
According to the FMS, as of 2011, there were 7,000,000 immigrants working in Russia. Half of these were from Ukraine, while the remainder was mostly from Central Asia. Only 3 million or less than half of all the immigrants are legal. Illegal immigrants number 4 million, mostly from Tajikistan, Uzbekistan and Moldova. The Census usually covers only a part of this population and the last one (2002 Census) counted one million non-citizens.
Health
In 2010, 1,140,368, or 56% of all deaths in Russia were caused by cardiovascular diseaseCardiovascular disease
Heart disease or cardiovascular disease are the class of diseases that involve the heart or blood vessels . While the term technically refers to any disease that affects the cardiovascular system , it is usually used to refer to those related to atherosclerosis...
. The second leading cause of death was cancer which claimed 292,310 lives (14.3%). External causes of death such as suicide (1.7%), road accidents (1.4%), murders (0.9%), accidental alcohol poisoning (0.7%), and accidental drowning (0.5%), claimed 206,336 lives in total (10.2%). Other major causes of death were diseases of the digestive system (4.5%), respiratory disease (3.6%), infectious and parasitic diseases (1.6%), and tuberculosis (1.1%). The infant mortality rate in 2010 was 7.5 deaths per 1,000 (down from 8.2 in 2009 and 16.9 in 1999).
As of 2010, the average life expectancy in Russia was 63.03 years for males and 74.87 years for females. The average Russian life expectancy of 68.98 years at birth is nearly 10 years shorter than the overall average figure for the European Union, or the United States. The largest contributing factor to the relatively low life expectancy is high mortality among working-age males due to preventable causes such as accidents, alcohol poisoning, violent crimes, heart disease etc. Some infectious diseases are also implicated, such as AIDS/HIV and tuberculosis
Tuberculosis
Tuberculosis, MTB, or TB is a common, and in many cases lethal, infectious disease caused by various strains of mycobacteria, usually Mycobacterium tuberculosis. Tuberculosis usually attacks the lungs but can also affect other parts of the body...
, which became more widespread in Russia in the 1990s because of the deterioration in the healthcare system. In the late 1950s, the USSR had a higher life expectancy than the United States, but the Soviet Union has lagged behind Western countries in terms of mortality and life expectancy since the late 1960s. The life expectancy was about 70 in 1986, prior to the transition-induced disruption of the healthcare system. The turmoil in the early 1990s caused life expectancy in Russia to steadily decrease while it was steadily increasing in the rest of the world. Recently however, Russian life expectancy has again begun to rise. Between 2005—2010 the male life expectancy in Russia rose by over four years, increasing the overall life expectancy by nearly 4 years to 68.98.
Abortions
In the 1980s only 8–10% of married Russian women of reproductive age used hormonal and intrauterine contraceptionContraception
Contraception is the prevention of the fusion of gametes during or after sexual activity. The term contraception is a contraction of contra, which means against, and the word conception, meaning fertilization...
methods, compared to 20–40% in developed countries. This led to much higher abortion
Abortion
Abortion is defined as the termination of pregnancy by the removal or expulsion from the uterus of a fetus or embryo prior to viability. An abortion can occur spontaneously, in which case it is usually called a miscarriage, or it can be purposely induced...
rates in Russia compared to developed countries: in the 1980s Russia had a figure of 120 abortions per 1,000 women of reproductive age compared with only 20 per 1,000 in Western countries. However, after the dissolution of the Soviet Union many changes took place, such as the demonopolization of the market for contraceptive drugs and media liberalization, which lead to a rapid conversion to more efficient pregnancy control practices. Abortion rates fell in the first half of the 1990s for the first time in Russia's history, even despite declining fertility rates. From the early 1990s to 2006, the number of expected abortions per women during her lifetime fell by nearly 2.5 times, from 3.4 to 1.2. As of 2004, the share of women of reproductive age using hormonal or intrauterine birth control methods was about 46% (29% intrauterine, 17% hormonal).
Despite clear progress in family planning, the target of desired children at the desired time for a large portion of Russian families has not yet been achieved. According to a 2004 study, current pregnancies were termed "desired and timely" by 58% of respondents, while 23% described them as "desired, but untimely", and 19% said they were "undesired". The share of unexpected pregnancies remains much lower in countries with developed family planning culture, such as the Netherlands
Netherlands
The Netherlands is a constituent country of the Kingdom of the Netherlands, located mainly in North-West Europe and with several islands in the Caribbean. Mainland Netherlands borders the North Sea to the north and west, Belgium to the south, and Germany to the east, and shares maritime borders...
, whose percentage of unwanted pregnancies 20 years ago was half of that in Russia today.
Rural life
Rural life in RussiaRussia
Russia or , officially known as both Russia and the Russian Federation , is a country in northern Eurasia. It is a federal semi-presidential republic, comprising 83 federal subjects...
is distinct from many other nations. Russia is one of few nations that have small towns hundreds of kilometres from major population centres. Villages far from towns are classified by poor living conditions: low salaries, lack of heating equipment and sewage systems, and sometimes lack of electricity (mostly in Siberia
Siberia
Siberia is an extensive region constituting almost all of Northern Asia. Comprising the central and eastern portion of the Russian Federation, it was part of the Soviet Union from its beginning, as its predecessor states, the Tsardom of Russia and the Russian Empire, conquered it during the 16th...
). Sanitation and hygiene is also very poor in some areas that completely lack any plumbing whatsoever. Relatively few Russian people live in villages—rural population accounted for 27% of the total population according to the 2002 Russian Census
Russian Census (2002)
Russian Census of 2002 was the first census of the Russian Federation carried out on October 9 through October 16, 2002. It was carried out by the Russian Federal Service of State Statistics .-Resident population:...
. Some people rent village houses and use them as dachas (summer houses).
Demographic statistics
Population density
- 8.4 people per square kilometre (2010 Russian Census)
Life expectancy at birth
total population: 68.98 yearsmale: 63.04 years
female: 74.87 years (2010)
Median age
total: 38.8 yearsmale: 36.1 years
female: 41.1 years (2009)
Population (2010 est.): 139,390,205 (growth rate: –0.5%); birth rate: 11.1/1000; infant mortality rate: 10.3/1000; life expectancy: 66.1; density per sq mi: 21
Read more: Russia: History, Geography, Government, and Culture — Infoplease.com http://www.infoplease.com/ipa/A0107909.html#ixzz1en9EB9rN
Sex ratio
at birth: 1.05 male(s)/femaleunder 15 years: 1.05 male(s)/female
15–64 years: 0.92 male(s)/female
65 years and over: 0.46 male(s)/female
total population: 0.86 male(s)/female (2009)
See also
- Demographics of SiberiaDemographics of SiberiaGeographically, Siberia includes the Russian Urals, Siberian, and Far Eastern Federal Districts. The north-central parts of Kazakhstan are sometimes included in the region.Siberia has population density of only three persons per square kilometer...
- Demographics of the Soviet UnionDemographics of the Soviet UnionAccording to data from the 1989 Soviet census, the population of the Soviet Union was 70% East Slavs, 12% Turkic peoples, and all other ethnic groups below 10%. Alongside the atheist majority of 60% there were sizable minorities of Russian Orthodox followers and Muslims According to data from the...
- Demography of Central AsiaDemography of Central AsiaCentral Asia is a diverse land with many ethnic groups, languages, religions and tribes. This article discusses all of the above, and includes the demographics of the nations of the five former Soviet republics: Kazakhstan, Kyrgyzstan, Turkmenistan, Tajikistan, and Uzbekistan, a group which has a...
- Health in RussiaHealth in RussiaRussia has more physicians, hospitals, and health care workers than almost any other country in the world on a per capita basis. However, since the collapse of the Soviet Union, the health of the Russian population has declined considerably as a result of social, economic, and lifestyle...
- List of Russian people
- Soviet CensusSoviet CensusSoviet Census may refer to:*Russian Census , which was incomplete*Soviet Census , which only covered urban population*First All Union Census of the Soviet Union *Soviet Census *Soviet Census *Soviet Census...
- Russian Empire CensusRussian Empire CensusThe Russian Imperial Census of 1897 was the first and the only census carried out in the Russian Empire . It recorded demographic data as of ....
(1897) - Russian Census (2002)Russian Census (2002)Russian Census of 2002 was the first census of the Russian Federation carried out on October 9 through October 16, 2002. It was carried out by the Russian Federal Service of State Statistics .-Resident population:...
- Russian Census (2010)
Further reading
- Gavrilova N.S., Gavrilov L.A. Aging Populations: Russia/Eastern Europe. In: P. Uhlenberg (Editor), International Handbook of the Demography of Aging, New York: Springer-Verlag, 2009, pp.113-131.
- Gavrilova N.S., Semyonova V.G., Dubrovina E., Evdokushkina G.N., Ivanova A.E., Gavrilov L.A. Russian Mortality Crisis and the Quality of Vital Statistics. Population Research and Policy Review, 2008, 27: 551-574.
- Gavrilova, N.S., Gavrilov, L.A., Semyonova, V.G., Evdokushkina, G.N., Ivanova, A.E. 2005. Patterns of violent crime in Russia. In: Pridemore, W.A. (ed.). Ruling Russia: Law, Crime, and Justice in a Changing Society. Boulder, CO: Rowman & Littlefield Publ., Inc, 117-145
- Gavrilova, N.S., Semyonova, V.G., Evdokushkina G.N., Gavrilov, L.A. The response of violent mortality to economic crisis in Russia. Population Research and Policy Review, 2000, 19: 397-419.
External links
- Igor Beloborodov, Demographic situation in Russia in 1992–2010 (report at the Moscow Demographic Summit — June, 2011)
- Nicholas Eberstadt, Russia’s Peacetime Demographic Crisis: Dimensions, Causes, Implications (NBR Project Report, May 2010)
- Edited by Julie DaVanzo, Gwen Farnsworth Russia's Demographic "Crisis" 1996 RANDRANDRAND Corporation is a nonprofit global policy think tank first formed to offer research and analysis to the United States armed forces by Douglas Aircraft Company. It is currently financed by the U.S. government and private endowment, corporations including the healthcare industry, universities...
ISBN 0-8330-2446-9 - Jessica Griffith The Regional Consequences of Russia’s Demographic Crisis University of LeicesterUniversity of LeicesterThe University of Leicester is a research-led university based in Leicester, England. The main campus is a mile south of the city centre, adjacent to Victoria Park and Wyggeston and Queen Elizabeth I College....
- Results of population policy and current demographic situation (2008)
- Interactive statistics for all countries, site of US Census bureauUnited States Census BureauThe United States Census Bureau is the government agency that is responsible for the United States Census. It also gathers other national demographic and economic data...
. - 2009 World Population Data Sheet by the Population Reference BureauPopulation Reference BureauThe Population Reference Bureau is a private, nonprofit organization which informs people around the world about population, health and the environment for research or academic purposes...
- Population density and distribution maps (text is in Russian; the topmost map shows population density based on 1996 data)
- Ethnic groups of Russia
- Problems with mortality data in Russia
- V. Borisov “Demographic situation in Russia and the role of mortality in reproduction of population”, 2005 (in English)
- Russian EmpireRussian EmpireThe Russian Empire was a state that existed from 1721 until the Russian Revolution of 1917. It was the successor to the Tsardom of Russia and the predecessor of the Soviet Union...
: - Iranians Diaspora in Russia: В погоне за малыми, an article about treatment of minorities in the Russian EmpireRussian EmpireThe Russian Empire was a state that existed from 1721 until the Russian Revolution of 1917. It was the successor to the Tsardom of Russia and the predecessor of the Soviet Union...
, KommersantKommersantKommersant is a commerce-oriented newspaper published in Russia. , the circulation was 131,000.- History :The newspaper was initially published in 1909, and it was closed down following the Bolshevik seizure of power and the introduction of censorship in 1917.In 1989, with the onset of press...
-Money, 25 October 2005 - Choice between mass migration and birth rate increase as possible solutions of depopulation problem in Russia (in Russian)