

Map
Encyclopedia
A map is a visual representation of an area—a symbolic depiction highlighting relationships between elements of that space such as objects
, region
s, and themes.
Many maps are static
two-dimensional, geometrically accurate (or approximately accurate) representations
of three-dimensional space
, while others are dynamic or interactive, even three-dimensional. Although most commonly used to depict geography, maps may represent any space
, real or imagined, without regard to context
or scale
; e.g. brain mapping
, DNA
mapping, and extraterrestrial mapping.
or map-making is the study and practice of crafting representations of the Earth upon a flat surface (see History of cartography
), and one who makes maps is called a cartographer
.
Road maps are perhaps the most widely used maps today, and form a subset of navigational maps, which also include aeronautical and nautical chart
s, railroad network maps, and hiking and bicycling maps. In terms of quantity, the largest number of drawn map sheets is probably made up by local surveys, carried out by municipalities
, utilities, tax assessors, emergency services providers, and other local agencies. Many national surveying projects have been carried out by the military, such as the British
Ordnance Survey
(now a civilian government agency internationally renowned for its comprehensively detailed work).
In addition to location information maps may also be used to portray contour lines (isolines) indicating constant values of elevation, temperature
, rain
fall, etc.
 The orientation of a map is the relationship between the directions on the map and the corresponding compass directions in reality. The word "orient
" is derived from Latin
oriens, meaning East. In the Middle Ages
many maps, including the T and O map
s, were drawn with East at the top (meaning that the direction "up" on the map corresponds to East on the compass). Today, the most common – but far from universal – cartographic convention is that North is at the top of a map. Several kinds of maps are often traditionally not oriented with North at the top:
, expressed as a ratio
such as 1:10,000, meaning that 1 of any unit of measurement
on the map corresponds exactly, or approximately, to 10,000 of that same unit on the ground. The scale statement may be taken as exact when the region mapped is small enough for the curvature of the Earth to be neglected, for example in a town planner's city map
. Over larger regions where the curvature cannot be ignored we must use map projection
s from the curved surface of the Earth (sphere or ellipsoid) to the plane. The impossibility of flattening the sphere to the plane implies that no map projection can have constant scale: on most projections the best we can achieve is accurate scale on one or two lines (not necessarily straight) on the projection. Thus for map projections we must introduce the concept of point scale
, which is a function of position, and strive to keep its variation within narrow bounds. Although the scale statement is nominal it is usually accurate enough for all but the most precise of measurements.
Large scale maps, say 1:10,000, cover relatively small regions in great detail and small scale maps, say 1:10,000,000, cover large regions such as nations, continents and the whole globe. The large/small terminology arose from the practice of writing scales as numerical fractions: 1/10,000 is larger than 1/10,000,000. There is no exact dividing line between large and small but 1/100,000 might well be considered as a medium scale. Examples of large scale maps are the 1:25,000 maps produced for hikers; on the other hand maps intended for motorists at 1:250,000 or 1:1,000,000 are small scale.
It is important to recognise that even the most accurate maps sacrifice a certain amount of accuracy in scale to deliver a greater visual usefulness to its user. For example, the width of roads and small streams are exaggerated when they are too narrow to be shown on the map at true scale; that is, on a printed map they would be narrower than could be perceived by the naked eye. The same applies to computer maps where the smallest unit is the pixel. A narrow stream say must be shown to have the width of a pixel even if at the map scale it would be a small fraction of the pixel width.
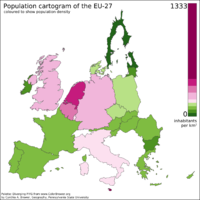 Some maps, called cartogram
s, have the scale deliberately distorted to reflect information other than land area or distance. For example, this map of Europe
has been distorted to show population distribution, while the rough shape of the continent is still discernable.
Another example of distorted scale is the famous London Underground map
. The basic geographical structure is respected but the tube lines (and the River Thames) are smoothed to clarify the relationships between stations. Near the center of the map stations are spaced out more than near the edges of map.
Further inaccuracies may be deliberate. For example, cartographers may simply omit military installations or remove features solely in order to enhance the clarity of the map. For example, a road map may not show railroads, smaller waterways or other prominent non-road objects, and even if it does, it may show them less clearly (e.g. dashed or dotted lines/outlines) than the main roads. Known as decluttering, the practice makes the subject matter that the user is interested in easier to read, usually without sacrificing overall accuracy. Software-based maps often allow the user to toggle decluttering between ON, OFF and AUTO as needed. In AUTO the degree of decluttering is adjusted as the user changes the scale being displayed.
 Maps of the world or large areas are often either 'political' or 'physical'. The most important purpose of the political map is to show territorial borders; the purpose of the physical is to show features of geography
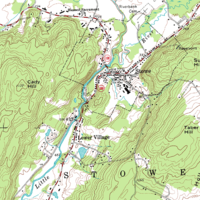
such as mountains, soil type or land use including infrastruction such as roads, railroads and buildings. Topographic map
s show elevation
s and relief
with contour line
s or shading. Geological maps show not only the physical surface, but characteristics of the underlying rock, fault lines, and subsurface structures.
Maps that depict the surface of the Earth also use a projection
, a way of translating the three-dimensional real surface of the geoid
to a two-dimensional picture. Perhaps the best-known world-map projection is the Mercator projection
, originally designed as a form of nautical chart
.
Aeroplane pilots use aeronautical charts based on a Lambert conformal conic projection
, in which a cone is laid over the section of the earth to be mapped. The cone intersects the sphere (the earth) at one or two parallels which are chosen as standard lines. This allows the pilots to plot a great-circle route approximation on a flat, two-dimensional chart.
 From the last quarter of the 20th century, the indispensable tool of the cartographer has been the computer. Much of cartography, especially at the data-gathering survey level, has been subsumed by Geographic Information Systems
(GIS). The functionality of maps has been greatly advanced by technology simplifying the superimposition of spatially located variables onto existing geographical maps. Having local information such as rainfall level, distribution of wildlife, or demographic data integrated within the map allows more efficient analysis and better decision making. In the pre-electronic age such superimposition of data led Dr. John Snow
to discover the cause of cholera
. Today, it is used by agencies of the human kind, as diverse as wildlife conservationists and militaries around the world.
Even when GIS is not involved, most cartographers now use a variety of computer graphics programs to generate new maps.
Interactive, computerised maps are commercially available, allowing users to zoom in or zoom out (respectively meaning to increase or decrease the scale), sometimes by replacing one map with another of different scale, centered where possible on the same point. In-car global navigation satellite system
s are computerised maps with route-planning and advice facilities which monitor the user's position with the help of satellites. From the computer scientist's point of view, zooming in entails one or a combination of:
For example:
See also: Webpage (Graphics), PDF (Layers), MapQuest
, Google Maps
, Google Earth
, OpenStreetMap
or Yahoo! Maps
.
s or symbols. For example, colors can be used to indicate a classification of roads. Those signs are usually explained in the margin of the map, or on a separately published characteristic sheet.
Some cartographers prefer to make the map cover practically the entire screen or sheet of paper, leaving no room "outside" the map for information about the map as a whole.
These cartographers typically place such information in an otherwise "blank" region "inside" the map -- cartouche
, map legend, title, compass rose
, bar scale, etc.
In particular, some maps contain smaller "sub-maps" in otherwise blank regions—often one at a much smaller scale showing the whole globe and where the whole map fits on that globe, and a few showing "regions of interest" at a larger scale in order to show details that wouldn't otherwise fit.
Occasionally sub-maps use the same scale as the large map—a few maps of the contiguous United States
include a sub-map to the same scale for each of the two non-contiguous states.
. Over centuries cartographers have developed the art of placing names on even the densest of maps. Text placement or name placement can get mathematically very complex as the number of labels and map density increases. Therefore, text placement is time-consuming and labor-intensive, so cartographers and GIS users have developed automatic label placement
to ease this process.
, and other cosmological features such as star maps. In addition maps of other bodies such as the Moon and other planets are technically not geo
logical maps.
s and treemaps display logical relationships between items, and do not display spatial relationships at all.
Some maps, for example the London Underground map, are topological map
s. Topological in nature, the distances are completely unimportant; only the connectivity is significant.
Map design and types
Modern maps
Map history
Related topics
Object
Object may refer to:* Object , a thing, being or concept** Entity, something that is tangible and within the grasp of the senses* As used in object relations theories of psychoanalysis, that to which a subject relates....
, region
Region
Region is most commonly found as a term used in terrestrial and astrophysics sciences also an area, notably among the different sub-disciplines of geography, studied by regional geographers. Regions consist of subregions that contain clusters of like areas that are distinctive by their uniformity...
s, and themes.
Many maps are static
Statics
Statics is the branch of mechanics concerned with the analysis of loads on physical systems in static equilibrium, that is, in a state where the relative positions of subsystems do not vary over time, or where components and structures are at a constant velocity...
two-dimensional, geometrically accurate (or approximately accurate) representations
2D geometric model
A 2D geometric model is a geometric model of an object as two-dimensional figure, usually on the Euclidean or Cartesian plane.Even though all material objects are three-dimensional, a 2D geometric model is often adequate for certain flat objects, such as paper cut-outs and machine parts made of...
of three-dimensional space
Three-dimensional space
Three-dimensional space is a geometric 3-parameters model of the physical universe in which we live. These three dimensions are commonly called length, width, and depth , although any three directions can be chosen, provided that they do not lie in the same plane.In physics and mathematics, a...
, while others are dynamic or interactive, even three-dimensional. Although most commonly used to depict geography, maps may represent any space
Space
Space is the boundless, three-dimensional extent in which objects and events occur and have relative position and direction. Physical space is often conceived in three linear dimensions, although modern physicists usually consider it, with time, to be part of a boundless four-dimensional continuum...
, real or imagined, without regard to context
Context (language use)
Context is a notion used in the language sciences in two different ways, namely as* verbal context* social context- Verbal context :...
or scale
Scale (map)
The scale of a map is defined as the ratio of a distance on the map to the corresponding distance on the ground.If the region of the map is small enough for the curvature of the Earth to be neglected, then the scale may be taken as a constant ratio over the whole map....
; e.g. brain mapping
Brain mapping
Brain mapping is a set of neuroscience techniques predicated on the mapping of quantities or properties onto spatial representations of the brain resulting in maps.- Overview :...
, DNA
DNA
Deoxyribonucleic acid is a nucleic acid that contains the genetic instructions used in the development and functioning of all known living organisms . The DNA segments that carry this genetic information are called genes, but other DNA sequences have structural purposes, or are involved in...
mapping, and extraterrestrial mapping.
Geographic maps
CartographyCartography
Cartography is the study and practice of making maps. Combining science, aesthetics, and technique, cartography builds on the premise that reality can be modeled in ways that communicate spatial information effectively.The fundamental problems of traditional cartography are to:*Set the map's...
or map-making is the study and practice of crafting representations of the Earth upon a flat surface (see History of cartography
History of cartography
Cartography , or mapmaking, has been an integral part of the human story for a long time, possibly up to 8,000 years...
), and one who makes maps is called a cartographer
Cartography
Cartography is the study and practice of making maps. Combining science, aesthetics, and technique, cartography builds on the premise that reality can be modeled in ways that communicate spatial information effectively.The fundamental problems of traditional cartography are to:*Set the map's...
.
Road maps are perhaps the most widely used maps today, and form a subset of navigational maps, which also include aeronautical and nautical chart
Nautical chart
A nautical chart is a graphic representation of a maritime area and adjacent coastal regions. Depending on the scale of the chart, it may show depths of water and heights of land , natural features of the seabed, details of the coastline, navigational hazards, locations of natural and man-made aids...
s, railroad network maps, and hiking and bicycling maps. In terms of quantity, the largest number of drawn map sheets is probably made up by local surveys, carried out by municipalities
Municipality
A municipality is essentially an urban administrative division having corporate status and usually powers of self-government. It can also be used to mean the governing body of a municipality. A municipality is a general-purpose administrative subdivision, as opposed to a special-purpose district...
, utilities, tax assessors, emergency services providers, and other local agencies. Many national surveying projects have been carried out by the military, such as the British
United Kingdom
The United Kingdom of Great Britain and Northern IrelandIn the United Kingdom and Dependencies, other languages have been officially recognised as legitimate autochthonous languages under the European Charter for Regional or Minority Languages...
Ordnance Survey
Ordnance Survey
Ordnance Survey , an executive agency and non-ministerial government department of the Government of the United Kingdom, is the national mapping agency for Great Britain, producing maps of Great Britain , and one of the world's largest producers of maps.The name reflects its creation together with...
(now a civilian government agency internationally renowned for its comprehensively detailed work).
In addition to location information maps may also be used to portray contour lines (isolines) indicating constant values of elevation, temperature
Temperature
Temperature is a physical property of matter that quantitatively expresses the common notions of hot and cold. Objects of low temperature are cold, while various degrees of higher temperatures are referred to as warm or hot...
, rain
Rain
Rain is liquid precipitation, as opposed to non-liquid kinds of precipitation such as snow, hail and sleet. Rain requires the presence of a thick layer of the atmosphere to have temperatures above the melting point of water near and above the Earth's surface...
fall, etc.
Orientation of maps
Orient
The Orient means "the East." It is a traditional designation for anything that belongs to the Eastern world or the Far East, in relation to Europe. In English it is a metonym that means various parts of Asia.- Derivation :...
" is derived from Latin
Latin
Latin is an Italic language originally spoken in Latium and Ancient Rome. It, along with most European languages, is a descendant of the ancient Proto-Indo-European language. Although it is considered a dead language, a number of scholars and members of the Christian clergy speak it fluently, and...
oriens, meaning East. In the Middle Ages
Middle Ages
The Middle Ages is a periodization of European history from the 5th century to the 15th century. The Middle Ages follows the fall of the Western Roman Empire in 476 and precedes the Early Modern Era. It is the middle period of a three-period division of Western history: Classic, Medieval and Modern...
many maps, including the T and O map
T and O map
A T and O map or O-T or T-O map , is a type of medieval world map, sometimes also called a Beatine map or a Beatus map because one of the earliest known representations of this sort is attributed to Beatus of Liébana, an 8th-century Spanish monk...
s, were drawn with East at the top (meaning that the direction "up" on the map corresponds to East on the compass). Today, the most common – but far from universal – cartographic convention is that North is at the top of a map. Several kinds of maps are often traditionally not oriented with North at the top:
- Maps from non-Western traditions are oriented a variety of ways. Old maps of EdoEdo, also romanized as Yedo or Yeddo, is the former name of the Japanese capital Tokyo, and was the seat of power for the Tokugawa shogunate which ruled Japan from 1603 to 1868...
show the Japanese imperial palace as the "top", but also at the centre, of the map. Labels on the map are oriented in such a way that you cannot read them properly unless you put the imperial palace above your head. - MedievalMiddle AgesThe Middle Ages is a periodization of European history from the 5th century to the 15th century. The Middle Ages follows the fall of the Western Roman Empire in 476 and precedes the Early Modern Era. It is the middle period of a three-period division of Western history: Classic, Medieval and Modern...
European T and O mapT and O mapA T and O map or O-T or T-O map , is a type of medieval world map, sometimes also called a Beatine map or a Beatus map because one of the earliest known representations of this sort is attributed to Beatus of Liébana, an 8th-century Spanish monk...
s such as the Hereford Mappa MundiHereford Mappa MundiThe Hereford Mappa Mundi is a mappa mundi, of a form deriving from the T and O pattern, dating to ca. 1300. It is currently on display in Hereford Cathedral in Hereford, England...
were centred on Jerusalem with East at the top. Indeed, prior to the reintroduction of PtolemyPtolemyClaudius Ptolemy , was a Roman citizen of Egypt who wrote in Greek. He was a mathematician, astronomer, geographer, astrologer, and poet of a single epigram in the Greek Anthology. He lived in Egypt under Roman rule, and is believed to have been born in the town of Ptolemais Hermiou in the...
's Geography to Europe around 1400, there was no single convention in the West. Portolan chartPortolan chartPortolan charts are navigational maps based on realistic descriptions of harbours and coasts. They were first made in the 14th century in Italy, Portugal and Spain...
s, for example, are oriented to the shores they describe. - Maps of cities bordering a sea are often conventionally oriented with the sea at the top.
- Route and channel maps have traditionally been oriented to the road or waterway they describe.
- Polar mapAzimuthal equidistant projectionThe azimuthal equidistant projection is a type of map projection.A useful application for this type of projection is a polar projection in which all distances measured from the center of the map along any longitudinal line are accurate; an example of a polar azimuthal equidistant projection can be...
s of the ArcticArcticThe Arctic is a region located at the northern-most part of the Earth. The Arctic consists of the Arctic Ocean and parts of Canada, Russia, Greenland, the United States, Norway, Sweden, Finland, and Iceland. The Arctic region consists of a vast, ice-covered ocean, surrounded by treeless permafrost...
or Antarctic regions are conventionally centred on the pole; the direction North would be towards or away from the centre of the map, respectively. Typical maps of the Arctic have 0° meridian towards the bottom of the page; maps of the Antarctic have the 0° meridian towards the top of the page. - Reversed mapReversed mapthumb|right|The [[The Blue Marble|Blue Marble]] photograph in its original orientationA reversed map, also known as an Upside-Down map or South-Up map, is a map where south is up, north is down, east is left and west is right. Thus the Southern Hemisphere at the top of the map instead of the bottom...
s, also known as Upside-Down maps or South-Up maps, reverse the "North is up" convention and have South at the top. - Buckminster FullerBuckminster FullerRichard Buckminster “Bucky” Fuller was an American systems theorist, author, designer, inventor, futurist and second president of Mensa International, the high IQ society....
's Dymaxion mapDymaxion mapThe Dymaxion map or Fuller map is a projection of a world map onto the surface of a polyhedron, which can be unfolded and flattened to two dimensions. The projection depicts the earth's continents as "one island," or nearly contiguous land masses. The arrangement heavily interrupts the map in order...
s are based on a projection of the Earth's sphereSphereA sphere is a perfectly round geometrical object in three-dimensional space, such as the shape of a round ball. Like a circle in two dimensions, a perfect sphere is completely symmetrical around its center, with all points on the surface lying the same distance r from the center point...
onto an icosahedronIcosahedronIn geometry, an icosahedron is a regular polyhedron with 20 identical equilateral triangular faces, 30 edges and 12 vertices. It is one of the five Platonic solids....
. The resulting triangular pieces may be arranged in any order or orientation. - Modern digital GIS maps such as ArcMapArcMapArcMap is the main component of Esri's ArcGIS suite of geospatial processing programs, and is used primarily to view, edit, create, and analyze geospatial data. ArcMap allows the user to explore data within a data set, symbolize features accordingly, and create maps.- Functionality :ArcMap users...
typically project north at the top of the map, but use math degrees (0 is east, degrees increase counter-clockwise), rather than compass degrees (0 is north, degrees increase clockwise) for orientation of transects. Compass decimal degrees can be converted to math degrees by subtracting them from 450.
Scale and accuracy
Many, but not all, maps are drawn to a scaleScale (map)
The scale of a map is defined as the ratio of a distance on the map to the corresponding distance on the ground.If the region of the map is small enough for the curvature of the Earth to be neglected, then the scale may be taken as a constant ratio over the whole map....
, expressed as a ratio
Ratio
In mathematics, a ratio is a relationship between two numbers of the same kind , usually expressed as "a to b" or a:b, sometimes expressed arithmetically as a dimensionless quotient of the two which explicitly indicates how many times the first number contains the second In mathematics, a ratio is...
such as 1:10,000, meaning that 1 of any unit of measurement
Measurement
Measurement is the process or the result of determining the ratio of a physical quantity, such as a length, time, temperature etc., to a unit of measurement, such as the metre, second or degree Celsius...
on the map corresponds exactly, or approximately, to 10,000 of that same unit on the ground. The scale statement may be taken as exact when the region mapped is small enough for the curvature of the Earth to be neglected, for example in a town planner's city map
City map
A city map is a large-scale thematic map of a city created to enable the fastest possible orientation in an urban space. The graphic representation of objects on a city map is therefore usually greatly simplified, and reduced to generally understood symbology.Depending upon its target group or...
. Over larger regions where the curvature cannot be ignored we must use map projection
Map projection
A map projection is any method of representing the surface of a sphere or other three-dimensional body on a plane. Map projections are necessary for creating maps. All map projections distort the surface in some fashion...
s from the curved surface of the Earth (sphere or ellipsoid) to the plane. The impossibility of flattening the sphere to the plane implies that no map projection can have constant scale: on most projections the best we can achieve is accurate scale on one or two lines (not necessarily straight) on the projection. Thus for map projections we must introduce the concept of point scale
Scale (map)
The scale of a map is defined as the ratio of a distance on the map to the corresponding distance on the ground.If the region of the map is small enough for the curvature of the Earth to be neglected, then the scale may be taken as a constant ratio over the whole map....
, which is a function of position, and strive to keep its variation within narrow bounds. Although the scale statement is nominal it is usually accurate enough for all but the most precise of measurements.
Large scale maps, say 1:10,000, cover relatively small regions in great detail and small scale maps, say 1:10,000,000, cover large regions such as nations, continents and the whole globe. The large/small terminology arose from the practice of writing scales as numerical fractions: 1/10,000 is larger than 1/10,000,000. There is no exact dividing line between large and small but 1/100,000 might well be considered as a medium scale. Examples of large scale maps are the 1:25,000 maps produced for hikers; on the other hand maps intended for motorists at 1:250,000 or 1:1,000,000 are small scale.
It is important to recognise that even the most accurate maps sacrifice a certain amount of accuracy in scale to deliver a greater visual usefulness to its user. For example, the width of roads and small streams are exaggerated when they are too narrow to be shown on the map at true scale; that is, on a printed map they would be narrower than could be perceived by the naked eye. The same applies to computer maps where the smallest unit is the pixel. A narrow stream say must be shown to have the width of a pixel even if at the map scale it would be a small fraction of the pixel width.
Cartogram
A cartogram is a map in which some thematic mapping variable – such as travel time or Gross National Product – is substituted for land area or distance. The geometry or space of the map is distorted in order to convey the information of this alternate variable...
s, have the scale deliberately distorted to reflect information other than land area or distance. For example, this map of Europe
Europe
Europe is, by convention, one of the world's seven continents. Comprising the westernmost peninsula of Eurasia, Europe is generally 'divided' from Asia to its east by the watershed divides of the Ural and Caucasus Mountains, the Ural River, the Caspian and Black Seas, and the waterways connecting...
has been distorted to show population distribution, while the rough shape of the continent is still discernable.
Another example of distorted scale is the famous London Underground map
Tube map
The Tube map is a schematic transit map representing the lines and stations of London's rapid transit railway systems, namely the London Underground , the Docklands Light Railway and London Overground....
. The basic geographical structure is respected but the tube lines (and the River Thames) are smoothed to clarify the relationships between stations. Near the center of the map stations are spaced out more than near the edges of map.
Further inaccuracies may be deliberate. For example, cartographers may simply omit military installations or remove features solely in order to enhance the clarity of the map. For example, a road map may not show railroads, smaller waterways or other prominent non-road objects, and even if it does, it may show them less clearly (e.g. dashed or dotted lines/outlines) than the main roads. Known as decluttering, the practice makes the subject matter that the user is interested in easier to read, usually without sacrificing overall accuracy. Software-based maps often allow the user to toggle decluttering between ON, OFF and AUTO as needed. In AUTO the degree of decluttering is adjusted as the user changes the scale being displayed.
Map types and projections
Geography
Geography is the science that studies the lands, features, inhabitants, and phenomena of Earth. A literal translation would be "to describe or write about the Earth". The first person to use the word "geography" was Eratosthenes...
such as mountains, soil type or land use including infrastruction such as roads, railroads and buildings. Topographic map
Topographic map
A topographic map is a type of map characterized by large-scale detail and quantitative representation of relief, usually using contour lines in modern mapping, but historically using a variety of methods. Traditional definitions require a topographic map to show both natural and man-made features...
s show elevation
Elevation
The elevation of a geographic location is its height above a fixed reference point, most commonly a reference geoid, a mathematical model of the Earth's sea level as an equipotential gravitational surface ....
s and relief
Terrain
Terrain, or land relief, is the vertical and horizontal dimension of land surface. When relief is described underwater, the term bathymetry is used...
with contour line
Contour line
A contour line of a function of two variables is a curve along which the function has a constant value. In cartography, a contour line joins points of equal elevation above a given level, such as mean sea level...
s or shading. Geological maps show not only the physical surface, but characteristics of the underlying rock, fault lines, and subsurface structures.
Maps that depict the surface of the Earth also use a projection
Map projection
A map projection is any method of representing the surface of a sphere or other three-dimensional body on a plane. Map projections are necessary for creating maps. All map projections distort the surface in some fashion...
, a way of translating the three-dimensional real surface of the geoid
Geoid
The geoid is that equipotential surface which would coincide exactly with the mean ocean surface of the Earth, if the oceans were in equilibrium, at rest , and extended through the continents . According to C.F...
to a two-dimensional picture. Perhaps the best-known world-map projection is the Mercator projection
Mercator projection
The Mercator projection is a cylindrical map projection presented by the Belgian geographer and cartographer Gerardus Mercator, in 1569. It became the standard map projection for nautical purposes because of its ability to represent lines of constant course, known as rhumb lines or loxodromes, as...
, originally designed as a form of nautical chart
Nautical chart
A nautical chart is a graphic representation of a maritime area and adjacent coastal regions. Depending on the scale of the chart, it may show depths of water and heights of land , natural features of the seabed, details of the coastline, navigational hazards, locations of natural and man-made aids...
.
Aeroplane pilots use aeronautical charts based on a Lambert conformal conic projection
Lambert conformal conic projection
A Lambert conformal conic projection is a conic map projection, which is often used for aeronautical charts. In essence, the projection superimposes a cone over the sphere of the Earth, with two reference parallels secant to the globe and intersecting it. This minimizes distortion from projecting...
, in which a cone is laid over the section of the earth to be mapped. The cone intersects the sphere (the earth) at one or two parallels which are chosen as standard lines. This allows the pilots to plot a great-circle route approximation on a flat, two-dimensional chart.
- Azimuthal or GnomonicGnomonic projectionA gnomonic map projection displays all great circles as straight lines. Thus the shortest route between two locations in reality corresponds to that on the map. This is achieved by projecting, with respect to the center of the Earth , the Earth's surface onto a tangent plane. The least distortion...
map projectionMap projectionA map projection is any method of representing the surface of a sphere or other three-dimensional body on a plane. Map projections are necessary for creating maps. All map projections distort the surface in some fashion...
s are often used in planning air routes due to their ability to represent great circleGreat circleA great circle, also known as a Riemannian circle, of a sphere is the intersection of the sphere and a plane which passes through the center point of the sphere, as opposed to a general circle of a sphere where the plane is not required to pass through the center...
s as straight lines. - Richard Edes Harrison produced a striking series of maps during and after World War IIWorld War IIWorld War II, or the Second World War , was a global conflict lasting from 1939 to 1945, involving most of the world's nations—including all of the great powers—eventually forming two opposing military alliances: the Allies and the Axis...
for Fortune magazineFortune (magazine)Fortune is a global business magazine published by Time Inc. Founded by Henry Luce in 1930, the publishing business, consisting of Time, Life, Fortune, and Sports Illustrated, grew to become Time Warner. In turn, AOL grew as it acquired Time Warner in 2000 when Time Warner was the world's largest...
. These used "bird's eye" projections to emphasise globally strategic "fronts" in the air age, pointing out proximities and barriers not apparent on a conventional rectangular projection of the world.
Electronic maps
Geographic Information System
A geographic information system, geographical information science, or geospatial information studies is a system designed to capture, store, manipulate, analyze, manage, and present all types of geographically referenced data...
(GIS). The functionality of maps has been greatly advanced by technology simplifying the superimposition of spatially located variables onto existing geographical maps. Having local information such as rainfall level, distribution of wildlife, or demographic data integrated within the map allows more efficient analysis and better decision making. In the pre-electronic age such superimposition of data led Dr. John Snow
John Snow (physician)
John Snow was an English physician and a leader in the adoption of anaesthesia and medical hygiene. He is considered to be one of the fathers of epidemiology, because of his work in tracing the source of a cholera outbreak in Soho, England, in 1854.-Early life and education:Snow was born 15 March...
to discover the cause of cholera
Cholera
Cholera is an infection of the small intestine that is caused by the bacterium Vibrio cholerae. The main symptoms are profuse watery diarrhea and vomiting. Transmission occurs primarily by drinking or eating water or food that has been contaminated by the diarrhea of an infected person or the feces...
. Today, it is used by agencies of the human kind, as diverse as wildlife conservationists and militaries around the world.
Even when GIS is not involved, most cartographers now use a variety of computer graphics programs to generate new maps.
Interactive, computerised maps are commercially available, allowing users to zoom in or zoom out (respectively meaning to increase or decrease the scale), sometimes by replacing one map with another of different scale, centered where possible on the same point. In-car global navigation satellite system
Global Navigation Satellite System
A satellite navigation or SAT NAV system is a system of satellites that provide autonomous geo-spatial positioning with global coverage. It allows small electronic receivers to determine their location to within a few metres using time signals transmitted along a line-of-sight by radio from...
s are computerised maps with route-planning and advice facilities which monitor the user's position with the help of satellites. From the computer scientist's point of view, zooming in entails one or a combination of:
- replacing the map by a more detailed one
- enlarging the same map without enlarging the pixelPixelIn digital imaging, a pixel, or pel, is a single point in a raster image, or the smallest addressable screen element in a display device; it is the smallest unit of picture that can be represented or controlled....
s, hence showing more detail by removing less information compared to the less detailed version - enlarging the same map with the pixels enlarged (replaced by rectangles of pixels); no additional detail is shown, but, depending on the quality of one's vision, possibly more detail can be seen; if a computer display does not show adjacent pixels really separate, but overlapping instead (this does not apply for an LCDLiquid crystal displayA liquid crystal display is a flat panel display, electronic visual display, or video display that uses the light modulating properties of liquid crystals . LCs do not emit light directly....
, but may apply for a cathode ray tubeCathode ray tubeThe cathode ray tube is a vacuum tube containing an electron gun and a fluorescent screen used to view images. It has a means to accelerate and deflect the electron beam onto the fluorescent screen to create the images. The image may represent electrical waveforms , pictures , radar targets and...
), then replacing a pixel by a rectangle of pixels does show more detail. A variation of this method is interpolationInterpolationIn the mathematical field of numerical analysis, interpolation is a method of constructing new data points within the range of a discrete set of known data points....
.
For example:
- Typically (2) applies to a Portable Document FormatPortable Document FormatPortable Document Format is an open standard for document exchange. This file format, created by Adobe Systems in 1993, is used for representing documents in a manner independent of application software, hardware, and operating systems....
(PDF) file or other format based on vector graphics. The increase in detail is, of course, limited to the information contained in the file: enlargement of a curve may eventually result in a series of standard geometric figures such as straight lines, arcs of circles or splines. - (2) may apply to text and (3) to the outline of a map feature such as a forest or building.
- (1) may apply to the text as needed (displaying labels for more features), while (2) applies to the rest of the image. Text is not necessarily enlarged when zooming in. Similarly, a road represented by a double line may or may not become wider when one zooms in.
- The map may also have layers which are partly raster graphicsRaster graphicsIn computer graphics, a raster graphics image, or bitmap, is a data structure representing a generally rectangular grid of pixels, or points of color, viewable via a monitor, paper, or other display medium...
and partly vector graphicsVector graphicsVector graphics is the use of geometrical primitives such as points, lines, curves, and shapes or polygon, which are all based on mathematical expressions, to represent images in computer graphics...
. For a single raster graphics image (2) applies until the pixels in the image file correspond to the pixels of the display, thereafter (3) applies.
See also: Webpage (Graphics), PDF (Layers), MapQuest
MapQuest
MapQuest is an American free online web mapping service owned by AOL. The company was founded in 1967 as Cartographic Services, a division of R.R. Donnelley & Sons in Chicago, Illinois, United States. It moved to Lancaster, Pennsylvania in 1969. When it became an independent company in 1994, it was...
, Google Maps
Google Maps
Google Maps is a web mapping service application and technology provided by Google, free , that powers many map-based services, including the Google Maps website, Google Ride Finder, Google Transit, and maps embedded on third-party websites via the Google Maps API...
, Google Earth
Google Earth
Google Earth is a virtual globe, map and geographical information program that was originally called EarthViewer 3D, and was created by Keyhole, Inc, a Central Intelligence Agency funded company acquired by Google in 2004 . It maps the Earth by the superimposition of images obtained from satellite...
, OpenStreetMap
OpenStreetMap
OpenStreetMap is a collaborative project to create a free editable map of the world. Two major driving forces behind the establishment and growth of OSM have been restrictions on use or availability of map information across much of the world and the advent of inexpensive portable GPS devices.The...
or Yahoo! Maps
Yahoo! Maps
Yahoo! Maps is a free online mapping portal provided by Yahoo!.-News:*On May 16, 2007, Yahoo! released a new map style designed by the cartography company...
.
Conventional signs
The various features shown on a map are represented by conventional signSign
A sign is something that implies a connection between itself and its object. A natural sign bears a causal relation to its object—for instance, thunder is a sign of storm. A conventional sign signifies by agreement, as a full stop signifies the end of a sentence...
s or symbols. For example, colors can be used to indicate a classification of roads. Those signs are usually explained in the margin of the map, or on a separately published characteristic sheet.
Some cartographers prefer to make the map cover practically the entire screen or sheet of paper, leaving no room "outside" the map for information about the map as a whole.
These cartographers typically place such information in an otherwise "blank" region "inside" the map -- cartouche
Cartouche (cartography)
A cartouche in cartography is a decorative emblem on a globe or map.Map cartouches may contain the title, the printer's address, date of publication, the scale of the map and legends, and sometimes a dedication....
, map legend, title, compass rose
Compass rose
A compass rose, sometimes called a windrose, is a figure on a compass, map, nautical chart or monument used to display the orientation of the cardinal directions — North, East, South and West - and their intermediate points. It is also the term for the graduated markings found on the traditional...
, bar scale, etc.
In particular, some maps contain smaller "sub-maps" in otherwise blank regions—often one at a much smaller scale showing the whole globe and where the whole map fits on that globe, and a few showing "regions of interest" at a larger scale in order to show details that wouldn't otherwise fit.
Occasionally sub-maps use the same scale as the large map—a few maps of the contiguous United States
Contiguous United States
The contiguous United States are the 48 U.S. states on the continent of North America that are south of Canada and north of Mexico, plus the District of Columbia....
include a sub-map to the same scale for each of the two non-contiguous states.
Labeling
To communicate spatial information effectively, features such as rivers, lakes, and cities need to be labeledLabeling (map design)
Cartographic labeling is a form of typography and strongly deals with form, style, weight and size of type on a map. Essentially, labeling denotes the correct way to label features .- Form :...
. Over centuries cartographers have developed the art of placing names on even the densest of maps. Text placement or name placement can get mathematically very complex as the number of labels and map density increases. Therefore, text placement is time-consuming and labor-intensive, so cartographers and GIS users have developed automatic label placement
Automatic label placement
Automatic label placement refers to the computer methods of placing labels automatically on a map or chart. This is related to the typographic design of such labels....
to ease this process.
Non geographical spatial maps
Maps exist of the solar systemSolar System
The Solar System consists of the Sun and the astronomical objects gravitationally bound in orbit around it, all of which formed from the collapse of a giant molecular cloud approximately 4.6 billion years ago. The vast majority of the system's mass is in the Sun...
, and other cosmological features such as star maps. In addition maps of other bodies such as the Moon and other planets are technically not geo
Geospatial
Geospatial analysis is an approach to applying statistical analysis and other informational techniques to geographically based data. Such analysis employs spatial software and analytical methods with terrestrial or geographic datasets, including geographic information systems and...
logical maps.
Non spatial maps
Diagrams such as schematic diagrams and Gantt chartGantt chart
A Gantt chart is a type of bar chart that illustrates a project schedule. Gantt charts illustrate the start and finish dates of the terminal elements and summary elements of a project. Terminal elements and summary elements comprise the work breakdown structure of the project. Some Gantt charts...
s and treemaps display logical relationships between items, and do not display spatial relationships at all.
Some maps, for example the London Underground map, are topological map
Topological map
In cartography and geology, a topological map is one that has been simplified so that only vital information remains and unnecessary detail has been removed. These maps lack scale, and distance and direction are subject to change and variation, but the relationship between points is maintained...
s. Topological in nature, the distances are completely unimportant; only the connectivity is significant.
See also
General- AtlasAtlasAn atlas is a collection of maps; it is typically a map of Earth or a region of Earth, but there are atlases of the other planets in the Solar System. Atlases have traditionally been bound into book form, but today many atlases are in multimedia formats...
- Automatic label placementAutomatic label placementAutomatic label placement refers to the computer methods of placing labels automatically on a map or chart. This is related to the typographic design of such labels....
- CartographyCartographyCartography is the study and practice of making maps. Combining science, aesthetics, and technique, cartography builds on the premise that reality can be modeled in ways that communicate spatial information effectively.The fundamental problems of traditional cartography are to:*Set the map's...
- GeographyGeographyGeography is the science that studies the lands, features, inhabitants, and phenomena of Earth. A literal translation would be "to describe or write about the Earth". The first person to use the word "geography" was Eratosthenes...
- GlobeGlobeA globe is a three-dimensional scale model of Earth or other spheroid celestial body such as a planet, star, or moon...
- Map–territory relationMap–territory relationThe map–territory relation describes the relationship between an object and a representation of that object, as in the relation between a geographical territory and a map of it...
Map design and types
- Aeronautical chartAeronautical chartAn aeronautical chart is a map designed to assist in navigation of aircraft, much as nautical charts do for watercraft, or a roadmap for drivers...
- CartogramCartogramA cartogram is a map in which some thematic mapping variable – such as travel time or Gross National Product – is substituted for land area or distance. The geometry or space of the map is distorted in order to convey the information of this alternate variable...
- City mapCity mapA city map is a large-scale thematic map of a city created to enable the fastest possible orientation in an urban space. The graphic representation of objects on a city map is therefore usually greatly simplified, and reduced to generally understood symbology.Depending upon its target group or...
- Compass roseCompass roseA compass rose, sometimes called a windrose, is a figure on a compass, map, nautical chart or monument used to display the orientation of the cardinal directions — North, East, South and West - and their intermediate points. It is also the term for the graduated markings found on the traditional...
- Contour mapContour lineA contour line of a function of two variables is a curve along which the function has a constant value. In cartography, a contour line joins points of equal elevation above a given level, such as mean sea level...
- Dymaxion mapDymaxion mapThe Dymaxion map or Fuller map is a projection of a world map onto the surface of a polyhedron, which can be unfolded and flattened to two dimensions. The projection depicts the earth's continents as "one island," or nearly contiguous land masses. The arrangement heavily interrupts the map in order...
- Estate mapEstate mapEstate maps were maps commissioned by individual landowners or institutions showing their property, typically including fields and buildings.-Development:...
- Fantasy mapFantasy mapA fantasy map is type of map design that is a visual representation of an imaginary or fictional geography. While some fantasy maps accompany works of fiction and are considered fictional maps, fantasy maps are created to show imaginary places and are not necessarily included in works of literary...
- Floor planFloor planIn architecture and building engineering, a floor plan, or floorplan, is a diagram, usually to scale, showing a view from above of the relationships between rooms, spaces and other physical features at one level of a structure....
- Geologic mapGeologic mapA geologic map or geological map is a special-purpose map made to show geological features. Rock units or geologic strata are shown by color or symbols to indicate where they are exposed at the surface...
- Map designCartographyCartography is the study and practice of making maps. Combining science, aesthetics, and technique, cartography builds on the premise that reality can be modeled in ways that communicate spatial information effectively.The fundamental problems of traditional cartography are to:*Set the map's...
- Nautical chartNautical chartA nautical chart is a graphic representation of a maritime area and adjacent coastal regions. Depending on the scale of the chart, it may show depths of water and heights of land , natural features of the seabed, details of the coastline, navigational hazards, locations of natural and man-made aids...
- Pictorial mapsPictorial mapsPictorial maps are a category of maps that are also loosely called illustrated maps, panoramic maps, perspective maps, bird’s-eye view maps and Geopictorial maps amongst others. In contrast to the regular road map, Atlas or topographic cartography, pictorial maps depict a given territory with a...
- PlanformPlanformIn aviation, a planform is the shape and layout of a fixed-wing aircraft's fuselage and wing. Of all the myriad planforms used, they can typically be grouped into those used for low-speed flight, found on general aviation aircraft, and those used for high-speed flight, found on many military...
- PlatPlatA plat in the U.S. is a map, drawn to scale, showing the divisions of a piece of land. Other English-speaking countries generally call such documents a cadastral map or plan....
- Reversed mapReversed mapthumb|right|The [[The Blue Marble|Blue Marble]] photograph in its original orientationA reversed map, also known as an Upside-Down map or South-Up map, is a map where south is up, north is down, east is left and west is right. Thus the Southern Hemisphere at the top of the map instead of the bottom...
- Road atlasRoad atlasA road atlas is a map or set of maps that primarily display roads and transport links rather than geographical information.- Types :Road atlases come in many shapes, sizes and scales...
- Street mapStreet mapA street map is a map showing roads and streets in a district or entire city. Street maps are great tools for navigating cities, towns or communities. They are available in printed forms, online on the Internet or on mobile phones with GPRS connection....
- Thematic mapThematic mapA thematic map is a type of map or chart especially designed to show a particular theme connected with a specific geographic area. These maps "can portray physical, social, political, cultural, economic, sociological, agricultural, or any other aspects of a city, state, region,nation , or...
- Transit map
- Topographic mapTopographic mapA topographic map is a type of map characterized by large-scale detail and quantitative representation of relief, usually using contour lines in modern mapping, but historically using a variety of methods. Traditional definitions require a topographic map to show both natural and man-made features...
- World mapWorld mapA world map is a map of the surface of the Earth, which may be made using any of a number of different map projections. A map projection is any method of representing the surface of a sphere or other three-dimensional body on a plane....
Modern maps
- Censorship of mapsCensorship of mapsCensorship of maps describes the way of handling the appearance of potential strategically important objects like military bases, power plants or transmitters towards their censorship on maps.The appearance of such objects on maps available to the public may be undesirable, so it is often attempted...
- Google MapsGoogle MapsGoogle Maps is a web mapping service application and technology provided by Google, free , that powers many map-based services, including the Google Maps website, Google Ride Finder, Google Transit, and maps embedded on third-party websites via the Google Maps API...
- Japanese map symbolsJapanese map symbolsThis is a list of symbols appearing on Japanese maps. These symbols are called in the Japanese language.symbolmeaningillustrationsymbolmeaningillustrationMunicipal building Municipal building...
- List of online map services
- MapQuestMapQuestMapQuest is an American free online web mapping service owned by AOL. The company was founded in 1967 as Cartographic Services, a division of R.R. Donnelley & Sons in Chicago, Illinois, United States. It moved to Lancaster, Pennsylvania in 1969. When it became an independent company in 1994, it was...
- Maps of the UK and IrelandMaps of the UK and IrelandMaps of the UK and Ireland are available in various media.-Maps on CD ROM:ISYS OUTDOORS, Anquet Maps and Fugawi offer a series of 1:25,000, 1:50,000 and 1:250,000 scale UK Ordnance Survey maps including agazetteer of place names...
- Map of the United States
- NASA World WindNASA World WindWorld Wind is an open-source virtual globe developed by NASA and the open source community for use on personal computers. Old versions need Microsoft Windows but the more recent Java version, , is cross platform and provides a suite of . The World Wind Java version was awarded in November 2009...
- OrthophotomapOrthophotomapOrthophotomaps are satellite or aerial photos geo-referenced as maps. For example, Google Earth–displayed information is made up of orthophotomap picture tiles.-External links:* *...
- A map created from OrthophotoOrthophotoAn orthophoto, orthophotograph or orthoimage is an aerial photograph geometrically corrected such that the scale is uniform: the photo has the same lack of distortion as a map...
graphy - ABmapsABmapsABmaps.com is a free web mapping server and portal.The website provides services such as address finding, route planner and others. The mapping engine behind the portal is developed by AtlasCT...
- Intermap TechnologiesIntermap TechnologiesIntermap Technologies is a publicly traded company headquartered in Englewood, Douglas County, Colorado, United States. Intermap provides geospatial solutions that allow GIS professionals in commercial and government organizations worldwide to build a broad range of applications...
- Engels MapsEngels MapsEngels Maps is a map company in the Ohio Valley with particular concentration on the Cincinnati-Dayton Region. It also produces Chamber of Commerce maps.-Publications:It has three semi-annual publications that form its foundation:...
- Ordnance SurveyOrdnance SurveyOrdnance Survey , an executive agency and non-ministerial government department of the Government of the United Kingdom, is the national mapping agency for Great Britain, producing maps of Great Britain , and one of the world's largest producers of maps.The name reflects its creation together with...
Maps
Map history
- Early world maps
- George BradshawGeorge BradshawGeorge Bradshaw was an English cartographer, printer and publisher. He is best known for developing the most successful and longest published series of combined railway timetables.-Biography:...
, including maps of the British railway network, first published in 1839 - History of cartographyHistory of cartographyCartography , or mapmaking, has been an integral part of the human story for a long time, possibly up to 8,000 years...
- List of cartographers
- Ordnance SurveyOrdnance SurveyOrdnance Survey , an executive agency and non-ministerial government department of the Government of the United Kingdom, is the national mapping agency for Great Britain, producing maps of Great Britain , and one of the world's largest producers of maps.The name reflects its creation together with...
UK map agency - Sanborn MapsSanborn MapsSanborn Maps is an American publisher of historical and current maps of U.S. cities and towns that were initially created to estimate fire insurance liabilities. The company's maps are frequently used for preservation and restoration efforts....
- detailed American fire insurance maps
Related topics
- Aerial landscape artAerial landscape artAerial landscape art includes paintings and other visual arts which depict or evoke the appearance of a landscape from a perspective above it—usually from a considerable distance—as it might be viewed from an aircraft or spacecraft. Sometimes the art is based not on direct observation but on aerial...
- Aerial photographyAerial photographyAerial photography is the taking of photographs of the ground from an elevated position. The term usually refers to images in which the camera is not supported by a ground-based structure. Cameras may be hand held or mounted, and photographs may be taken by a photographer, triggered remotely or...
- Automatic label placementAutomatic label placementAutomatic label placement refers to the computer methods of placing labels automatically on a map or chart. This is related to the typographic design of such labels....
- Digital geologic mappingDigital geologic mappingDigital geologic mapping is the process by which geologic features are observed, analyzed, and recorded in the field and displayed in real-time on a computer or personal digital assistant...
- Geographic coordinate systemGeographic coordinate systemA geographic coordinate system is a coordinate system that enables every location on the Earth to be specified by a set of numbers. The coordinates are often chosen such that one of the numbers represent vertical position, and two or three of the numbers represent horizontal position...
- Geography CupGeography CupThe Geography Cup is an online, international competition between the United States and the United Kingdom, with the aim of determining which nation collectively knows more about geography. It was also intended to raise awareness of the importance of world geography in the modern world. Any...
- Index mapIndex mapIndex maps are a type of finding aid that allow users find a set of maps covering their regions of interest along with the name or number of the relevant map sheet. An index maps provides geospatial representation on either a sheet of paper or a computer screen...
- Map database managementMap database managementMap database management stems from navigation units becoming more common in automotive vehicles . They serve to perform usual navigation functions, such as finding a route to a desired destination and guiding the driver to it or determining the vehicle’s location and providing information about...
- National Mine Map RepositoryNational Mine Map RepositoryThe National Mine Map Repository is part of the United States Department of the Interior , Office of Surface Mining Reclamation and Enforcement...
- Global MapGlobal MapGlobal Map is a set of digital maps which accurately cover the whole globe to express the status of global environment. It is developed through the cooperation of National Mapping Organizations in the world...
External links
- Un-Intentional Maps A blog showing pictures of things that look like maps
- Maps-For-Free.com Free global relief maps
- World political map Up to date world political map
- Geography and Maps, an Illustrated Guide, by the staff of the U.S. Library of CongressLibrary of CongressThe Library of Congress is the research library of the United States Congress, de facto national library of the United States, and the oldest federal cultural institution in the United States. Located in three buildings in Washington, D.C., it is the largest library in the world by shelf space and...
. - Historical Maps from the Hargrett Library Collection (University of Georgia) - browse over 1000 maps from as early as 1544. DjVu format; requires free plugin or JAVA
- The History of Cartography Project at the University of Wisconsin, a comprehensive research project in the history of maps and mapping
- Mapping History Project - University of OregonUniversity of Oregon-Colleges and schools:The University of Oregon is organized into eight schools and colleges—six professional schools and colleges, an Arts and Sciences College and an Honors College.- School of Architecture and Allied Arts :...
- Mapping the World The Lionel Pincus and Princess Firyal Map Division at The New York Public Library
- Online map collections at the Library of CongressLibrary of CongressThe Library of Congress is the research library of the United States Congress, de facto national library of the United States, and the oldest federal cultural institution in the United States. Located in three buildings in Washington, D.C., it is the largest library in the world by shelf space and...
- John H.W. Stuckenberg Map Digital Collection at Gettysburg College
- Journal of Maps
- History Maps
- Interactive map of Belarus
- Early Modern Map Digitization A web resource for digitizing early maps
- Website looking at the construction of pictorial maps