
Geographic Information System
Encyclopedia
A geographic information system, geographical information science, or geospatial information studies is a system designed to capture, store, manipulate, analyze, manage, and present all types of geographically referenced data. In the simplest terms, GIS is the merging of cartography
, statistical analysis, and database
technology.
A GIS can be thought of as a system—it digitally creates and "manipulates" spatial areas that may be jurisdictional, purpose or application-oriented for which a specific GIS is developed. Hence, a GIS developed for an application, jurisdiction, enterprise or purpose may not be necessarily interoperable or compatible with a GIS that has been developed for some other application, jurisdiction, enterprise, or purpose. What goes beyond a GIS is a spatial data infrastructure
(SDI), a concept that has no such restrictive boundaries.
Therefore, in a general sense, the term describes any information system
that integrates, stores, edits, analyzes, shares and displays geographic
information for informing decision making
. The term GIS-centric, however, has been specifically defined as the use of the Esri
ArcGIS geodatabase as the asset/feature data repository central to computerized maintenance management system
(CMMS) as a part of enterprise asset management
and analytical software systems. GIS-centric certification criteria has been specifically defined by NAGCS, the National Association of GIS-Centric Solutions. http://www.nagcs.org/index.asp GIS applications are tools that allow users to create interactive queries (user-created searches), analyze spatial information, edit data, maps, and present the results of all these operations. Geographic information science
is the science underlying the geographic concepts, applications and systems.
Examples of use are:
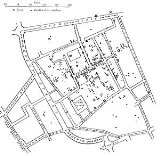
depicted a cholera
outbreak in London using points to represent the locations of some individual cases, possibly the earliest use of the geographic method. His study of the distribution of cholera led to the source of the disease, a contaminated water pump (the Broad Street Pump, whose handle he had disconnected, thus terminating the outbreak) within the heart of the cholera outbreak.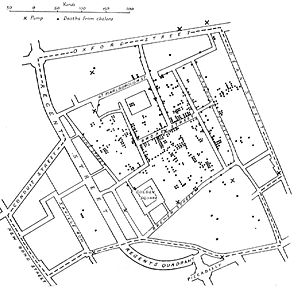 While the basic elements of topography
and theme existed previously in cartography
, the John Snow map was unique, using cartographic methods not only to depict but also to analyze clusters of geographically-dependent phenomena for the first time.
The early 20th century saw the development of photozincography
, which allowed maps to be split into layers, for example one layer for vegetation and another for water. This was particularly used for printing contours – drawing these was a labour intensive task but having them on a separate layer meant they could be worked on without the other layers to confuse the draughtsman. This work was originally drawn on glass plates but later, plastic film was introduced, with the advantages of being lighter, using less storage space and being less brittle, among others. When all the layers were finished, they were combined into one image using a large process camera
. Once colour printing came in, the layers idea was also used for creating separate printing plates for each colour. While the use of layers much later became one of the main typical features of a contemporary GIS, the photographic process just described is not considered to be a GIS in itself – as the maps were just images with no database to link them to.
Computer hardware development spurred by nuclear weapon
research led to general-purpose computer 'mapping' applications by the early 1960s.
The year 1960 saw the development of the world's first true operational GIS in Ottawa, Ontario, Canada by the federal Department of Forestry and Rural Development. Developed by Dr. Roger Tomlinson
, it was called the Canada Geographic Information System (CGIS) and was used to store, analyze, and manipulate data collected for the Canada Land Inventory
(CLI) – an effort to determine the land capability for rural Canada by mapping information about soils, agriculture, recreation, wildlife, waterfowl, forestry and land use at a scale of 1:50,000. A rating classification factor was also added to permit analysis.
CGIS was an improvement over 'computer mapping' applications as it provided capabilities for overlay, measurement and digitizing
/scanning. It supported a national coordinate system that spanned the continent, coded lines as arcs
having a true embedded topology and it stored the attribute and locational information in separate files. As a result of this, Tomlinson has become known as the 'father of GIS', particularly for his use of overlays in promoting the spatial analysis of convergent geographic data.
CGIS lasted into the 1990s and built a large digital land resource database in Canada. It was developed as a mainframe
-based system in support of federal and provincial resource planning and management. Its strength was continent-wide analysis of complex dataset
s. The CGIS was never available in a commercial form.
In 1964, Howard T. Fisher formed the Laboratory for Computer Graphics and Spatial Analysis at the Harvard Graduate School of Design (LCGSA 1965–1991), where a number of important theoretical concepts in spatial data handling were developed, and which by the 1970s had distributed seminal software code and systems, such as 'SYMAP', 'GRID' and 'ODYSSEY' – that served as sources for subsequent commercial development—to universities, research centers and corporations worldwide.
By the early 1980s, M&S Computing (later Intergraph
)along with Bentley Systems Incorporated for the CAD platform, Environmental Systems Research Institute (ESRI
), CARIS
(Computer Aided Resource Information System) and ERDAS (Earth Resource Data Analysis System) emerged as commercial vendors of GIS software, successfully incorporating many of the CGIS features, combining the first generation approach to separation of spatial and attribute information with a second generation approach to organizing attribute data into database structures.
In parallel, the development of two public domain systems began in the late 1970s and early 1980s.
The Map Overlay and Statistical System (MOSS
) project started in 1977 in Fort Collins, Colorado under the auspices of the Western Energy and Land Use Team (WELUT) and the US Fish and Wildlife Service. GRASS GIS
was introduced in 1982 by the US Army Corps of Engineering Research Laboratory (USA-CERL) in Champaign, Illinois, a branch of the US Army Corps of Engineers to meet the need of the US military for software for land management and environmental planning.
In the later 1980s and 1990s, industry growth was spurred on by the growing use of GIS on Unix
workstations and the personal computer. By the end of the 20th century, the rapid growth in various systems had been consolidated and standardized on relatively few platforms and users were beginning to explore the concept of viewing GIS data over the Internet
, requiring data format and transfer standards. More recently, a growing number of free, open-source GIS packages run on a range of operating systems and can be customized to perform specific tasks. Increasingly geospatial data
and mapping applications
are being made available via the world wide web
.
Several authoritative books on the history of GIS have been published.
(CAD) program, and geo-referencing capabilities. With the wide availability of ortho-rectified imagery
(both from satellite and aerial sources), heads-up digitizing is becoming the main avenue through which geographic data is extracted. Heads-up digitizing involves the tracing of geographic data directly on top of the aerial imagery instead of by the traditional method of tracing the geographic form on a separate digitizing tablet
(heads-down digitizing).
Any variable that can be located spatially, and increasingly also temporally, can be referenced using a GIS. Locations or extents in Earth space–time may be recorded as dates/times of occurrence, and x, y, and z coordinates representing, longitude
, latitude
, and elevation, respectively. These GIS coordinates may represent other quantified systems of temporo-spatial reference (for example, film frame number, stream gage station, highway mile-marker, surveyor benchmark, building address, street intersection, entrance gate, water depth sounding, POS
or CAD drawing origin/units). Units applied to recorded temporal-spatial data can vary widely (even when using exactly the same data, see map projection
s), but all Earth-based spatial–temporal location and extent references should, ideally, be relatable to one another and ultimately to a "real" physical location or extent in space–time.
Related by accurate spatial information, an incredible variety of real-world and projected past or future data can be analyzed, interpreted and represented to facilitate education and decision making
. This key characteristic of GIS has begun to open new avenues of scientific inquiry into behaviors and patterns of previously considered unrelated real-world information.
In developing a digital topographic data base for a GIS, topographical maps are the main source of data. Aerial photography and satellite images are extra sources for collecting data and identifying attributes which can be mapped in layers over a location facsimile of scale. The scale of a map and geographical rendering area representation type are very important aspects since the information content depends mainly on the scale set and resulting locatability of the map's representations. In order to digitize a map, the map has to be checked within theoretical dimensions, then scanned into a raster format, and resulting raster data has to be given a theoretical dimension by a rubber sheeting/warping technology process.
Uncertainty is a significant problem in designing a GIS because spatial data tend to be used for purposes for which they were never intended. Some maps were made many decades ago, where at that time the computer industry was not even in its perspective establishments. This has led to historical reference maps without common norms. Map accuracy is a relative issue of minor importance in cartography. All maps are established for communication ends. Maps use a historically constrained technology of pen and paper to communicate a view of the world to their users. Cartographers feel little need to communicate information based on accuracy, for when the same map is digitized and input into a GIS, the mode of use often changes. The new uses extend well beyond a determined domain for which the original map was intended and designed.
A quantitative analysis of maps brings accuracy issues into focus. The electronic and other equipment used to make measurements for GIS is far more precise than the machines of conventional map analysis. [Retrieved USGS]. The truth is that all geographical data are inherently inaccurate, and these inaccuracies will propagate through GIS operations in ways that are difficult to predict, yet have goals of conveyance in mind for original design.
Accuracy Standards for 1:24000 Scales Map: 1:24,000 ± 40.00 feet
This means that when we see a point or attribute on a map, its "probable" location is within a +/- 40 foot area of its rendered reference, according to area representations and scale.
A GIS can also convert existing digital information, which may not yet be in map form, into forms it can recognize, employ for its data analysis processes, and use in forming mapping output. For example, digital satellite images generated through remote sensing
can be analyzed to produce a map-like layer of digital information about vegetative covers on land locations. Another fairly recently developed resource for naming GIS location objects is the Getty Thesaurus of Geographic Names
(GTGN), which is a structured vocabulary containing about 1,000,000 names and other information about places.
Likewise, researched census or hydrological tabular data can be displayed in map-like form, serving as layers of thematic information for forming a GIS map.
. Points, lines, and polygons are the stuff of mapped location attribute references. A new hybrid method of storing data is that of identifying point clouds, which combine three-dimensional points with RGB information at each point, returning a "3D color image". GIS Thematic maps then are becoming more and more realistically visually descriptive of what they set out to show or determine.
as the basis of the vector model of area attribute rendering. While a digital image is concerned with its output blending together its grid based details as an identifiable representation of reality, in a photograph or art image transferred into a computer, the raster data type will reflect a digitized abstraction of reality dealt with by grid populating tones or objects, quantities, cojoined or open boundaries, and map relief schemas. Aerial photos are one commonly used form of raster data, with one primary purpose in mind: to display a detailed image on a map area, or for the purposes of rendering its identifiable objects by digitization. Additional raster data sets used by a GIS will contain information regarding elevation, a digital elevation model
, or reflectance of a particular wavelength of light, Landsat, or other electromagnetic spectrum indicators.
 Raster data type consists of rows and columns of cells, with each cell storing a single value. Raster data can be images (raster
images) with each pixel (or cell) containing a color value. Additional values recorded for each cell may be a discrete value, such as land use, a continuous value, such as temperature, or a null value if no data is available. While a raster cell stores a single value, it can be extended by using raster bands to represent RGB (red, green, blue) colors, colormaps (a mapping between a thematic code and RGB value), or an extended attribute table with one row for each unique cell value. The resolution of the raster data set is its cell width in ground units.
Raster data is stored in various formats; from a standard file-based structure of TIF, JPEG, etc. to binary large object
(BLOB) data stored directly in a relational database management system
(RDBMS) similar to other vector-based feature classes. Database storage, when properly indexed, typically allows for quicker retrieval of the raster data but can require storage of millions of significantly sized records.
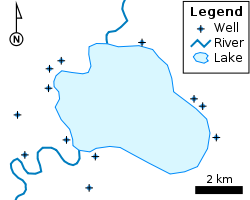
Each of these geometries are linked to a row in a database that describes their attributes. For example, a database that describes lakes may contain a lake's depth, water quality, pollution level. This information can be used to make a map to describe a particular attribute of the dataset. For example, lakes could be coloured depending on level of pollution. Different geometries can also be compared. For example, the GIS could be used to identify all wells (point geometry) that are within one kilometre of a lake (polygon geometry) that has a high level of pollution.
Vector features can be made to respect spatial integrity through the application of topology rules such as 'polygons must not overlap'. Vector data can also be used to represent continuously varying phenomena. Contour line
s and triangulated irregular network
s (TIN) are used to represent elevation or other continuously changing values. TINs record values at point locations, which are connected by lines to form an irregular mesh of triangles. The face of the triangles represent the terrain surface.
in another table.
Software is currently being developed to support spatial and non-spatial decision-making, with the solutions to spatial problems being integrated with solutions to non-spatial problems. The end result with these flexible spatial decision-making support systems (FSDSSs) is expected to be that non-experts will be able to use GIS, along with spatial criteria, and simply integrate their non-spatial criteria to view solutions to multi-criteria problems. This system is intended to assist decision-making.
Existing data printed on paper or PET film
maps can be digitized or scanned to produce digital data. A digitizer produces vector data as an operator traces points, lines, and polygon boundaries from a map. Scanning
a map results in raster data that could be further processed to produce vector data.
Survey
data can be directly entered into a GIS from digital data collection systems on survey instruments using a technique called coordinate geometry (COGO)
. Positions from a global navigation satellite system (GNSS) like Global Positioning System
(GPS), another survey tool, can also be collected and then imported into a GIS. A current trend in data collection gives users the ability to utilize field computers
with the ability to edit live data using wireless connections or disconnected editing sessions. This has been enhanced by the availability of low cost mapping grade GPS units with decimeter accuracy in real time. This eliminates the need to post process, import, and update the data in the office after fieldwork has been collected. This includes the ability to incorporate positions collected using a laser rangefinder. New technologies also allow users to create maps as well as analysis directly in the field, making projects more efficient and mapping more accurate.
Remotely sensed
data also plays an important role in data collection and consist of sensors attached to a platform. Sensors include cameras, digital scanners and LIDAR
, while platforms usually consist of aircraft and satellite
s. Recently with the development of Miniature UAVs, aerial data collection is becoming possible at much lower costs, and on a more frequent basis. For example, the Aeryon Scout was used to map a 50 acre area with a Ground sample distance
of 1 inch in only 12 minutes.
The majority of digital data currently comes from photo interpretation of aerial photographs. Soft-copy workstations are used to digitize features directly from stereo pairs
of digital photographs. These systems allow data to be captured in two and three dimensions, with elevations measured directly from a stereo pair using principles of photogrammetry
. Currently, analog aerial photos are scanned before being entered into a soft-copy system, but as high quality digital cameras become cheaper this step will be skipped.
Satellite remote sensing provides another important source of spatial data. Here satellites use different sensor packages to passively measure the reflectance from parts of the electromagnetic spectrum
or radio waves that were sent out from an active sensor such as radar. Remote sensing collects raster data that can be further processed using different bands to identify objects and classes of interest, such as land cover.
When data is captured, the user should consider if the data should be captured with either a relative accuracy or absolute accuracy, since this could not only influence how information will be interpreted but also the cost of data capture.
In addition to collecting and entering spatial data, attribute data is also entered into a GIS. For vector data, this includes additional information about the objects represented in the system.
After entering data into a GIS, the data usually requires editing, to remove errors, or further processing. For vector data it must be made "topologically correct" before it can be used for some advanced analysis. For example, in a road network, lines must connect with nodes at an intersection. Errors such as undershoots and overshoots must also be removed. For scanned maps, blemishes on the source map may need to be removed from the resulting raster. For example, a fleck of dirt might connect two lines that should not be connected.
More advanced data processing can occur with image processing
, a technique developed in the late 1960s by NASA
and the private sector to provide contrast enhancement, false colour rendering and a variety of other techniques including use of two dimensional Fourier transforms.
Since digital data is collected and stored in various ways, the two data sources may not be entirely compatible. So a GIS must be able to convert geographic data
from one structure to another.
The earth can be represented by various models, each of which may provide a different set of coordinates (e.g., latitude, longitude, elevation) for any given point on the Earth's surface. The simplest model is to assume the earth is a perfect sphere. As more measurements of the earth have accumulated, the models of the earth have become more sophisticated and more accurate. In fact, there are models that apply to different areas of the earth to provide increased accuracy (e.g., North American Datum, 1927 – NAD27 – works well in North America, but not in Europe). See datum (geodesy) for more information.
Projection is a fundamental component of map making. A projection
is a mathematical means of transferring information from a model of the Earth, which represents a three-dimensional curved surface, to a two-dimensional medium—paper or a computer screen. Different projections are used for different types of maps because each projection particularly suits specific uses. For example, a projection that accurately represents the shapes of the continents will distort their relative sizes. See Map projection
for more information.
Since much of the information in a GIS comes from existing maps, a GIS uses the processing power of the computer to transform digital information, gathered from sources with different projections and/or different coordinate systems, to a common projection and coordinate system. For images, this process is called rectification
.
" which, when delivered via intranet, democratizes access to operational sorts not usually privy to this type of information.
The elevation at a point will have perpendicular tangents (slope) passing through the point, in an east-west and north-south direction.
These two tangents give two components, ∂z/∂x and ∂z/∂y, which then be used to determine the overall direction of slope, and the aspect of the slope. The gradient is defined as a vector quantity with components equal to the partial derivatives of the surface in the x and y directions.
The calculation of the overall 3x3 grid slope and aspect for methods that determine east-west and north-south component use the following formulas respectively:


Zhou and Liu describe another algorithm for calculating aspect, as follows:

s that indicate differing amounts of rainfall.
Such a map can be thought of as a rainfall contour map. Many sophisticated methods can estimate the characteristics of surfaces from a limited number of point measurements. A two-dimensional contour map created from the surface modeling of rainfall point measurements may be overlaid and analyzed with any other map in a GIS covering the same area.
Additionally, from a series of three-dimensional points, or digital elevation model, isopleth lines representing elevation contours can be generated, along with slope analysis, shaded relief, and other elevation products. Watersheds can be easily defined for any given reach, by computing all of the areas contiguous and uphill from any given point of interest. Similarly, an expected thalweg
of where surface water would want to travel in intermittent and permanent streams can be computed from elevation data in the GIS.
are linear networks of objects that can be used to represent interconnected features, and to perform special spatial analysis on them. A geometric network is composed of edges, which are connected at junction points, similar to graphs
in mathematics and computer science. Just like graphs, networks can have weight and flow assigned to its edges, which can be used to represent various interconnected features more accurately. Geometric networks are often used to model road networks and public utility networks, such as electric, gas, and water networks. Network modeling is also commonly employed in transportation planning
, hydrology
modeling, and infrastructure
modeling.
involves calculation of slope and aspect, DEMs are very useful for hydrological analysis. Slope and aspect can then be used to determine direction of surface runoff, and hence flow accumulation for the formation of streams, rivers and lakes. Areas of divergent flow can also give a clear indication of the boundaries of a catchment. Once a flow direction and accumulation matrix has been created, queries can be performed that show contributing or dispersal areas at a certain point. More detail can be added to the model, such as terrain roughness, vegetation types and soil types, which can influence infiltration and evapotranspiration rates, and hence influencing surface flow. These extra layers of detail ensures a more accurate model. Also, check out GIS in Water Contamination and GIS in Environmental Contamination
.
 The term "cartographic modeling" was (probably) coined by Dana Tomlin in his PhD dissertation and later in his book which has the term in the title. Cartographic modeling refers to a process where several thematic layers of the same area are produced, processed, and analyzed. Tomlin used raster layers, but the overlay method (see below) can be used more generally. Operations on map layers can be combined into algorithms, and eventually into simulation or optimization models.
overlays. A union
overlay combines the geographic features and attribute tables of both inputs into a single new output. An intersect
overlay defines the area where both inputs overlap and retains a set of attribute fields for each. A symmetric difference
overlay defines an output area that includes the total area of both inputs except for the overlapping area.
Data extraction is a GIS process similar to vector overlay, though it can be used in either vector or raster data analysis. Rather than combining the properties and features of both datasets, data extraction involves using a "clip" or "mask" to extract the features of one data set that fall within the spatial extent of another dataset.
In raster data analysis, the overlay of datasets is accomplished through a process known as "local operation on multiple rasters" or "map algebra
," through a function that combines the values of each raster's matrix
. This function may weigh some inputs more than others through use of an "index model" that reflects the influence of various factors upon a geographic phenomenon.
, since in most cases not all of the GIS functionality is used. Cartographic products can be either in a digital or in a hardcopy format. Powerful analysis techniques with different data representation can produce high-quality maps within a short time period. The main problem in Automated Cartography is to use a single set of data to produce multiple products at a variety of scales, a technique known as cartographic generalization
.
is a point-pattern analysis that produces field predictions from data points. It is a way of looking at the statistical properties of those special data. It is different from general applications of statistics
because it employs the use of graph theory
and matrix algebra
to reduce the number of parameters in the data. Only the second-order properties of the GIS data are analyzed.
When phenomena are measured, the observation methods dictate the accuracy of any subsequent analysis. Due to the nature of the data (e.g. traffic patterns in an urban environment; weather patterns over the Pacific Ocean
), a constant or dynamic degree of precision is always lost in the measurement. This loss of precision is determined from the scale and distribution of the data collection.
To determine the statistical relevance of the analysis, an average is determined so that points (gradients) outside of any immediate measurement can be included to determine their predicted behavior. This is due to the limitations of the applied statistic and data collection methods, and interpolation is required to predict the behavior of particles, points, and locations that are not directly measurable.
 Interpolation
is the process by which a surface is created, usually a raster dataset, through the input of data collected at a number of sample points. There are several forms of interpolation, each which treats the data differently, depending on the properties of the data set. In comparing interpolation methods, the first consideration should be whether or not the source data will change (exact or approximate). Next is whether the method is subjective, a human interpretation, or objective. Then there is the nature of transitions between points: are they abrupt or gradual. Finally, there is whether a method is global (it uses the entire data set to form the model), or local where an algorithm is repeated for a small section of terrain.
Interpolation is a justified measurement because of a spatial autocorrelation principle that recognizes that data collected at any position will have a great similarity to, or influence of those locations within its immediate vicinity.
Digital elevation model
s (DEM), triangulated irregular network
s (TIN), edge finding algorithms, Thiessen polygons, Fourier analysis, (weighted) moving averages, inverse distance weighting
, kriging
, spline
, and trend surface analysis
are all mathematical methods to produce interpolative data.
individual addresses, such as a road centerline file with address ranges. The individual address locations have historically been interpolated, or estimated, by examining address ranges along a road segment. These are usually provided in the form of a table or database. The GIS will then place a dot approximately where that address belongs along the segment of centerline. For example, an address point of 500 will be at the midpoint of a line segment that starts with address 1 and ends with address 1000. Geocoding can also be applied against actual parcel data, typically from municipal tax maps. In this case, the result of the geocoding will be an actually positioned space as opposed to an interpolated point. This approach is being increasingly used to provide more precise location information.
There are several potentially dangerous caveats that are often overlooked when using interpolation. See the full entry for Geocoding
for more information.
Various algorithms are used to help with address matching when the spellings of addresses differ. Address information that a particular entity or organization has data on, such as the post office, may not entirely match the reference theme. There could be variations in street name spelling, community name, etc. Consequently, the user generally has the ability to make matching criteria more stringent, or to relax those parameters so that more addresses will be mapped. Care must be taken to review the results so as not to map addresses incorrectly due to overzealous matching parameters.
is the design and production of maps, or visual representations of spatial data. The vast majority of modern cartography is done with the help of computers, usually using a GIS but production quality cartography is also achieved by importing layers into a design program to refine it. Most GIS software gives the user substantial control over the appearance of the data.
Cartographic work serves two major functions:
First, it produces graphics on the screen or on paper that convey the results of analysis to the people who make decisions about resources. Wall maps and other graphics can be generated, allowing the viewer to visualize and thereby understand the results of analyses or simulations of potential events. Web Map Servers facilitate distribution of generated maps through web browsers using various implementations of web-based application programming interfaces (AJAX
, Java, Flash
, etc.).
Second, other database information can be generated for further analysis or use. An example would be a list of all addresses within one mile (1.6 km) of a toxic spill.
s show the shape of land surface with contour line
s or with shaded relief
.
Today, graphic display techniques such as shading
based on altitude
in a GIS can make relationships among map elements visible, heightening one's ability to extract and analyze information. For example, two types of data were combined in a GIS to produce a perspective view of a portion of San Mateo County, California
.
A GIS was used to register and combine the two images to render
the three-dimensional perspective view looking down the San Andreas Fault
, using the Thematic Mapper image pixels, but shaded using the elevation of the landform
s. The GIS display depends on the viewing point of the observer
and time of day of the display, to properly render the shadows created by the sun's rays at that latitude, longitude, and time of day.
An archeochrome is a new way of displaying spatial data. It is a thematic on a 3D map that is applied to a specific building or a part of a building. It is suited to the visual display of heat loss data.
tools provide the data processing functionality of traditional Extract, Transform, Load
(ETL) software, but with a primary focus on the ability to manage spatial data. They provide GIS users with the ability to translate data between different standards and proprietary formats, whilst geometrically transforming the data en-route.
 Many disciplines can benefit from GIS technology. An active GIS market has resulted in lower costs and continual improvements in the hardware and software components of GIS. These developments will, in turn, result in a much wider use of the technology throughout science, government, business
, and industry
, with applications including real estate
, public health
, crime mapping
, national defense
, sustainable development
, natural resources
, landscape architecture
, archaeology
, regional and community planning, transportation and logistics. GIS is also diverging into location-based service
s (LBS). LBS allows GPS enabled mobile devices to display their location in relation to fixed assets (nearest restaurant, gas station, fire hydrant), mobile assets (friends, children, police car) or to relay their position back to a central server for display or other processing. These services continue to develop with the increased integration of GPS functionality with increasingly powerful mobile electronics (cell phones, PDAs, laptops).
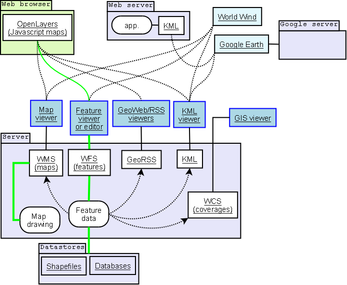
(OGC) is an international industry consortium of 384 companies, government agencies, universities and individuals participating in a consensus process to develop publicly available geoprocessing specifications. Open interfaces and protocols defined by OpenGIS Specifications support interoperable solutions that "geo-enable" the Web, wireless and location-based services, and mainstream IT, and empower technology developers to make complex spatial information and services accessible and useful with all kinds of applications. Open Geospatial Consortium (OGC) protocols include Web Map Service
(WMS) and Web Feature Service
(WFS).
GIS products are broken down by the OGC into two categories, based on how completely and accurately the software follows the OGC specifications.
 Compliant Products are software products that comply to OGC's OpenGIS Specifications. When a product has been tested and certified as compliant through the OGC Testing Program, the product is automatically registered as "compliant" on this site.
Implementing Products are software products that implement OpenGIS Specifications but have not yet passed a compliance test. Compliance tests are not available for all specifications. Developers can register their products as implementing draft or approved specifications, though OGC reserves the right to review and verify each entry.
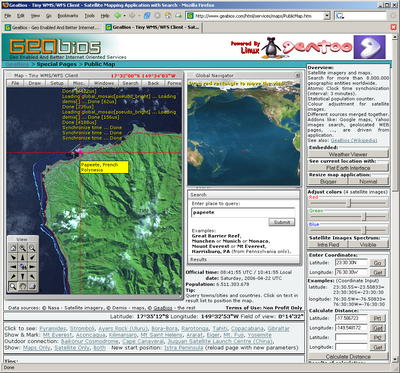
and Bing Maps. These websites give the public access to huge amounts of geographic data.
Some of them, like Google Maps and OpenLayers
, expose an API
that enable users to create custom applications. These toolkits commonly offer street maps, aerial/satellite imagery, geocoding, searches, and routing functionality.
Other applications for publishing geographic information on the web include GeoBase (Telogis GIS software), Smallworld
's SIAS or GSS, MapInfo
's MapXtreme or PlanAcess or Stratus Connect, Cadcorp
's GeognoSIS, Intergraph
's GeoMedia
WebMap (TM), ESRI
's ArcIMS
, ArcGIS Server, Autodesk's MapGuide, Bentley's Geo Web Publisher, SeaTrails' AtlasAlive, ObjectFX's Web Mapping Tools, ERDAS APOLLO Suite, Google Earth
, Google Fusion Tables
, and the open source MapServer
or GeoServer
.
In recent years web mapping services have begun to adopt features more common in GIS. Services such as Google Maps
and Bing Maps allow users to access and annotate maps and share the maps with others.
(SOA). This allows application developers to create flexible and extensible GIS that can quickly respond to changing and future organizational needs.
The outputs from a GIS in the form of maps combined with satellite imagery allow researchers to view their subjects in ways that literally never have been seen before. The images are also invaluable for conveying the effects of climate change to non-scientists.
As an example, the changes in vegetation vigor through a growing season can be animated to determine when drought was most extensive in a particular region. The resulting graphic, known as a normalized vegetation index, represents a rough measure of plant health. Working with two variables over time would then allow researchers to detect regional differences in the lag between a decline in rainfall and its effect on vegetation.
GIS technology and the availability of digital data on regional and global scales enable such analyses. The satellite sensor output used to generate a vegetation graphic is produced for example by the Advanced Very High Resolution Radiometer
(AVHRR). This sensor system detects the amounts of energy reflected from the Earth's surface across various bands of the spectrum for surface areas of about 1 square kilometer. The satellite sensor produces images of a particular location on the Earth twice a day. AVHRR and more recently the Moderate-Resolution Imaging Spectroradiometer (MODIS) are only two of many sensor systems used for Earth surface analysis. More sensors will follow, generating ever greater amounts of data.
GIS and related technology will help greatly in the management and analysis of these large volumes of data, allowing for better understanding of terrestrial processes and better management of human activities to maintain world economic vitality and environmental quality.
In addition to the integration of time in environmental studies, GIS is also being explored for its ability to track and model the progress of humans throughout their daily routines. A concrete example of progress in this area is the recent release of time-specific population data by the US Census. In this data set, the populations of cities are shown for daytime and evening hours highlighting the pattern of concentration and dispersion generated by North American commuting patterns. The manipulation and generation of data required to produce this data would not have been possible without GIS.
Using models to project the data held by a GIS forward in time have enabled planners to test policy decisions. These systems are known as Spatial Decision Support System
s.
Semantic Web Activity
are proving useful for data integration
problems in information systems. Correspondingly, such technologies have been proposed as a means to facilitate interoperability
and data reuse among GIS applications and also to enable new analysis mechanisms.
Ontologies
are a key component of this semantic approach as they allow a formal, machine-readable specification of the concepts and relationships in a given domain. This in turn allows a GIS to focus on the intended meaning of data rather than its syntax or structure. For example, reasoning that a land cover type classified as deciduous needleleaf trees in one dataset is a specialization or subset
of land cover type forest in another more roughly classified dataset can help a GIS automatically merge the two datasets under the more general land cover classification. Tentative ontologies have been developed in areas related to GIS applications, for example the hydrology ontology developed by the Ordnance Survey
in the United Kingdom
and the SWEET ontologies developed by NASA
's Jet Propulsion Laboratory
. Also, simpler ontologies and semantic metadata standards are being proposed by the W3C Geo Incubator Group to represent geospatial data on the web.
Recent research results in this area can be seen in the International Conference on Geospatial Semantics and the Terra Cognita – Directions to the Geospatial Semantic Web workshop at the International Semantic Web Conference.
Cartography
Cartography is the study and practice of making maps. Combining science, aesthetics, and technique, cartography builds on the premise that reality can be modeled in ways that communicate spatial information effectively.The fundamental problems of traditional cartography are to:*Set the map's...
, statistical analysis, and database
Database
A database is an organized collection of data for one or more purposes, usually in digital form. The data are typically organized to model relevant aspects of reality , in a way that supports processes requiring this information...
technology.
A GIS can be thought of as a system—it digitally creates and "manipulates" spatial areas that may be jurisdictional, purpose or application-oriented for which a specific GIS is developed. Hence, a GIS developed for an application, jurisdiction, enterprise or purpose may not be necessarily interoperable or compatible with a GIS that has been developed for some other application, jurisdiction, enterprise, or purpose. What goes beyond a GIS is a spatial data infrastructure
Spatial Data Infrastructure
A spatial data infrastructure is a framework of spatial data, metadata, users and tools that are interactively connected in order to use spatial data in an efficient and flexible way...
(SDI), a concept that has no such restrictive boundaries.
Therefore, in a general sense, the term describes any information system
Information systems
Information Systems is an academic/professional discipline bridging the business field and the well-defined computer science field that is evolving toward a new scientific area of study...
that integrates, stores, edits, analyzes, shares and displays geographic
Georeference
To georeference something means to define its existence in physical space. That is, establishing its location in terms of map projections or coordinate systems. The term is used both when establishing the relation between raster or vector images and coordinates, and when determining the spatial...
information for informing decision making
Decision making
Decision making can be regarded as the mental processes resulting in the selection of a course of action among several alternative scenarios. Every decision making process produces a final choice. The output can be an action or an opinion of choice.- Overview :Human performance in decision terms...
. The term GIS-centric, however, has been specifically defined as the use of the Esri
ESRI
Esri is a software development and services company providing Geographic Information System software and geodatabase management applications. The headquarters of Esri is in Redlands, California....
ArcGIS geodatabase as the asset/feature data repository central to computerized maintenance management system
Computerized Maintenance Management System
Computerized maintenance management system is also known as enterprise asset management and computerized maintenance management information system ....
(CMMS) as a part of enterprise asset management
Enterprise Asset Management
Enterprise asset management means the whole life optimal management of the physical assets of an organization to maximize value. It covers such things as the design, construction, commissioning, operations, maintenance and decommissioning/replacement of plant, equipment and facilities...
and analytical software systems. GIS-centric certification criteria has been specifically defined by NAGCS, the National Association of GIS-Centric Solutions. http://www.nagcs.org/index.asp GIS applications are tools that allow users to create interactive queries (user-created searches), analyze spatial information, edit data, maps, and present the results of all these operations. Geographic information science
Geographic Information Science
Geographic information science is the academic theory behind the development, use, and application of geographic information systems...
is the science underlying the geographic concepts, applications and systems.
Applications
GIS technology can be used for:- earth surface-based scientific investigations;
- resource managementResource managementIn organizational studies, resource management is the efficient and effective deployment of an organization's resources when they are needed. Such resources may include financial resources, inventory, human skills, production resources, or information technology...
- reference and projections of a geospatial nature, both artificial and natural;
- asset management and location planning
- archaeologyArchaeologyArchaeology, or archeology , is the study of human society, primarily through the recovery and analysis of the material culture and environmental data that they have left behind, which includes artifacts, architecture, biofacts and cultural landscapes...
; - environmental impact-assessmentEnvironmental impact assessmentAn environmental impact assessment is an assessment of the possible positive or negative impact that a proposed project may have on the environment, together consisting of the natural, social and economic aspects....
; - infrastructureInfrastructureInfrastructure is basic physical and organizational structures needed for the operation of a society or enterprise, or the services and facilities necessary for an economy to function...
assessment and development; - urban planningUrban planningUrban planning incorporates areas such as economics, design, ecology, sociology, geography, law, political science, and statistics to guide and ensure the orderly development of settlements and communities....
and regional planningRegional planningRegional planning deals with the efficient placement of land use activities, infrastructure, and settlement growth across a larger area of land than an individual city or town. The related field of urban planning deals with the specific issues of city planning...
; - cartographyCartographyCartography is the study and practice of making maps. Combining science, aesthetics, and technique, cartography builds on the premise that reality can be modeled in ways that communicate spatial information effectively.The fundamental problems of traditional cartography are to:*Set the map's...
, for a thematic and/or time-based purpose; - criminologyCriminologyCriminology is the scientific study of the nature, extent, causes, and control of criminal behavior in both the individual and in society...
; - geospatial intelligenceGeographic information systems in geospatial intelligenceGeographic Information Systems new and constantly evolving role in geospatial intelligence and United States national security allows a user to efficiently manage, analyze, and produce geospatial data, to combine GEOINT with other forms of intelligence collection, and to perform highly developed...
; - GIS data development;
- geographic history;
- marketingMarketingMarketing is the process used to determine what products or services may be of interest to customers, and the strategy to use in sales, communications and business development. It generates the strategy that underlies sales techniques, business communication, and business developments...
(also see Geo (marketing)Geo (marketing)As a general term, Geomarketing is the integration of Geographical intelligence into all marketing aspects including sales and distribution. Geomarketing Research is the use of geographic parameters in research methodology starting from sampling, data collection, analysis, and...
); - logisticsLogisticsLogistics is the management of the flow of goods between the point of origin and the point of destination in order to meet the requirements of customers or corporations. Logistics involves the integration of information, transportation, inventory, warehousing, material handling, and packaging, and...
; - population and demographic studiesDemographicsDemographics are the most recent statistical characteristics of a population. These types of data are used widely in sociology , public policy, and marketing. Commonly examined demographics include gender, race, age, disabilities, mobility, home ownership, employment status, and even location...
; - public health planning.
- prospectivity mappingProspectivity MappingProspectivity mapping, also known as mineral prospectivity mapping or mineral potential mapping, defines a process used to make better use of mineral exploration data...
; - statistical analysis;
- GIS in environmental contaminationGIS in environmental contaminationGIS in environmental contamination is the use of ArcGIS software in mapping out the contaminants in soil and water using the spatial interpolation tools from ArcGIS. Soil and water contamination by metals and other contaminants have become a major environmental problem after the industrialization...
; - Disease surveillance;
- military planning.
- utility and analysis applications;
- high consequence area (HCA) analysis;
- outage and trouble call management;
- Damage Prevention;
- Engineering Analysis.
Examples of use are:
- GIS may allow emergency planners to easily calculate emergency response times and the movement of response resources (for logistics) in the case of a natural disaster;
- GIS might be used to find wetlandWetlandA wetland is an area of land whose soil is saturated with water either permanently or seasonally. Wetlands are categorised by their characteristic vegetation, which is adapted to these unique soil conditions....
s that need protection strategies regarding pollutionPollutionPollution is the introduction of contaminants into a natural environment that causes instability, disorder, harm or discomfort to the ecosystem i.e. physical systems or living organisms. Pollution can take the form of chemical substances or energy, such as noise, heat or light...
; - GIS can be used by a company to site a new business location to take advantage of GIS data identified trends to respond to a previously under-served market. Most city and transportation systems planning offices have GIS sections; and
- GIS can be used to track the spread of emerging infectious disease threats. This allows for informed pandemic planning and enhanced preparedness.
- GIS can be used by utility integrity management personnel to determine high consequence areas in the event of catastrophic infrastructure or integrity failures within populated sensitive areas.
History of development
In 1854, John SnowJohn Snow (physician)
John Snow was an English physician and a leader in the adoption of anaesthesia and medical hygiene. He is considered to be one of the fathers of epidemiology, because of his work in tracing the source of a cholera outbreak in Soho, England, in 1854.-Early life and education:Snow was born 15 March...
depicted a cholera
Cholera
Cholera is an infection of the small intestine that is caused by the bacterium Vibrio cholerae. The main symptoms are profuse watery diarrhea and vomiting. Transmission occurs primarily by drinking or eating water or food that has been contaminated by the diarrhea of an infected person or the feces...
outbreak in London using points to represent the locations of some individual cases, possibly the earliest use of the geographic method. His study of the distribution of cholera led to the source of the disease, a contaminated water pump (the Broad Street Pump, whose handle he had disconnected, thus terminating the outbreak) within the heart of the cholera outbreak.
Topography
Topography is the study of Earth's surface shape and features or those ofplanets, moons, and asteroids...
and theme existed previously in cartography
Cartography
Cartography is the study and practice of making maps. Combining science, aesthetics, and technique, cartography builds on the premise that reality can be modeled in ways that communicate spatial information effectively.The fundamental problems of traditional cartography are to:*Set the map's...
, the John Snow map was unique, using cartographic methods not only to depict but also to analyze clusters of geographically-dependent phenomena for the first time.
The early 20th century saw the development of photozincography
Photozincography
Photozincography, sometimes referred to as Heliozincography but essentially the same process, known commercially as zinco, is the photographic process developed by Sir Henry James FRS in the mid-nineteenth century....
, which allowed maps to be split into layers, for example one layer for vegetation and another for water. This was particularly used for printing contours – drawing these was a labour intensive task but having them on a separate layer meant they could be worked on without the other layers to confuse the draughtsman. This work was originally drawn on glass plates but later, plastic film was introduced, with the advantages of being lighter, using less storage space and being less brittle, among others. When all the layers were finished, they were combined into one image using a large process camera
Process camera
A process camera is a specialised form of camera used for mass reproduction of graphic materials. The original document was photographed and the negatives produced were used to produce printing plates - usually via some kind of process where the negative was put on top of the printing plate and...
. Once colour printing came in, the layers idea was also used for creating separate printing plates for each colour. While the use of layers much later became one of the main typical features of a contemporary GIS, the photographic process just described is not considered to be a GIS in itself – as the maps were just images with no database to link them to.
Computer hardware development spurred by nuclear weapon
Nuclear weapon
A nuclear weapon is an explosive device that derives its destructive force from nuclear reactions, either fission or a combination of fission and fusion. Both reactions release vast quantities of energy from relatively small amounts of matter. The first fission bomb test released the same amount...
research led to general-purpose computer 'mapping' applications by the early 1960s.
The year 1960 saw the development of the world's first true operational GIS in Ottawa, Ontario, Canada by the federal Department of Forestry and Rural Development. Developed by Dr. Roger Tomlinson
Roger Tomlinson
Roger F. Tomlinson, CM is an English geographer and the primary originator of modern computerized Geographic Information Systems , and has been acknowledged as the "father of GIS".Dr...
, it was called the Canada Geographic Information System (CGIS) and was used to store, analyze, and manipulate data collected for the Canada Land Inventory
Canada Land Inventory
The Canada Land Inventory is a multi-disciplinary land inventory of rural Canada.Conceptualized in the early 1960s by the Department of Forestry and Rural Development , the CLI was a federal-provincial project that lasted from 1963 to 1995 and produced maps which indicated the capability of land...
(CLI) – an effort to determine the land capability for rural Canada by mapping information about soils, agriculture, recreation, wildlife, waterfowl, forestry and land use at a scale of 1:50,000. A rating classification factor was also added to permit analysis.
CGIS was an improvement over 'computer mapping' applications as it provided capabilities for overlay, measurement and digitizing
Digitizing
Digitizing or digitization is the representation of an object, image, sound, document or a signal by a discrete set of its points or samples. The result is called digital representation or, more specifically, a digital image, for the object, and digital form, for the signal...
/scanning. It supported a national coordinate system that spanned the continent, coded lines as arcs
ARCS
ARCS is a firmware bootloader used in most computers produced by SGI since the beginning of the 1990s.The ARCS system is loosely compliant with the Advanced RISC Computing standard, promulgated by the Advanced Computing Environment consortium in the early 1990s...
having a true embedded topology and it stored the attribute and locational information in separate files. As a result of this, Tomlinson has become known as the 'father of GIS', particularly for his use of overlays in promoting the spatial analysis of convergent geographic data.
CGIS lasted into the 1990s and built a large digital land resource database in Canada. It was developed as a mainframe
Mainframe computer
Mainframes are powerful computers used primarily by corporate and governmental organizations for critical applications, bulk data processing such as census, industry and consumer statistics, enterprise resource planning, and financial transaction processing.The term originally referred to the...
-based system in support of federal and provincial resource planning and management. Its strength was continent-wide analysis of complex dataset
Data set
A data set is a collection of data, usually presented in tabular form. Each column represents a particular variable. Each row corresponds to a given member of the data set in question. Its values for each of the variables, such as height and weight of an object or values of random numbers. Each...
s. The CGIS was never available in a commercial form.
In 1964, Howard T. Fisher formed the Laboratory for Computer Graphics and Spatial Analysis at the Harvard Graduate School of Design (LCGSA 1965–1991), where a number of important theoretical concepts in spatial data handling were developed, and which by the 1970s had distributed seminal software code and systems, such as 'SYMAP', 'GRID' and 'ODYSSEY' – that served as sources for subsequent commercial development—to universities, research centers and corporations worldwide.
By the early 1980s, M&S Computing (later Intergraph
Intergraph
Intergraph Corporation is an American software development and services company. It provides enterprise engineering and geospatially powered software to businesses, governments, and organizations around the world. Intergraph operates through two divisions: Process, Power & Marine and Security,...
)along with Bentley Systems Incorporated for the CAD platform, Environmental Systems Research Institute (ESRI
ESRI
Esri is a software development and services company providing Geographic Information System software and geodatabase management applications. The headquarters of Esri is in Redlands, California....
), CARIS
CARIS
CARIS is a software company that develops and supports geomatics software for land and marine applications.The company was founded in Fredericton, New Brunswick, Canada in 1979 as Universal Systems Ltd...
(Computer Aided Resource Information System) and ERDAS (Earth Resource Data Analysis System) emerged as commercial vendors of GIS software, successfully incorporating many of the CGIS features, combining the first generation approach to separation of spatial and attribute information with a second generation approach to organizing attribute data into database structures.
In parallel, the development of two public domain systems began in the late 1970s and early 1980s.
The Map Overlay and Statistical System (MOSS
Map Overlay and Statistical System
The Map Overlay and Statistical System , is a GIS software technology. Development of MOSS began in late 1977 and was first deployed for use in 1979. MOSS represents a very early public domain, open source GIS development - predating the better known GRASS by 5 years...
) project started in 1977 in Fort Collins, Colorado under the auspices of the Western Energy and Land Use Team (WELUT) and the US Fish and Wildlife Service. GRASS GIS
GRASS GIS
GRASS GIS is a free, open source geographical information system capable of handling raster, topological vector, image processing, and graphic data....
was introduced in 1982 by the US Army Corps of Engineering Research Laboratory (USA-CERL) in Champaign, Illinois, a branch of the US Army Corps of Engineers to meet the need of the US military for software for land management and environmental planning.
In the later 1980s and 1990s, industry growth was spurred on by the growing use of GIS on Unix
Unix
Unix is a multitasking, multi-user computer operating system originally developed in 1969 by a group of AT&T employees at Bell Labs, including Ken Thompson, Dennis Ritchie, Brian Kernighan, Douglas McIlroy, and Joe Ossanna...
workstations and the personal computer. By the end of the 20th century, the rapid growth in various systems had been consolidated and standardized on relatively few platforms and users were beginning to explore the concept of viewing GIS data over the Internet
Internet
The Internet is a global system of interconnected computer networks that use the standard Internet protocol suite to serve billions of users worldwide...
, requiring data format and transfer standards. More recently, a growing number of free, open-source GIS packages run on a range of operating systems and can be customized to perform specific tasks. Increasingly geospatial data
Geospatial
Geospatial analysis is an approach to applying statistical analysis and other informational techniques to geographically based data. Such analysis employs spatial software and analytical methods with terrestrial or geographic datasets, including geographic information systems and...
and mapping applications
Web mapping
Web mapping is the process of designing, implementing, generating and delivering maps on the World Wide Web and its product. While web mapping primarily deals with technological issues, web cartography additionally studies theoretic aspects: the use of web maps, the evaluation and optimization of...
are being made available via the world wide web
World Wide Web
The World Wide Web is a system of interlinked hypertext documents accessed via the Internet...
.
Several authoritative books on the history of GIS have been published.
GIS techniques and technology
Modern GIS technologies use digital information, for which various digitized data creation methods are used. The most common method of data creation is digitization, where a hard copy map or survey plan is transferred into a digital medium through the use of a computer-aided designComputer-aided design
Computer-aided design , also known as computer-aided design and drafting , is the use of computer technology for the process of design and design-documentation. Computer Aided Drafting describes the process of drafting with a computer...
(CAD) program, and geo-referencing capabilities. With the wide availability of ortho-rectified imagery
Orthophoto
An orthophoto, orthophotograph or orthoimage is an aerial photograph geometrically corrected such that the scale is uniform: the photo has the same lack of distortion as a map...
(both from satellite and aerial sources), heads-up digitizing is becoming the main avenue through which geographic data is extracted. Heads-up digitizing involves the tracing of geographic data directly on top of the aerial imagery instead of by the traditional method of tracing the geographic form on a separate digitizing tablet
Graphics tablet
A graphics tablet is a computer input device that enables a user to hand-draw images and graphics, similar to the way a person draws images with a pencil and paper. These tablets may also be used to capture data or handwritten signatures...
(heads-down digitizing).
Relating information from different sources
GIS uses spatio-temporal (space-time) location as the key index variable for all other information. Just as a relational database containing text or numbers can relate many different tables using common key index variables, GIS can relate otherwise unrelated information by using location as the key index variable. The key is the location and/or extent in space-time.Any variable that can be located spatially, and increasingly also temporally, can be referenced using a GIS. Locations or extents in Earth space–time may be recorded as dates/times of occurrence, and x, y, and z coordinates representing, longitude
Longitude
Longitude is a geographic coordinate that specifies the east-west position of a point on the Earth's surface. It is an angular measurement, usually expressed in degrees, minutes and seconds, and denoted by the Greek letter lambda ....
, latitude
Latitude
In geography, the latitude of a location on the Earth is the angular distance of that location south or north of the Equator. The latitude is an angle, and is usually measured in degrees . The equator has a latitude of 0°, the North pole has a latitude of 90° north , and the South pole has a...
, and elevation, respectively. These GIS coordinates may represent other quantified systems of temporo-spatial reference (for example, film frame number, stream gage station, highway mile-marker, surveyor benchmark, building address, street intersection, entrance gate, water depth sounding, POS
Point of sale
Point of sale or checkout is the location where a transaction occurs...
or CAD drawing origin/units). Units applied to recorded temporal-spatial data can vary widely (even when using exactly the same data, see map projection
Map projection
A map projection is any method of representing the surface of a sphere or other three-dimensional body on a plane. Map projections are necessary for creating maps. All map projections distort the surface in some fashion...
s), but all Earth-based spatial–temporal location and extent references should, ideally, be relatable to one another and ultimately to a "real" physical location or extent in space–time.
Related by accurate spatial information, an incredible variety of real-world and projected past or future data can be analyzed, interpreted and represented to facilitate education and decision making
Decision making
Decision making can be regarded as the mental processes resulting in the selection of a course of action among several alternative scenarios. Every decision making process produces a final choice. The output can be an action or an opinion of choice.- Overview :Human performance in decision terms...
. This key characteristic of GIS has begun to open new avenues of scientific inquiry into behaviors and patterns of previously considered unrelated real-world information.
GIS uncertainties
GIS accuracy depends upon source data, and how it is encoded to be data referenced. Land surveyors have been able to provide a high level of positional accuracy utilizing the GPS derived positions. [Retrieved from Federal Geographic Data Committee] the high-resolution digital terrain and aerial imagery, [Retrieved NJGIN] the powerful computers, Web technology, are changing the quality, utility, and expectations of GIS to serve society on a grand scale, but nevertheless there are other source data that has an impact on the overall GIS accuracy like: paper maps that are not found to be very suitable to achieve the desired accuracy since the aging of maps affects their dimensional stability.In developing a digital topographic data base for a GIS, topographical maps are the main source of data. Aerial photography and satellite images are extra sources for collecting data and identifying attributes which can be mapped in layers over a location facsimile of scale. The scale of a map and geographical rendering area representation type are very important aspects since the information content depends mainly on the scale set and resulting locatability of the map's representations. In order to digitize a map, the map has to be checked within theoretical dimensions, then scanned into a raster format, and resulting raster data has to be given a theoretical dimension by a rubber sheeting/warping technology process.
Uncertainty is a significant problem in designing a GIS because spatial data tend to be used for purposes for which they were never intended. Some maps were made many decades ago, where at that time the computer industry was not even in its perspective establishments. This has led to historical reference maps without common norms. Map accuracy is a relative issue of minor importance in cartography. All maps are established for communication ends. Maps use a historically constrained technology of pen and paper to communicate a view of the world to their users. Cartographers feel little need to communicate information based on accuracy, for when the same map is digitized and input into a GIS, the mode of use often changes. The new uses extend well beyond a determined domain for which the original map was intended and designed.
A quantitative analysis of maps brings accuracy issues into focus. The electronic and other equipment used to make measurements for GIS is far more precise than the machines of conventional map analysis. [Retrieved USGS]. The truth is that all geographical data are inherently inaccurate, and these inaccuracies will propagate through GIS operations in ways that are difficult to predict, yet have goals of conveyance in mind for original design.
Accuracy Standards for 1:24000 Scales Map: 1:24,000 ± 40.00 feet
This means that when we see a point or attribute on a map, its "probable" location is within a +/- 40 foot area of its rendered reference, according to area representations and scale.
A GIS can also convert existing digital information, which may not yet be in map form, into forms it can recognize, employ for its data analysis processes, and use in forming mapping output. For example, digital satellite images generated through remote sensing
Remote sensing
Remote sensing is the acquisition of information about an object or phenomenon, without making physical contact with the object. In modern usage, the term generally refers to the use of aerial sensor technologies to detect and classify objects on Earth by means of propagated signals Remote sensing...
can be analyzed to produce a map-like layer of digital information about vegetative covers on land locations. Another fairly recently developed resource for naming GIS location objects is the Getty Thesaurus of Geographic Names
Getty Thesaurus of Geographic Names
The Getty Thesaurus of Geographic Names is a product of the J. Paul Getty Trust included in the Getty Vocabulary Program. The TGN includes names and associated information about places. Places in TGN include administrative political entities and physical features . Current and historical places...
(GTGN), which is a structured vocabulary containing about 1,000,000 names and other information about places.
Likewise, researched census or hydrological tabular data can be displayed in map-like form, serving as layers of thematic information for forming a GIS map.
Data representation
GIS data represents real objects (such as roads, land use, elevation, trees, waterways, etc.) with digital data determining the mix. Real objects can be divided into two abstractions: discrete objects (e.g., a house) and continuous fields (such as rainfall amount, or elevations). Traditionally, there are two broad methods used to store data in a GIS for both kinds of abstractions mapping references: raster images and vectorVector graphics
Vector graphics is the use of geometrical primitives such as points, lines, curves, and shapes or polygon, which are all based on mathematical expressions, to represent images in computer graphics...
. Points, lines, and polygons are the stuff of mapped location attribute references. A new hybrid method of storing data is that of identifying point clouds, which combine three-dimensional points with RGB information at each point, returning a "3D color image". GIS Thematic maps then are becoming more and more realistically visually descriptive of what they set out to show or determine.
Raster
A raster data type is, in essence, any type of digital image represented by reducible and enlargeable grids. Anyone who is familiar with digital photography will recognize the Raster graphics pixel as the smallest individual grid unit building block of an image, usually not readily identified as an artifact shape until an image is produced on a very large scale. A combination of the pixels making up an image color formation scheme will compose details of an image, as is distinct from the commonly used points, lines, and polygon area location symbols of scalable vector graphicsScalable Vector Graphics
Scalable Vector Graphics is a family of specifications of an XML-based file format for describing two-dimensional vector graphics, both static and dynamic . The SVG specification is an open standard that has been under development by the World Wide Web Consortium since 1999.SVG images and their...
as the basis of the vector model of area attribute rendering. While a digital image is concerned with its output blending together its grid based details as an identifiable representation of reality, in a photograph or art image transferred into a computer, the raster data type will reflect a digitized abstraction of reality dealt with by grid populating tones or objects, quantities, cojoined or open boundaries, and map relief schemas. Aerial photos are one commonly used form of raster data, with one primary purpose in mind: to display a detailed image on a map area, or for the purposes of rendering its identifiable objects by digitization. Additional raster data sets used by a GIS will contain information regarding elevation, a digital elevation model
Digital elevation model
A digital elevation model is a digital model or 3-D representation of a terrain's surface — commonly for a planet , moon, or asteroid — created from terrain elevation data....
, or reflectance of a particular wavelength of light, Landsat, or other electromagnetic spectrum indicators.
Raster graphics
In computer graphics, a raster graphics image, or bitmap, is a data structure representing a generally rectangular grid of pixels, or points of color, viewable via a monitor, paper, or other display medium...
images) with each pixel (or cell) containing a color value. Additional values recorded for each cell may be a discrete value, such as land use, a continuous value, such as temperature, or a null value if no data is available. While a raster cell stores a single value, it can be extended by using raster bands to represent RGB (red, green, blue) colors, colormaps (a mapping between a thematic code and RGB value), or an extended attribute table with one row for each unique cell value. The resolution of the raster data set is its cell width in ground units.
Raster data is stored in various formats; from a standard file-based structure of TIF, JPEG, etc. to binary large object
Binary large object
A blob is a collection of binary data stored as a single entity in a database management system. Blobs are typically images, audio or other multimedia objects, though sometimes binary executable code is stored as a blob...
(BLOB) data stored directly in a relational database management system
Relational database management system
A relational database management system is a database management system that is based on the relational model as introduced by E. F. Codd. Most popular databases currently in use are based on the relational database model....
(RDBMS) similar to other vector-based feature classes. Database storage, when properly indexed, typically allows for quicker retrieval of the raster data but can require storage of millions of significantly sized records.
Vector
In a GIS, geographical features are often expressed as vectors, by considering those features as geometrical shapes. Different geographical features are expressed by different types of geometry:- PointsPoint (geometry)In geometry, topology and related branches of mathematics a spatial point is a primitive notion upon which other concepts may be defined. In geometry, points are zero-dimensional; i.e., they do not have volume, area, length, or any other higher-dimensional analogue. In branches of mathematics...
- Zero-dimensional points are used for geographical features that can best be expressed by a single point reference—in other words, by simple location. Examples include wells, peaks, features of interest, and trailheads. Points convey the least amount of information of these file types. Points can also be used to represent areas when displayed at a small scale. For example, cities on a map of the world might be represented by points rather than polygons. No measurements are possible with point features.
- LineLine (geometry)The notion of line or straight line was introduced by the ancient mathematicians to represent straight objects with negligible width and depth. Lines are an idealization of such objects...
s or polylines
- Line
- One-dimensional lines or polylines are used for linear features such as rivers, roads, railroads, trails, and topographic lines. Again, as with point features, linear features displayed at a small scale will be represented as linear features rather than as a polygon. Line features can measure distance.
- PolygonPolygonIn geometry a polygon is a flat shape consisting of straight lines that are joined to form a closed chain orcircuit.A polygon is traditionally a plane figure that is bounded by a closed path, composed of a finite sequence of straight line segments...
s
- Polygon
- Two-dimensional polygons are used for geographical features that cover a particular area of the earth's surface. Such features may include lakes, park boundaries, buildings, city boundaries, or land uses. Polygons convey the most amount of information of the file types. Polygon features can measure perimeter and area.
Each of these geometries are linked to a row in a database that describes their attributes. For example, a database that describes lakes may contain a lake's depth, water quality, pollution level. This information can be used to make a map to describe a particular attribute of the dataset. For example, lakes could be coloured depending on level of pollution. Different geometries can also be compared. For example, the GIS could be used to identify all wells (point geometry) that are within one kilometre of a lake (polygon geometry) that has a high level of pollution.
Vector features can be made to respect spatial integrity through the application of topology rules such as 'polygons must not overlap'. Vector data can also be used to represent continuously varying phenomena. Contour line
Contour line
A contour line of a function of two variables is a curve along which the function has a constant value. In cartography, a contour line joins points of equal elevation above a given level, such as mean sea level...
s and triangulated irregular network
Triangulated irregular network
A triangulated irregular network is a digital data structure used in a geographic information system for the representation of a surface...
s (TIN) are used to represent elevation or other continuously changing values. TINs record values at point locations, which are connected by lines to form an irregular mesh of triangles. The face of the triangles represent the terrain surface.
Advantages and disadvantages
There are some important advantages and disadvantages to using a raster or vector data model to represent reality:- Raster datasets record a value for all points in the area covered which may require more storage space than representing data in a vector format that can store data only where needed.
- Raster data is computationally less expensive to render than vector graphics
- There are transparency and aliasing problems when overlaying multiple stacked pieces of raster images
- Vector data allows for visually smooth and easy implementation of overlay operations, especially in terms of graphics and shape-driven information like maps, routes and custom fonts, which are more difficult with raster data.
- Vector data can be displayed as vector graphicsVector graphicsVector graphics is the use of geometrical primitives such as points, lines, curves, and shapes or polygon, which are all based on mathematical expressions, to represent images in computer graphics...
used on traditional maps, whereas raster data will appear as an imageImageAn image is an artifact, for example a two-dimensional picture, that has a similar appearance to some subject—usually a physical object or a person.-Characteristics:...
that may have a blocky appearance for object boundaries. (depending on the resolution of the raster file) - Vector data can be easier to register, scale, and re-project, which can simplify combining vector layers from different sources.
- Vector data is more compatible with relational database environments, where they can be part of a relational table as a normal column and processed using a multitude of operators.
- Vector file sizes are usually smaller than raster data, which can be tens, hundreds or more times larger than vector data (depending on resolution).
- Vector data is simpler to update and maintain, whereas a raster image will have to be completely reproduced. (Example: a new road is added).
- Vector data allows much more analysis capability, especially for "networks" such as roads, power, rail, telecommunications, etc. (Examples: Best route, largest port, airfields connected to two-lane highways). Raster data will not have all the characteristics of the features it displays.
Non-spatial data
Additional non-spatial data can also be stored along with the spatial data represented by the coordinates of a vector geometry or the position of a raster cell. In vector data, the additional data contains attributes of the feature. For example, a forest inventory polygon may also have an identifier value and information about tree species. In raster data the cell value can store attribute information, but it can also be used as an identifier that can relate to recordsRecord (computer science)
In computer science, a record is an instance of a product of primitive data types called a tuple. In C it is the compound data in a struct. Records are among the simplest data structures. A record is a value that contains other values, typically in fixed number and sequence and typically indexed...
in another table.
Software is currently being developed to support spatial and non-spatial decision-making, with the solutions to spatial problems being integrated with solutions to non-spatial problems. The end result with these flexible spatial decision-making support systems (FSDSSs) is expected to be that non-experts will be able to use GIS, along with spatial criteria, and simply integrate their non-spatial criteria to view solutions to multi-criteria problems. This system is intended to assist decision-making.
Data capture
Data capture—entering information into the system—consumes much of the time of GIS practitioners. There are a variety of methods used to enter data into a GIS where it is stored in a digital format.Existing data printed on paper or PET film
PET film (biaxially oriented)
BoPET is a polyester film made from stretched polyethylene terephthalate and is used for its high tensile strength, chemical and dimensional stability, transparency, reflectivity, gas and aroma barrier properties and electrical insulation.A variety of companies manufacture boPET and other...
maps can be digitized or scanned to produce digital data. A digitizer produces vector data as an operator traces points, lines, and polygon boundaries from a map. Scanning
Image scanner
In computing, an image scanner—often abbreviated to just scanner—is a device that optically scans images, printed text, handwriting, or an object, and converts it to a digital image. Common examples found in offices are variations of the desktop scanner where the document is placed on a glass...
a map results in raster data that could be further processed to produce vector data.
Survey
Surveying
See Also: Public Land Survey SystemSurveying or land surveying is the technique, profession, and science of accurately determining the terrestrial or three-dimensional position of points and the distances and angles between them...
data can be directly entered into a GIS from digital data collection systems on survey instruments using a technique called coordinate geometry (COGO)
Analytic geometry
Analytic geometry, or analytical geometry has two different meanings in mathematics. The modern and advanced meaning refers to the geometry of analytic varieties...
. Positions from a global navigation satellite system (GNSS) like Global Positioning System
Global Positioning System
The Global Positioning System is a space-based global navigation satellite system that provides location and time information in all weather, anywhere on or near the Earth, where there is an unobstructed line of sight to four or more GPS satellites...
(GPS), another survey tool, can also be collected and then imported into a GIS. A current trend in data collection gives users the ability to utilize field computers
Rugged computer
A rugged computer is a computer specifically designed to reliably operate in harsh usage environments and conditions, such as strong vibrations, extreme temperatures and wet or dusty conditions...
with the ability to edit live data using wireless connections or disconnected editing sessions. This has been enhanced by the availability of low cost mapping grade GPS units with decimeter accuracy in real time. This eliminates the need to post process, import, and update the data in the office after fieldwork has been collected. This includes the ability to incorporate positions collected using a laser rangefinder. New technologies also allow users to create maps as well as analysis directly in the field, making projects more efficient and mapping more accurate.
Remotely sensed
Remote sensing
Remote sensing is the acquisition of information about an object or phenomenon, without making physical contact with the object. In modern usage, the term generally refers to the use of aerial sensor technologies to detect and classify objects on Earth by means of propagated signals Remote sensing...
data also plays an important role in data collection and consist of sensors attached to a platform. Sensors include cameras, digital scanners and LIDAR
LIDAR
LIDAR is an optical remote sensing technology that can measure the distance to, or other properties of a target by illuminating the target with light, often using pulses from a laser...
, while platforms usually consist of aircraft and satellite
Satellite
In the context of spaceflight, a satellite is an object which has been placed into orbit by human endeavour. Such objects are sometimes called artificial satellites to distinguish them from natural satellites such as the Moon....
s. Recently with the development of Miniature UAVs, aerial data collection is becoming possible at much lower costs, and on a more frequent basis. For example, the Aeryon Scout was used to map a 50 acre area with a Ground sample distance
Ground sample distance
In remote sensing, ground sample distance in a digital photo of the ground from air or space is the distance between pixel centers measured on the ground. For example, in an image with a one-meter GSD, adjacent pixels image locations that are 1 meter apart on the ground...
of 1 inch in only 12 minutes.
The majority of digital data currently comes from photo interpretation of aerial photographs. Soft-copy workstations are used to digitize features directly from stereo pairs
Stereoscopy
Stereoscopy refers to a technique for creating or enhancing the illusion of depth in an image by presenting two offset images separately to the left and right eye of the viewer. Both of these 2-D offset images are then combined in the brain to give the perception of 3-D depth...
of digital photographs. These systems allow data to be captured in two and three dimensions, with elevations measured directly from a stereo pair using principles of photogrammetry
Photogrammetry
Photogrammetry is the practice of determining the geometric properties of objects from photographic images. Photogrammetry is as old as modern photography and can be dated to the mid-nineteenth century....
. Currently, analog aerial photos are scanned before being entered into a soft-copy system, but as high quality digital cameras become cheaper this step will be skipped.
Satellite remote sensing provides another important source of spatial data. Here satellites use different sensor packages to passively measure the reflectance from parts of the electromagnetic spectrum
Electromagnetic spectrum
The electromagnetic spectrum is the range of all possible frequencies of electromagnetic radiation. The "electromagnetic spectrum" of an object is the characteristic distribution of electromagnetic radiation emitted or absorbed by that particular object....
or radio waves that were sent out from an active sensor such as radar. Remote sensing collects raster data that can be further processed using different bands to identify objects and classes of interest, such as land cover.
When data is captured, the user should consider if the data should be captured with either a relative accuracy or absolute accuracy, since this could not only influence how information will be interpreted but also the cost of data capture.
In addition to collecting and entering spatial data, attribute data is also entered into a GIS. For vector data, this includes additional information about the objects represented in the system.
After entering data into a GIS, the data usually requires editing, to remove errors, or further processing. For vector data it must be made "topologically correct" before it can be used for some advanced analysis. For example, in a road network, lines must connect with nodes at an intersection. Errors such as undershoots and overshoots must also be removed. For scanned maps, blemishes on the source map may need to be removed from the resulting raster. For example, a fleck of dirt might connect two lines that should not be connected.
Raster-to-vector translation
Data restructuring can be performed by a GIS to convert data into different formats. For example, a GIS may be used to convert a satellite image map to a vector structure by generating lines around all cells with the same classification, while determining the cell spatial relationships, such as adjacency or inclusion.More advanced data processing can occur with image processing
Image processing
In electrical engineering and computer science, image processing is any form of signal processing for which the input is an image, such as a photograph or video frame; the output of image processing may be either an image or, a set of characteristics or parameters related to the image...
, a technique developed in the late 1960s by NASA
NASA
The National Aeronautics and Space Administration is the agency of the United States government that is responsible for the nation's civilian space program and for aeronautics and aerospace research...
and the private sector to provide contrast enhancement, false colour rendering and a variety of other techniques including use of two dimensional Fourier transforms.
Since digital data is collected and stored in various ways, the two data sources may not be entirely compatible. So a GIS must be able to convert geographic data
Geographic data
Geographic data is about much more than electronic pictures of maps.The geographic data that describes our world allows for city planning, flood prediction and relief, emergency service routing, environmental assessments, wind pattern monitoring and many other applications.Geographic data is...
from one structure to another.
Projections, coordinate systems and registration
A property ownership map and a soils map might show data at different scales. Map information in a GIS must be manipulated so that it registers, or fits, with information gathered from other maps. Before the digital data can be analyzed, they may have to undergo other manipulations—projection and coordinate conversions, for example—that integrate them into a GIS.The earth can be represented by various models, each of which may provide a different set of coordinates (e.g., latitude, longitude, elevation) for any given point on the Earth's surface. The simplest model is to assume the earth is a perfect sphere. As more measurements of the earth have accumulated, the models of the earth have become more sophisticated and more accurate. In fact, there are models that apply to different areas of the earth to provide increased accuracy (e.g., North American Datum, 1927 – NAD27 – works well in North America, but not in Europe). See datum (geodesy) for more information.
Projection is a fundamental component of map making. A projection
Map projection
A map projection is any method of representing the surface of a sphere or other three-dimensional body on a plane. Map projections are necessary for creating maps. All map projections distort the surface in some fashion...
is a mathematical means of transferring information from a model of the Earth, which represents a three-dimensional curved surface, to a two-dimensional medium—paper or a computer screen. Different projections are used for different types of maps because each projection particularly suits specific uses. For example, a projection that accurately represents the shapes of the continents will distort their relative sizes. See Map projection
Map projection
A map projection is any method of representing the surface of a sphere or other three-dimensional body on a plane. Map projections are necessary for creating maps. All map projections distort the surface in some fashion...
for more information.
Since much of the information in a GIS comes from existing maps, a GIS uses the processing power of the computer to transform digital information, gathered from sources with different projections and/or different coordinate systems, to a common projection and coordinate system. For images, this process is called rectification
Image rectification
Image rectification is a transformation process used to project two-or-more images onto a common image plane. It corrects image distortion by transforming the image into a standard coordinate system....
.
Spatial analysis with GIS
Given the vast range of spatial analysis techniques that have been developed over the past half century, any summary or review can only cover the subject to a limited depth. This is a rapidly changing field, and GIS packages are increasingly including analytical tools as standard built-in facilities or as optional toolsets, add-ins or 'analysts'. In many instances such facilities are provided by the original software suppliers (commercial vendors or collaborative non commercial development teams), whilst in other cases facilities have been developed and are provided by third parties. Furthermore, many products offer software development kits (SDKs), programming languages and language support, scripting facilities and/or special interfaces for developing one's own analytical tools or variants. The website Geospatial Analysis and associated book/ebook attempt to provide a reasonably comprehensive guide to the subject. The impact of these myriad paths to perform spatial analysis create a new dimension to business intelligence termed "spatial intelligenceSpatial intelligence
Spatial Intelligence is an area in the theory of multiple intelligences that deals with spatial judgment and the ability to visualize with the mind's eye...
" which, when delivered via intranet, democratizes access to operational sorts not usually privy to this type of information.
Slope and aspect
Slope, aspect and surface curvature in terrain analysis are all derived from neighbourhood operations using elevation values of a cell's adjacent neighbours. Authors such as Skidmore, Jones and Zhou and Liu have compared techniques for calculating slope and aspect. Slope is a function of resolution, and the spatial resolution used to calculate slope and aspect should always be specifiedThe elevation at a point will have perpendicular tangents (slope) passing through the point, in an east-west and north-south direction.
These two tangents give two components, ∂z/∂x and ∂z/∂y, which then be used to determine the overall direction of slope, and the aspect of the slope. The gradient is defined as a vector quantity with components equal to the partial derivatives of the surface in the x and y directions.
The calculation of the overall 3x3 grid slope and aspect for methods that determine east-west and north-south component use the following formulas respectively:
Zhou and Liu describe another algorithm for calculating aspect, as follows:
Data analysis
It is difficult to relate wetlands maps to rainfall amounts recorded at different points such as airports, television stations, and high schools. A GIS, however, can be used to depict two- and three-dimensional characteristics of the Earth's surface, subsurface, and atmosphere from information points. For example, a GIS can quickly generate a map with isopleth or contour lineContour line
A contour line of a function of two variables is a curve along which the function has a constant value. In cartography, a contour line joins points of equal elevation above a given level, such as mean sea level...
s that indicate differing amounts of rainfall.
Such a map can be thought of as a rainfall contour map. Many sophisticated methods can estimate the characteristics of surfaces from a limited number of point measurements. A two-dimensional contour map created from the surface modeling of rainfall point measurements may be overlaid and analyzed with any other map in a GIS covering the same area.
Additionally, from a series of three-dimensional points, or digital elevation model, isopleth lines representing elevation contours can be generated, along with slope analysis, shaded relief, and other elevation products. Watersheds can be easily defined for any given reach, by computing all of the areas contiguous and uphill from any given point of interest. Similarly, an expected thalweg
Thalweg
Thalweg in geography and fluvial geomorphology signifies the deepest continuous inline within a valley or watercourse system.-Hydrology:In hydrological and fluvial landforms, the thalweg is a line drawn to join the lowest points along the entire length of a stream bed or valley in its downward...
of where surface water would want to travel in intermittent and permanent streams can be computed from elevation data in the GIS.
Topological modeling
A GIS can recognize and analyze the spatial relationships that exist within digitally stored spatial data. These topological relationships allow complex spatial modelling and analysis to be performed. Topological relationships between geometric entities traditionally include adjacency (what adjoins what), containment (what encloses what), and proximity (how close something is to something else).Networks
Geometric networksGeometric networks
A geometric network is an object commonly used in geographic information systems to model a series of interconnected features. A geometric network is similar to a graph in mathematics and computer science, and can be described and analyzed using theories and concepts similar to graph theory...
are linear networks of objects that can be used to represent interconnected features, and to perform special spatial analysis on them. A geometric network is composed of edges, which are connected at junction points, similar to graphs
Graph (mathematics)
In mathematics, a graph is an abstract representation of a set of objects where some pairs of the objects are connected by links. The interconnected objects are represented by mathematical abstractions called vertices, and the links that connect some pairs of vertices are called edges...
in mathematics and computer science. Just like graphs, networks can have weight and flow assigned to its edges, which can be used to represent various interconnected features more accurately. Geometric networks are often used to model road networks and public utility networks, such as electric, gas, and water networks. Network modeling is also commonly employed in transportation planning
Transportation planning
Transportation planning is a field involved with the evaluation, assessment, design and siting of transportation facilities .-Models and Sustainability :...
, hydrology
Hydrology
Hydrology is the study of the movement, distribution, and quality of water on Earth and other planets, including the hydrologic cycle, water resources and environmental watershed sustainability...
modeling, and infrastructure
Infrastructure
Infrastructure is basic physical and organizational structures needed for the operation of a society or enterprise, or the services and facilities necessary for an economy to function...
modeling.
Hydrological Modeling
GIS hydrological models can provide a spatial element that other hydrological models lack, with the analysis of variables such as slope, aspect and watershed or catchment area. Terrain analysis is fundamental to hydrology, since water always flows down a slope. As basic terrain analysis of a digital elevation model (DEM)Digital elevation model
A digital elevation model is a digital model or 3-D representation of a terrain's surface — commonly for a planet , moon, or asteroid — created from terrain elevation data....
involves calculation of slope and aspect, DEMs are very useful for hydrological analysis. Slope and aspect can then be used to determine direction of surface runoff, and hence flow accumulation for the formation of streams, rivers and lakes. Areas of divergent flow can also give a clear indication of the boundaries of a catchment. Once a flow direction and accumulation matrix has been created, queries can be performed that show contributing or dispersal areas at a certain point. More detail can be added to the model, such as terrain roughness, vegetation types and soil types, which can influence infiltration and evapotranspiration rates, and hence influencing surface flow. These extra layers of detail ensures a more accurate model. Also, check out GIS in Water Contamination and GIS in Environmental Contamination
GIS in environmental contamination
GIS in environmental contamination is the use of ArcGIS software in mapping out the contaminants in soil and water using the spatial interpolation tools from ArcGIS. Soil and water contamination by metals and other contaminants have become a major environmental problem after the industrialization...
.
Cartographic modeling
Map overlay
The combination of several spatial datasets (points, lines or polygons) creates a new output vector dataset, visually similar to stacking several maps of the same region. These overlays are similar to mathematical Venn diagramVenn diagram
Venn diagrams or set diagrams are diagrams that show all possible logical relations between a finite collection of sets . Venn diagrams were conceived around 1880 by John Venn...
overlays. A union
Union (set theory)
In set theory, the union of a collection of sets is the set of all distinct elements in the collection. The union of a collection of sets S_1, S_2, S_3, \dots , S_n\,\! gives a set S_1 \cup S_2 \cup S_3 \cup \dots \cup S_n.- Definition :...
overlay combines the geographic features and attribute tables of both inputs into a single new output. An intersect
Intersection (set theory)
In mathematics, the intersection of two sets A and B is the set that contains all elements of A that also belong to B , but no other elements....
overlay defines the area where both inputs overlap and retains a set of attribute fields for each. A symmetric difference
Symmetric difference
In mathematics, the symmetric difference of two sets is the set of elements which are in either of the sets and not in their intersection. The symmetric difference of the sets A and B is commonly denoted by A\,\Delta\,B\,orA \ominus B....
overlay defines an output area that includes the total area of both inputs except for the overlapping area.
Data extraction is a GIS process similar to vector overlay, though it can be used in either vector or raster data analysis. Rather than combining the properties and features of both datasets, data extraction involves using a "clip" or "mask" to extract the features of one data set that fall within the spatial extent of another dataset.
In raster data analysis, the overlay of datasets is accomplished through a process known as "local operation on multiple rasters" or "map algebra
Map algebra
Map algebra is a simple and an elegant set based algebra for manipulating geographic data, proposed by Dr. Dana Tomlin in the early 1980s.It is a set of primitive operations in a Geographic Information System which allows two or more raster layers of similar dimensions to produce a new raster...
," through a function that combines the values of each raster's matrix
Matrix (mathematics)
In mathematics, a matrix is a rectangular array of numbers, symbols, or expressions. The individual items in a matrix are called its elements or entries. An example of a matrix with six elements isMatrices of the same size can be added or subtracted element by element...
. This function may weigh some inputs more than others through use of an "index model" that reflects the influence of various factors upon a geographic phenomenon.
Automated cartography
Digital cartography and GIS both encode spatial relationships in structured formal representations. GIS is used in digital cartography modeling as a (semi)automated process of making maps, so called Automated Cartography. In practice, it can be a subset of a GIS, within which it is equivalent to the stage of visualizationGeovisualization
Geovisualization, short for Geographic Visualization, refers to a set of tools and techniques supporting geospatial data analysis through the use of interactive visualization....
, since in most cases not all of the GIS functionality is used. Cartographic products can be either in a digital or in a hardcopy format. Powerful analysis techniques with different data representation can produce high-quality maps within a short time period. The main problem in Automated Cartography is to use a single set of data to produce multiple products at a variety of scales, a technique known as cartographic generalization
Cartographic generalization
Cartographic generalization is the method whereby information is selected and represented on a map in a way that adapts to the scale of the display medium of the map, not necessarily preserving all intricate geographical or other cartographic details...
.
Geostatistics
GeostatisticsGeostatistics
Geostatistics is a branch of statistics focusing on spatial or spatiotemporal datasets. Developed originally to predict probability distributions of ore grades for mining operations, it is currently applied in diverse disciplines including petroleum geology, hydrogeology, hydrology, meteorology,...
is a point-pattern analysis that produces field predictions from data points. It is a way of looking at the statistical properties of those special data. It is different from general applications of statistics
Statistics
Statistics is the study of the collection, organization, analysis, and interpretation of data. It deals with all aspects of this, including the planning of data collection in terms of the design of surveys and experiments....
because it employs the use of graph theory
Graph theory
In mathematics and computer science, graph theory is the study of graphs, mathematical structures used to model pairwise relations between objects from a certain collection. A "graph" in this context refers to a collection of vertices or 'nodes' and a collection of edges that connect pairs of...
and matrix algebra
Matrix (mathematics)
In mathematics, a matrix is a rectangular array of numbers, symbols, or expressions. The individual items in a matrix are called its elements or entries. An example of a matrix with six elements isMatrices of the same size can be added or subtracted element by element...
to reduce the number of parameters in the data. Only the second-order properties of the GIS data are analyzed.
When phenomena are measured, the observation methods dictate the accuracy of any subsequent analysis. Due to the nature of the data (e.g. traffic patterns in an urban environment; weather patterns over the Pacific Ocean
Pacific Ocean
The Pacific Ocean is the largest of the Earth's oceanic divisions. It extends from the Arctic in the north to the Southern Ocean in the south, bounded by Asia and Australia in the west, and the Americas in the east.At 165.2 million square kilometres in area, this largest division of the World...
), a constant or dynamic degree of precision is always lost in the measurement. This loss of precision is determined from the scale and distribution of the data collection.
To determine the statistical relevance of the analysis, an average is determined so that points (gradients) outside of any immediate measurement can be included to determine their predicted behavior. This is due to the limitations of the applied statistic and data collection methods, and interpolation is required to predict the behavior of particles, points, and locations that are not directly measurable.
Interpolation
In the mathematical field of numerical analysis, interpolation is a method of constructing new data points within the range of a discrete set of known data points....
is the process by which a surface is created, usually a raster dataset, through the input of data collected at a number of sample points. There are several forms of interpolation, each which treats the data differently, depending on the properties of the data set. In comparing interpolation methods, the first consideration should be whether or not the source data will change (exact or approximate). Next is whether the method is subjective, a human interpretation, or objective. Then there is the nature of transitions between points: are they abrupt or gradual. Finally, there is whether a method is global (it uses the entire data set to form the model), or local where an algorithm is repeated for a small section of terrain.
Interpolation is a justified measurement because of a spatial autocorrelation principle that recognizes that data collected at any position will have a great similarity to, or influence of those locations within its immediate vicinity.
Digital elevation model
Digital elevation model
A digital elevation model is a digital model or 3-D representation of a terrain's surface — commonly for a planet , moon, or asteroid — created from terrain elevation data....
s (DEM), triangulated irregular network
Triangulated irregular network
A triangulated irregular network is a digital data structure used in a geographic information system for the representation of a surface...
s (TIN), edge finding algorithms, Thiessen polygons, Fourier analysis, (weighted) moving averages, inverse distance weighting
Inverse distance weighting
Inverse distance weighting is a method for multivariate interpolation, a process of assigning values to unknown points by using values from usually scattered set of known points...
, kriging
Kriging
Kriging is a group of geostatistical techniques to interpolate the value of a random field at an unobserved location from observations of its value at nearby locations....
, spline
Spline (mathematics)
In mathematics, a spline is a sufficiently smooth piecewise-polynomial function. In interpolating problems, spline interpolation is often preferred to polynomial interpolation because it yields similar results, even when using low-degree polynomials, while avoiding Runge's phenomenon for higher...
, and trend surface analysis
Trend estimation
Trend estimation is a statistical technique to aid interpretation of data. When a series of measurements of a process are treated as a time series, trend estimation can be used to make and justify statements about tendencies in the data...
are all mathematical methods to produce interpolative data.
Address geocoding
Geocoding is interpolating spatial locations (X,Y coordinates) from street addresses or any other spatially referenced data such as ZIP Codes, parcel lots and address locations. A reference theme is required to geocodeGeocoding
Geocoding is the process of finding associated geographic coordinates from other geographic data, such as street addresses, or zip codes...
individual addresses, such as a road centerline file with address ranges. The individual address locations have historically been interpolated, or estimated, by examining address ranges along a road segment. These are usually provided in the form of a table or database. The GIS will then place a dot approximately where that address belongs along the segment of centerline. For example, an address point of 500 will be at the midpoint of a line segment that starts with address 1 and ends with address 1000. Geocoding can also be applied against actual parcel data, typically from municipal tax maps. In this case, the result of the geocoding will be an actually positioned space as opposed to an interpolated point. This approach is being increasingly used to provide more precise location information.
There are several potentially dangerous caveats that are often overlooked when using interpolation. See the full entry for Geocoding
Geocoding
Geocoding is the process of finding associated geographic coordinates from other geographic data, such as street addresses, or zip codes...
for more information.
Various algorithms are used to help with address matching when the spellings of addresses differ. Address information that a particular entity or organization has data on, such as the post office, may not entirely match the reference theme. There could be variations in street name spelling, community name, etc. Consequently, the user generally has the ability to make matching criteria more stringent, or to relax those parameters so that more addresses will be mapped. Care must be taken to review the results so as not to map addresses incorrectly due to overzealous matching parameters.
Reverse geocoding
Reverse geocoding is the process of returning an estimated street address number as it relates to a given coordinate. For example, a user can click on a road centerline theme (thus providing a coordinate) and have information returned that reflects the estimated house number. This house number is interpolated from a range assigned to that road segment. If the user clicks at the midpoint of a segment that starts with address 1 and ends with 100, the returned value will be somewhere near 50. Note that reverse geocoding does not return actual addresses, only estimates of what should be there based on the predetermined range.Data output and cartography
CartographyCartography
Cartography is the study and practice of making maps. Combining science, aesthetics, and technique, cartography builds on the premise that reality can be modeled in ways that communicate spatial information effectively.The fundamental problems of traditional cartography are to:*Set the map's...
is the design and production of maps, or visual representations of spatial data. The vast majority of modern cartography is done with the help of computers, usually using a GIS but production quality cartography is also achieved by importing layers into a design program to refine it. Most GIS software gives the user substantial control over the appearance of the data.
Cartographic work serves two major functions:
First, it produces graphics on the screen or on paper that convey the results of analysis to the people who make decisions about resources. Wall maps and other graphics can be generated, allowing the viewer to visualize and thereby understand the results of analyses or simulations of potential events. Web Map Servers facilitate distribution of generated maps through web browsers using various implementations of web-based application programming interfaces (AJAX
Ajax
- Mythology :* Ajax , son of Telamon, ruler of Salamis and a hero in the Trojan War, also known as "Ajax the Great"* Ajax the Lesser, son of Oileus, ruler of Locris and the leader of the Locrian contingent during the Trojan War.- People :...
, Java, Flash
Adobe Flash
Adobe Flash is a multimedia platform used to add animation, video, and interactivity to web pages. Flash is frequently used for advertisements, games and flash animations for broadcast...
, etc.).
Second, other database information can be generated for further analysis or use. An example would be a list of all addresses within one mile (1.6 km) of a toxic spill.
Graphic display techniques
Traditional maps are abstractions of the real world, a sampling of important elements portrayed on a sheet of paper with symbols to represent physical objects. People who use maps must interpret these symbols. Topographic mapTopographic map
A topographic map is a type of map characterized by large-scale detail and quantitative representation of relief, usually using contour lines in modern mapping, but historically using a variety of methods. Traditional definitions require a topographic map to show both natural and man-made features...
s show the shape of land surface with contour line
Contour line
A contour line of a function of two variables is a curve along which the function has a constant value. In cartography, a contour line joins points of equal elevation above a given level, such as mean sea level...
s or with shaded relief
Cartographic relief depiction
Terrain or relief is an essential aspect of physical geography, and as such its portrayal presents a central problem in cartography, and more recently GIS and 3D Visualization....
.
Today, graphic display techniques such as shading
Shading
Shading refers to depicting depth perception in 3D models or illustrations by varying levels of darkness.-Drawing:Shading is a process used in drawing for depicting levels of darkness on paper by applying media more densely or with a darker shade for darker areas, and less densely or with a lighter...
based on altitude
Altitude
Altitude or height is defined based on the context in which it is used . As a general definition, altitude is a distance measurement, usually in the vertical or "up" direction, between a reference datum and a point or object. The reference datum also often varies according to the context...
in a GIS can make relationships among map elements visible, heightening one's ability to extract and analyze information. For example, two types of data were combined in a GIS to produce a perspective view of a portion of San Mateo County, California
California
California is a state located on the West Coast of the United States. It is by far the most populous U.S. state, and the third-largest by land area...
.
- The digital elevation modelDigital elevation modelA digital elevation model is a digital model or 3-D representation of a terrain's surface — commonly for a planet , moon, or asteroid — created from terrain elevation data....
, consisting of surface elevations recorded on a 30-meter horizontal grid, shows high elevations as white and low elevation as black. - The accompanying Landsat Thematic Mapper image shows a false-color infrared image looking down at the same area in 30-meter pixels, or picture elements, for the same coordinate points, pixel by pixel, as the elevation information.
A GIS was used to register and combine the two images to render
Rendering (computer graphics)
Rendering is the process of generating an image from a model , by means of computer programs. A scene file contains objects in a strictly defined language or data structure; it would contain geometry, viewpoint, texture, lighting, and shading information as a description of the virtual scene...
the three-dimensional perspective view looking down the San Andreas Fault
San Andreas Fault
The San Andreas Fault is a continental strike-slip fault that runs a length of roughly through California in the United States. The fault's motion is right-lateral strike-slip...
, using the Thematic Mapper image pixels, but shaded using the elevation of the landform
Landform
A landform or physical feature in the earth sciences and geology sub-fields, comprises a geomorphological unit, and is largely defined by its surface form and location in the landscape, as part of the terrain, and as such, is typically an element of topography...
s. The GIS display depends on the viewing point of the observer
Observation
Observation is either an activity of a living being, such as a human, consisting of receiving knowledge of the outside world through the senses, or the recording of data using scientific instruments. The term may also refer to any data collected during this activity...
and time of day of the display, to properly render the shadows created by the sun's rays at that latitude, longitude, and time of day.
An archeochrome is a new way of displaying spatial data. It is a thematic on a 3D map that is applied to a specific building or a part of a building. It is suited to the visual display of heat loss data.
Spatial ETL
Spatial ETLSpatial ETL
Spatial ETL tools provide the data processing functionality of traditional Extract, Transform, Load software, but with a primary focus on the ability to manage spatial data ....
tools provide the data processing functionality of traditional Extract, Transform, Load
Extract, transform, load
Extract, transform and load is a process in database usage and especially in data warehousing that involves:* Extracting data from outside sources* Transforming it to fit operational needs...
(ETL) software, but with a primary focus on the ability to manage spatial data. They provide GIS users with the ability to translate data between different standards and proprietary formats, whilst geometrically transforming the data en-route.
GIS developments
Business
A business is an organization engaged in the trade of goods, services, or both to consumers. Businesses are predominant in capitalist economies, where most of them are privately owned and administered to earn profit to increase the wealth of their owners. Businesses may also be not-for-profit...
, and industry
Industry
Industry refers to the production of an economic good or service within an economy.-Industrial sectors:There are four key industrial economic sectors: the primary sector, largely raw material extraction industries such as mining and farming; the secondary sector, involving refining, construction,...
, with applications including real estate
Real estate
In general use, esp. North American, 'real estate' is taken to mean "Property consisting of land and the buildings on it, along with its natural resources such as crops, minerals, or water; immovable property of this nature; an interest vested in this; an item of real property; buildings or...
, public health
Public health
Public health is "the science and art of preventing disease, prolonging life and promoting health through the organized efforts and informed choices of society, organizations, public and private, communities and individuals" . It is concerned with threats to health based on population health...
, crime mapping
Crime mapping
Crime mapping is used by analysts in law enforcement agencies to map, visualize, and analyze crime incident patterns. It is a key component of crime analysis and the CompStat policing strategy...
, national defense
Defense (military)
Defense has several uses in the sphere of military application.Personal defense implies measures taken by individual soldiers in protecting themselves whether by use of protective materials such as armor, or field construction of trenches or a bunker, or by using weapons that prevent the enemy...
, sustainable development
Sustainable development
Sustainable development is a pattern of resource use, that aims to meet human needs while preserving the environment so that these needs can be met not only in the present, but also for generations to come...
, natural resources
Natural Resources
Natural Resources is a soul album released by Motown girl group Martha Reeves and the Vandellas in 1970 on the Gordy label. The album is significant for the Vietnam War ballad "I Should Be Proud" and the slow jam, "Love Guess Who"...
, landscape architecture
Landscape architecture
Landscape architecture is the design of outdoor and public spaces to achieve environmental, socio-behavioral, or aesthetic outcomes. It involves the systematic investigation of existing social, ecological, and geological conditions and processes in the landscape, and the design of interventions...
, archaeology
Archaeology
Archaeology, or archeology , is the study of human society, primarily through the recovery and analysis of the material culture and environmental data that they have left behind, which includes artifacts, architecture, biofacts and cultural landscapes...
, regional and community planning, transportation and logistics. GIS is also diverging into location-based service
Location-based service
A Location-Based Service is an information or entertainment service, accessible with mobile devices through the mobile network and utilizing the ability to make use of the geographical position of the mobile device....
s (LBS). LBS allows GPS enabled mobile devices to display their location in relation to fixed assets (nearest restaurant, gas station, fire hydrant), mobile assets (friends, children, police car) or to relay their position back to a central server for display or other processing. These services continue to develop with the increased integration of GPS functionality with increasingly powerful mobile electronics (cell phones, PDAs, laptops).
OGC standards
The Open Geospatial ConsortiumOpen Geospatial Consortium
The Open Geospatial Consortium , an international voluntary consensus standards organization, originated in 1994. In the OGC, more than 400 commercial, governmental, nonprofit and research organizations worldwide collaborate in a consensus process encouraging development and implementation of open...
(OGC) is an international industry consortium of 384 companies, government agencies, universities and individuals participating in a consensus process to develop publicly available geoprocessing specifications. Open interfaces and protocols defined by OpenGIS Specifications support interoperable solutions that "geo-enable" the Web, wireless and location-based services, and mainstream IT, and empower technology developers to make complex spatial information and services accessible and useful with all kinds of applications. Open Geospatial Consortium (OGC) protocols include Web Map Service
Web Map Service
A Web Map Service is a standard protocol for serving georeferenced map images over the Internet that are generated by a map server using data from a GIS database...
(WMS) and Web Feature Service
Web Feature Service
The Open Geospatial Consortium Web Feature Service Interface Standard provides an interface allowing requests for geographical features across the web using platform-independent calls...
(WFS).
GIS products are broken down by the OGC into two categories, based on how completely and accurately the software follows the OGC specifications.
Implementing Products are software products that implement OpenGIS Specifications but have not yet passed a compliance test. Compliance tests are not available for all specifications. Developers can register their products as implementing draft or approved specifications, though OGC reserves the right to review and verify each entry.
Web mapping
In recent years there has been an explosion of mapping applications on the web such as Google MapsGoogle Maps
Google Maps is a web mapping service application and technology provided by Google, free , that powers many map-based services, including the Google Maps website, Google Ride Finder, Google Transit, and maps embedded on third-party websites via the Google Maps API...
and Bing Maps. These websites give the public access to huge amounts of geographic data.
Some of them, like Google Maps and OpenLayers
OpenLayers
OpenLayers is an open source JavaScript library for displaying map data in web browsers. It provides an API for building rich web-based geographic applications similar to Google Maps and Bing Maps...
, expose an API
Application programming interface
An application programming interface is a source code based specification intended to be used as an interface by software components to communicate with each other...
that enable users to create custom applications. These toolkits commonly offer street maps, aerial/satellite imagery, geocoding, searches, and routing functionality.
Other applications for publishing geographic information on the web include GeoBase (Telogis GIS software), Smallworld
Smallworld
Smallworld was a GIS company founded in Cambridge, England, in 1989 by Dick Newell and others. It grew to become the global market leader for GIS in utilities and communications, according to Daratech. In September 2000, it was acquired by GE Energy, a division of General Electric...
's SIAS or GSS, MapInfo
MapInfo
MapInfo Corporation, initially incorporated as Navigational Technologies Incorporated, was a leading Location Intelligence and GIS company, headquartered in North Greenbush, New York. It was acquired on April 19, 2007 by Pitney Bowes, and on January 28, 2009, the name of division of Pitney Bowes it...
's MapXtreme or PlanAcess or Stratus Connect, Cadcorp
Cadcorp
Computer Aided Development Corporation Ltd. is a British owned and run company established in 1991. Cadcorp has its headquarters in Stevenage, Hertfordshire, U.K. and a development office in London...
's GeognoSIS, Intergraph
Intergraph
Intergraph Corporation is an American software development and services company. It provides enterprise engineering and geospatially powered software to businesses, governments, and organizations around the world. Intergraph operates through two divisions: Process, Power & Marine and Security,...
's GeoMedia
GeoMedia
GeoMedia is the technology, suite of software components in Intergraph Corporation's geographic information system and family of software products that include: GeoMedia Objects, GeoMedia Viewer , GeoMedia, GeoMedia Professional, GeoMedia WebMap, GeoMedia WebMap Professional and others...
WebMap (TM), ESRI
ESRI
Esri is a software development and services company providing Geographic Information System software and geodatabase management applications. The headquarters of Esri is in Redlands, California....
's ArcIMS
ArcIMS
ArcIMS is a Web Map Server produced by Esri. It is a GIS that is designed to serve maps across the Internet. Sometimes these maps are just static images allowing simple panning and zooming, while others are more complex pages...
, ArcGIS Server, Autodesk's MapGuide, Bentley's Geo Web Publisher, SeaTrails' AtlasAlive, ObjectFX's Web Mapping Tools, ERDAS APOLLO Suite, Google Earth
Google Earth
Google Earth is a virtual globe, map and geographical information program that was originally called EarthViewer 3D, and was created by Keyhole, Inc, a Central Intelligence Agency funded company acquired by Google in 2004 . It maps the Earth by the superimposition of images obtained from satellite...
, Google Fusion Tables
Google Fusion Tables
Google Fusion Tables is a Web service provided by Google for data management. Data is stored in multiple tables that Internet users can view and download....
, and the open source MapServer
MapServer
MapServer is an open source development environment for building spatially-enabled internet applications. It can run as a CGI program or via MapScript which supports several programming languages . MapServer was developed by the University of Minnesota — so, it is often and more specifically...
or GeoServer
GeoServer
In computing, GeoServer - an open-source server written in Java - allows users to share and edit geospatial data. Designed for interoperability, it publishes data from any major spatial data source using open standards...
.
In recent years web mapping services have begun to adopt features more common in GIS. Services such as Google Maps
Google Maps
Google Maps is a web mapping service application and technology provided by Google, free , that powers many map-based services, including the Google Maps website, Google Ride Finder, Google Transit, and maps embedded on third-party websites via the Google Maps API...
and Bing Maps allow users to access and annotate maps and share the maps with others.
Service-oriented architecture
Recently GIS systems have begun to migrate from stand-alone GIS systems to more integrated, enterprise approaches that share resources, data, and applications using a service-oriented architectureService-oriented architecture
In software engineering, a Service-Oriented Architecture is a set of principles and methodologies for designing and developing software in the form of interoperable services. These services are well-defined business functionalities that are built as software components that can be reused for...
(SOA). This allows application developers to create flexible and extensible GIS that can quickly respond to changing and future organizational needs.
Global change, climate history program and prediction of its impact
Maps have traditionally been used to explore the Earth and to exploit its resources. GIS technology, as an expansion of cartographic science, has enhanced the efficiency and analytic power of traditional mapping. Now, as the scientific community recognizes the environmental consequences of anthropogenic activities influencing climate change, GIS technology is becoming an essential tool to understand the impacts of this change over time. GIS enables the combination of various sources of data with existing maps and up-to-date information from earth observation satellites along with the outputs of climate change models. This can help in understanding the effects of climate change on complex natural systems. One of the classic examples of this is the study of Arctic Ice Melting.The outputs from a GIS in the form of maps combined with satellite imagery allow researchers to view their subjects in ways that literally never have been seen before. The images are also invaluable for conveying the effects of climate change to non-scientists.
Adding the dimension of time
The condition of the Earth's surface, atmosphere, and subsurface can be examined by feeding satellite data into a GIS. GIS technology gives researchers the ability to examine the variations in Earth processes over days, months, and years.As an example, the changes in vegetation vigor through a growing season can be animated to determine when drought was most extensive in a particular region. The resulting graphic, known as a normalized vegetation index, represents a rough measure of plant health. Working with two variables over time would then allow researchers to detect regional differences in the lag between a decline in rainfall and its effect on vegetation.
GIS technology and the availability of digital data on regional and global scales enable such analyses. The satellite sensor output used to generate a vegetation graphic is produced for example by the Advanced Very High Resolution Radiometer
Advanced Very High Resolution Radiometer
The Advanced Very High Resolution Radiometer is a space-borne sensor embarked on the National Oceanic and Atmospheric Administration family of polar orbiting platforms . AVHRR instruments measure the reflectance of the Earth in 5 relatively wide spectral bands...
(AVHRR). This sensor system detects the amounts of energy reflected from the Earth's surface across various bands of the spectrum for surface areas of about 1 square kilometer. The satellite sensor produces images of a particular location on the Earth twice a day. AVHRR and more recently the Moderate-Resolution Imaging Spectroradiometer (MODIS) are only two of many sensor systems used for Earth surface analysis. More sensors will follow, generating ever greater amounts of data.
GIS and related technology will help greatly in the management and analysis of these large volumes of data, allowing for better understanding of terrestrial processes and better management of human activities to maintain world economic vitality and environmental quality.
In addition to the integration of time in environmental studies, GIS is also being explored for its ability to track and model the progress of humans throughout their daily routines. A concrete example of progress in this area is the recent release of time-specific population data by the US Census. In this data set, the populations of cities are shown for daytime and evening hours highlighting the pattern of concentration and dispersion generated by North American commuting patterns. The manipulation and generation of data required to produce this data would not have been possible without GIS.
Using models to project the data held by a GIS forward in time have enabled planners to test policy decisions. These systems are known as Spatial Decision Support System
Spatial Decision Support System
Spatial decision support systems developed in parallel with the concept of decision support systems .An sDSS is an interactive, computer-based system designed to support a user or group of users in achieving a higher effectiveness of decision making while solving a semi-structured spatial problem...
s.
Semantics
Tools and technologies emerging from the W3C'sWorld Wide Web Consortium
The World Wide Web Consortium is the main international standards organization for the World Wide Web .Founded and headed by Tim Berners-Lee, the consortium is made up of member organizations which maintain full-time staff for the purpose of working together in the development of standards for the...
Semantic Web Activity
Semantic Web
The Semantic Web is a collaborative movement led by the World Wide Web Consortium that promotes common formats for data on the World Wide Web. By encouraging the inclusion of semantic content in web pages, the Semantic Web aims at converting the current web of unstructured documents into a "web of...
are proving useful for data integration
Data integration
Data integration involves combining data residing in different sources and providing users with a unified view of these data.This process becomes significant in a variety of situations, which include both commercial and scientific domains...
problems in information systems. Correspondingly, such technologies have been proposed as a means to facilitate interoperability
Interoperability
Interoperability is a property referring to the ability of diverse systems and organizations to work together . The term is often used in a technical systems engineering sense, or alternatively in a broad sense, taking into account social, political, and organizational factors that impact system to...
and data reuse among GIS applications and also to enable new analysis mechanisms.
Ontologies
Ontology (computer science)
In computer science and information science, an ontology formally represents knowledge as a set of concepts within a domain, and the relationships between those concepts. It can be used to reason about the entities within that domain and may be used to describe the domain.In theory, an ontology is...
are a key component of this semantic approach as they allow a formal, machine-readable specification of the concepts and relationships in a given domain. This in turn allows a GIS to focus on the intended meaning of data rather than its syntax or structure. For example, reasoning that a land cover type classified as deciduous needleleaf trees in one dataset is a specialization or subset
Subset
In mathematics, especially in set theory, a set A is a subset of a set B if A is "contained" inside B. A and B may coincide. The relationship of one set being a subset of another is called inclusion or sometimes containment...
of land cover type forest in another more roughly classified dataset can help a GIS automatically merge the two datasets under the more general land cover classification. Tentative ontologies have been developed in areas related to GIS applications, for example the hydrology ontology developed by the Ordnance Survey
Ordnance Survey
Ordnance Survey , an executive agency and non-ministerial government department of the Government of the United Kingdom, is the national mapping agency for Great Britain, producing maps of Great Britain , and one of the world's largest producers of maps.The name reflects its creation together with...
in the United Kingdom
United Kingdom
The United Kingdom of Great Britain and Northern IrelandIn the United Kingdom and Dependencies, other languages have been officially recognised as legitimate autochthonous languages under the European Charter for Regional or Minority Languages...
and the SWEET ontologies developed by NASA
NASA
The National Aeronautics and Space Administration is the agency of the United States government that is responsible for the nation's civilian space program and for aeronautics and aerospace research...
's Jet Propulsion Laboratory
Jet Propulsion Laboratory
Jet Propulsion Laboratory is a federally funded research and development center and NASA field center located in the San Gabriel Valley area of Los Angeles County, California, United States. The facility is headquartered in the city of Pasadena on the border of La Cañada Flintridge and Pasadena...
. Also, simpler ontologies and semantic metadata standards are being proposed by the W3C Geo Incubator Group to represent geospatial data on the web.
Recent research results in this area can be seen in the International Conference on Geospatial Semantics and the Terra Cognita – Directions to the Geospatial Semantic Web workshop at the International Semantic Web Conference.
Society
With the popularization of GIS in decision making, scholars have begun to scrutinize the social implications of GIS. It has been argued that the production, distribution, utilization, and representation of geographic information are largely related with the social context. Other related topics include discussion on copyright, privacy, and censorship. A more optimistic social approach to GIS adoption is to use it as a tool for public participation.See also
- AM/FM/GISAM/FM/GISAM/FM/GIS stands for Automated Mapping/Facilities Management and is a subset of GIS, which is associated with public utilities like gas, electric, water and telecommunications. The term AM/FM/GIS mostly refers to GIS software that allows utility users to digitize, manage and analyze their utility...
- Association of Geographic Information Laboratories for Europe (AGILE), promoting academic teaching and research on GIS at the EuropeEuropeEurope is, by convention, one of the world's seven continents. Comprising the westernmost peninsula of Eurasia, Europe is generally 'divided' from Asia to its east by the watershed divides of the Ural and Caucasus Mountains, the Ural River, the Caspian and Black Seas, and the waterways connecting...
an level - At-location mapping
- Automotive navigation systemAutomotive navigation systemAn automotive navigation system is a satellite navigation system designed for use in automobiles. It typically uses a GPS navigation device to acquire position data to locate the user on a road in the unit's map database. Using the road database, the unit can give directions to other locations...
- BroadMapBroadMapBroadMap is a full-service GIS company based in Lebanon, New Hampshire. The company specializes in providing government, non-profit and commercial business partners with custom-fit, turnkey geospatial products and services.-Overview:...
- CartographyCartographyCartography is the study and practice of making maps. Combining science, aesthetics, and technique, cartography builds on the premise that reality can be modeled in ways that communicate spatial information effectively.The fundamental problems of traditional cartography are to:*Set the map's...
- ClearinghouseClearinghouse (GIS)A clearinghouse in GIS is a repository structure, physical or virtual, that collects, stores, and disseminates information, metadata, and data. A clearinghouse provides widespread access to information and is generally thought of as reaching or existing outside organizational boundaries....
- Comparison of GIS softwareComparison of GIS softwareThis is a comparison of notable GIS software. To be included on this list, the software must either have a linked existing article or include references to independent sources verifying notability.-License, source, & operating system support:-Map servers:...
- Computerized Maintenance Management SystemComputerized Maintenance Management SystemComputerized maintenance management system is also known as enterprise asset management and computerized maintenance management information system ....
- Crime mappingCrime mappingCrime mapping is used by analysts in law enforcement agencies to map, visualize, and analyze crime incident patterns. It is a key component of crime analysis and the CompStat policing strategy...
- Digital geologic mappingDigital geologic mappingDigital geologic mapping is the process by which geologic features are observed, analyzed, and recorded in the field and displayed in real-time on a computer or personal digital assistant...
- Digital raster graphicDigital raster graphicA digital raster graphic is a digital image resulting from scanning a paper USGS topographic map for use on a computer. DRGs created by USGS are typically scanned at 250 dpi and saved as a TIFF. The raster image usually includes the original border information, referred to as the "map collar". ...
- Distributed GISDistributed GISDistributed GIS concerns itself with GI Systems that do not have all of the system components in the same physical location. This could be the processing, the database, the rendering or the user interface...
- ESRIESRIEsri is a software development and services company providing Geographic Information System software and geodatabase management applications. The headquarters of Esri is in Redlands, California....
- Field-MapField-mapField-Map is an integrated tool designed for computer aided field data collection. It is used mainly for mapping of forest ecosystems and for data collection during field examinations. This application is able to work with multi-level relational database and also provides smooth communication with...
- GeodesyGeodesyGeodesy , also named geodetics, a branch of earth sciences, is the scientific discipline that deals with the measurement and representation of the Earth, including its gravitational field, in a three-dimensional time-varying space. Geodesists also study geodynamical phenomena such as crustal...
- Geographic Data FilesGeographic Data FilesGeographic Data Files or GDF is an interchange file format for geographic data.In contrast with generic GIS formats, GDF provides detailed rules for data capture and representation, and an extensive catalog of standard features, attributes and relationships...
- Geographic information scienceGeographic Information ScienceGeographic information science is the academic theory behind the development, use, and application of geographic information systems...
- Geographic information systems in ChinaGeographic information systems in ChinaGeographic information systems are becoming an increasingly important component of business, healthcare, security, government, trade, media, transportation and tourism industries and operations in China and GIS software are playing an increasing role in the way Chinese companies analyze and manage...
- GeoinformaticsGeoinformaticsGeoinformatics is the science and the technology which develops and uses information science infrastructure to address the problems of geography, geosciences and related branches of engineering.-Overview:...
- GeoinformationGeoinformationGeoinformation is an abbreviation of geographic information. Geographic information is created by manipulating geographic data in a computerized system. Systems can include computers and networks, standards and protocols for data use and exchange between users within a range of different...
- GeomaticsGeomaticsGeomatics is the discipline of gathering, storing, processing, and delivering geographic information, or spatially referenced information.-Overview and etymology:...
- GIS and aquatic scienceGIS and aquatic scienceGeographic Information Systems is becoming an integral part of aquatic science and limnology. Water by its very nature is dynamic. Features associated with water are thus ever-changing...
- GIS applicationsGIS applicationsGeographic information systems are computer software and hardware systems that enable users to capture, store, analyse and manage spatially referenced data....
- GIS-CentricGIS-CentricGIS-Centric is an application approach leveraging the Esri ArcGIS Geodatabase. This term has been used loosely to explain a GIS central focus of an application's functionality, whereas the term map-centric maybe better suited...
- GISCorpsGISCorpsGISCorps, founded in 2003, is a program initiated by the Urban and Regional Information Systems Association that offers volunteer GIS services to under-served developing communities worldwide....
- GIS DayGIS DayGIS Day is a grassroots educational event that enables geographic information systems users and vendors to open their doors to schools, businesses, and the general public to showcase real-world applications of GIS....
- GIS in archaeology
- GIS in geospatial intelligenceGeographic information systems in geospatial intelligenceGeographic Information Systems new and constantly evolving role in geospatial intelligence and United States national security allows a user to efficiently manage, analyze, and produce geospatial data, to combine GEOINT with other forms of intelligence collection, and to perform highly developed...
- Historical GIS
- List of GIS software
- Map database managementMap database managementMap database management stems from navigation units becoming more common in automotive vehicles . They serve to perform usual navigation functions, such as finding a route to a desired destination and guiding the driver to it or determining the vehicle’s location and providing information about...
- The National States Geographic Information CouncilThe National States Geographic Information CouncilThe National States Geographic Information Council, known as NSGIC, is an organization in the United States of America of the states, the District of Columbia, and the territories that works to improve the use and sharing of geospatial data and GIS tools...
- New Zealand Geospatial OfficeNew Zealand Geospatial OfficeNew Zealand Geospatial Office is a business unit within Land Information New Zealand. Geographic information systemTheir responsibilities include:...
- Open GIS Consortium
- OpenStreetMapOpenStreetMapOpenStreetMap is a collaborative project to create a free editable map of the world. Two major driving forces behind the establishment and growth of OSM have been restrictions on use or availability of map information across much of the world and the advent of inexpensive portable GPS devices.The...
- Participatory GISParticipatory GISAs defined by the participants in the Mapping for Change International Conference which took place in Nairobi, Kenya in September 2005, Participatory GIS is an emergent practice in its own right; developing out of participatory approaches to planning and spatial information and communication...
- Pictometry International
- Public Participation GISPublic Participation GISPublic participation geographic information systems was born, as a term, in 1996 at the meetings of the National Center for Geographic Information and Analysis . PPGIS is meant to bring the academic practices of GIS and mapping to the local level in order to promote knowledge production...
- Public Asset ManagementPublic asset managementPublic asset management expands the definition of Enterprise Asset Management by incorporating the management of all things which are of value to a municipal jurisdiction and its citizens' expectations....
- Remote sensingRemote sensingRemote sensing is the acquisition of information about an object or phenomenon, without making physical contact with the object. In modern usage, the term generally refers to the use of aerial sensor technologies to detect and classify objects on Earth by means of propagated signals Remote sensing...
- ShapefileShapefileThe Esri Shapefile or simply a shapefile is a popular geospatial vector data format for geographic information systems software. It is developed and regulated by Esri as a open specification for data interoperability among Esri and other software products.Shapefiles spatially describe geometries:...
- Spatial Decision Support SystemSpatial Decision Support SystemSpatial decision support systems developed in parallel with the concept of decision support systems .An sDSS is an interactive, computer-based system designed to support a user or group of users in achieving a higher effectiveness of decision making while solving a semi-structured spatial problem...
- TerraLook
- Topologically Integrated Geographic Encoding and ReferencingTopologically Integrated Geographic Encoding and ReferencingTopologically Integrated Geographic Encoding and Referencing, or TIGER, or TIGER/Line is a format used by the United States Census Bureau to describe land attributes such as roads, buildings, rivers, and lakes, as well as areas such as census tracts...
(TIGER), a US standard for GIS data - Traditional knowledge GISTraditional knowledge GISTraditional knowledge Geographic Information Systems are the data, techniques, and technologies designed to document and utilize local knowledges in communities around the world. Traditional knowledge is information that encompasses the experiences of a particular culture or society...
- UNIGISUNIGISUNIGIS is a worldwide network of universities cooperating since 1992 in the design, development and delivery of distance learning in Geographical Information Science and Systems...
, international university collaboration on GIS education - Urban and Regional Information Systems Association
- Virtual globeVirtual globeA virtual globe is a 3D software model or representation of the Earth or another world. A virtual globe provides the user with the ability to freely move around in the virtual environment by changing the viewing angle and position. Compared to a conventional globe, virtual globes have the...
- ZIP codeZIP CodeZIP codes are a system of postal codes used by the United States Postal Service since 1963. The term ZIP, an acronym for Zone Improvement Plan, is properly written in capital letters and was chosen to suggest that the mail travels more efficiently, and therefore more quickly, when senders use the...
Further reading
- Berry, J.K. (1993) Beyond Mapping: Concepts, Algorithms and Issues in GIS. Fort Collins, CO: GIS World Books.
- Bolstad, P. (2005) GIS Fundamentals: A first text on Geographic Information Systems, Second Edition. White Bear Lake, MN: Eider Press, 543 pp.
- Burrough, P.A. and McDonnell, R.A. (1998) Principles of geographical information systems. Oxford University PressOxford University PressOxford University Press is the largest university press in the world. It is a department of the University of Oxford and is governed by a group of 15 academics appointed by the Vice-Chancellor known as the Delegates of the Press. They are headed by the Secretary to the Delegates, who serves as...
, Oxford, 327 pp. - Chang, K. (2007) Introduction to Geographic Information System, 4th Edition. McGraw Hill.
- Coulman, Ross (2001–present) Numerous GIS White Papers
- de Smith M J, Goodchild M F, Longley P A (2007) Geospatial analysis: A comprehensive guide to principles, techniques and software tools", 2nd edition, Troubador, UK available free online at: http://www.spatialanalysisonline.com/
- Elangovan,K (2006)"GIS: Fundamentals, Applications and Implementations", New India Publishing Agency, New Delhi"208 pp.
- Fu, P., and J. Sun. 2010. Web GIS: Principles and Applications. ESRI Press. Redlands, CA. ISBN 158948245X.
- Harvey, Francis(2008) A Primer of GIS, Fundamental geographic and cartographic concepts. The Guilford Press, 31 pp.
- Heywood, I., Cornelius, S., and Carver, S. (2006) An Introduction to Geographical Information Systems. Prentice Hall. 3rd edition.
- Longley, P.A., Goodchild, M.F.Michael Frank GoodchildMichael Frank Goodchild is a British-American geographer. He is currently a professor of geography at the University of California, Santa Barbara...
, Maguire, D.J. and Rhind, D.W.David William RhindProfessor David William Rhind CBE FRS FBA is a British geographer and expert on geographic information systems . He was Vice-Chancellor of City University London until July 2007....
(2005) Geographic Information Systems and Science. Chichester: Wiley. 2nd edition. - Maguire, D.J., Goodchild M.F., Rhind D.W. (1997) "Geographic Information Systems: principles, and applications" Longman Scientific and Technical, Harlow.
- Ott, T. and Swiaczny, F. (2001) Time-integrative GIS. Management and analysis of spatio-temporal data, Berlin / Heidelberg / New York: Springer.
- Sajeevan G (2008) Latitude and longitude – A misunderstanding, Current Science: March 2008. Vol 94. No 5. 568 pp. Available online at: http://www.ias.ac.in/currsci
- Sajeevan G (2006) Customise and empower, www.geospatialtoday.com: April 2006. 40 pp.
- Thurston, J., Poiker, T.K. and J. Patrick Moore. (2003) Integrated Geospatial Technologies: A Guide to GPS, GIS, and Data Logging. Hoboken, New Jersey: Wiley.
- Tomlinson, R.F., (2005) Thinking About GIS: Geographic Information System Planning for Managers. ESRI Press. 328 pp.
- Wise, S. (2002) GIS Basics. London: Taylor & Francis.
- Worboys, Michael, and Matt Duckham. (2004) GIS: a computing perspective. Boca Raton: CRC Press.
- Wheatley, David and Gillings, Mark (2002) Spatial Technology and Archaeology. The Archaeological Application of GIS. London, New York, Taylor & Francis.
External links
- Association of Geographic Information Laboratories for Europe (AGILE) – promoting academic teaching and research on GIS at the European level
- Cartography and Geographic Information Society (CaGIS)
- Directions Magazine – All Things Location
- Federal Geographic Data Committee—United States federal government standards agency.
- Geographic Information System (GIS) Educational website—Educational site with PDF lessons and videos to accompany free GIS software.
- GIS Development – The Geospatial Communication Network
- GIS Lounge Information site about GIS.
- GISWiki.NEWS.Reader – Searchable feed aggregator for a large collection of GIS news, mostly in English.
- GITA – Geospatial Information & Technology Association.
- International Cartographic Association (ICA), the world body for mapping and GIScience professionals
- National States Geographic Information Council (NSGIC)
- Open Forum on Participatory Geographic Information Systems and Technologies – a global network of PGIS/PPGIS English-speaking practitioners and researchers with Spanish, Portuguese and French-speaking chapters.
- Open Geospatial Consortium, Inc.
- Open Source Geospatial Foundation
- USGS GIS Poster—Frequently cited "What is GIS" poster.