
Contour line
Overview
Function (mathematics)
In mathematics, a function associates one quantity, the argument of the function, also known as the input, with another quantity, the value of the function, also known as the output. A function assigns exactly one output to each input. The argument and the value may be real numbers, but they can...
of two variables is a curve
Curve
In mathematics, a curve is, generally speaking, an object similar to a line but which is not required to be straight...
along which the function has a constant value. In cartography
Cartography
Cartography is the study and practice of making maps. Combining science, aesthetics, and technique, cartography builds on the premise that reality can be modeled in ways that communicate spatial information effectively.The fundamental problems of traditional cartography are to:*Set the map's...
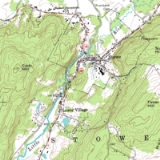
, a contour line (often just called a "contour") joins points of equal elevation
Elevation
The elevation of a geographic location is its height above a fixed reference point, most commonly a reference geoid, a mathematical model of the Earth's sea level as an equipotential gravitational surface ....
(height) above a given level, such as mean sea level. A contour map is a map
Map
A map is a visual representation of an area—a symbolic depiction highlighting relationships between elements of that space such as objects, regions, and themes....
illustrated with contour lines, for example a topographic map
Topographic map
A topographic map is a type of map characterized by large-scale detail and quantitative representation of relief, usually using contour lines in modern mapping, but historically using a variety of methods. Traditional definitions require a topographic map to show both natural and man-made features...
, which thus shows valleys and hills, and the steepness of slopes. The contour interval of a contour map is the difference in elevation between successive contour lines.
More generally, a contour line for a function of two variables is a curve connecting points where the function has the same particular value.
Unanswered Questions
Discussions