
Statewide opinion polling for the United States presidential election, 2008
Encyclopedia
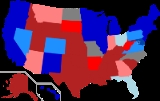
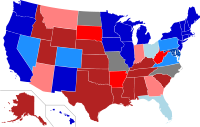
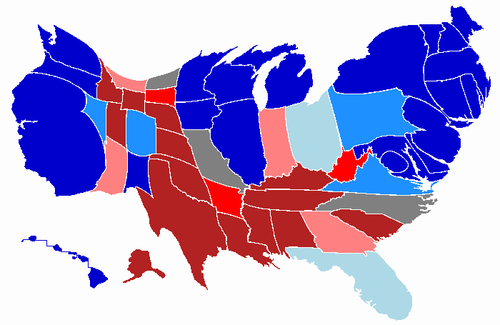
This article provides a collection of state-wide public opinion polls that were conducted relating to the United States presidential election, 2008
.
9 electoral votes
(Republican in 2000 & 2004)
3 electoral votes
(Republican in 2000 & 2004)
10 electoral votes
(Republican in 2000 & 2004)
6 electoral votes
(Republican in 2000 & 2004)
55 electoral votes
(Democrat in 2000 & 2004)
9 electoral votes
chart
(Republican in 2000 & 2004)
7 electoral votes
(Democrat in 2000 & 2004)
3 electoral votes
(Democrat in 2000 & 2004)
3 electoral votes
(Democrat in 2000 & 2004)
27 electoral votes
chart
(Republican in 2000 & 2004)
15 electoral votes
(Republican in 2000 & 2004)
4 electoral votes
(Democrat in 2000)
(Democrat in 2004)
4 electoral votes
(Republican in 2000 & 2004)
21 electoral votes
(Democrat in 2000)
(Democrat in 2004)
11 electoral votes
chart
(Republican in 2000 & 2004)
7 electoral votes
(Democrat in 2000)
(Republican in 2004)
6 electoral votes
(Republican in 2000 & 2004)
8 electoral votes
(Republican in 2000 & 2004)
9 electoral votes
(Republican in 2000 & 2004)
4 electoral votes
(Democrat in 2000)
(Democrat in 2004)
10 electoral votes
(Democrat in 2000 & 2004)
12 electoral votes
(Democrat in 2000 & 2004)
17 electoral votes
(Democrat in 2000 & 2004)
10 electoral votes
chart
(Democrat in 2000 & 2004)
6 electoral votes
(Republican in 2000 & 2004)
for earlier results
11 electoral votes
chart
(Republican in 2000 & 2004)
3 electoral votes
(Republican in 2000 & 2004)
‡ Ron Paul replaced Chuck Baldwin on the ballot in Montana.
5 electoral votes
(Republican in 2000 & 2004)
5 electoral votes
chart
(Republican in 2000 & 2004)
4 electoral votes
chart
(Republican in 2000)
(Democrat in 2004)
15 electoral votes
(Democrat in 2000 & 2004)
5 electoral votes
(Democrat in 2000)
(Republican in 2004)
31 electoral votes
(Democrat in 2000 & 2004)
15 electoral votes
chart
(Republican in 2000 & 2004)
3 electoral votes
(Republican in 2000 & 2004)
20 electoral votes
chart
(Republican in 2000 & 2004)
7 electoral votes
(Republican in 2000 & 2004)
7 electoral votes
(Democrat in 2000 & 2004)
21 electoral votes
chart
(Democrat in 2000 & 2004)
4 electoral votes
(Democrat in 2000 & 2004)
8 electoral votes
(Republican in 2000 & 2004)
3 electoral votes
(Republican in 2000 & 2004)
11 electoral votes
(Republican in 2000 & 2004)
34 electoral votes
(Republican in 2000 & 2004)
5 electoral votes
(Republican in 2000 & 2004)
Winner: Barack Obama
3 electoral votes
(Democrat in 2000 & 2004)
13 electoral votes
chart
(Republican in 2000 & 2004)
11 electoral votes
(Democrat in 2000 & 2004)
5 electoral votes
(Republican in 2000 & 2004)
10 electoral votes
chart
(Democrat in 2000 & 2004)
3 electoral votes
(Republican in 2000 & 2004)
Barack Obama
− Joe Biden
Safe states (19 states & D.C. − 233 electoral votes)
Likely states (3 states − 39 electoral votes)
Leaning states (6 states − 84 electoral votes)
John McCain
− Sarah Palin
Tied
votes in the event no one qualifies.
Totals
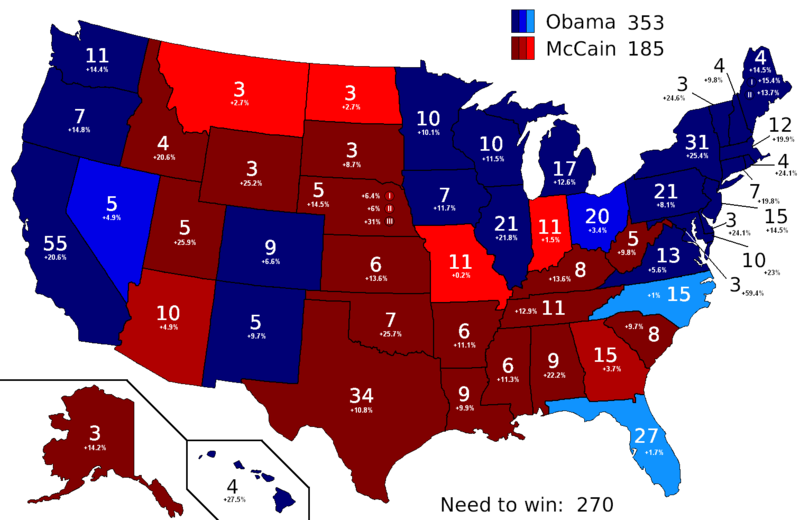
FINAL UPDATE: 22:32, 4 November 2008 (UTC)
United States presidential election, 2008
The United States presidential election of 2008 was the 56th quadrennial presidential election. It was held on November 4, 2008. Democrat Barack Obama, then the junior United States Senator from Illinois, defeated Republican John McCain, the senior U.S. Senator from Arizona. Obama received 365...
.
 Alabama
9 electoral votes(Republican in 2000 & 2004)
| Alabama Alabama Alabama is a state located in the southeastern region of the United States. It is bordered by Tennessee to the north, Georgia to the east, Florida and the Gulf of Mexico to the south, and Mississippi to the west. Alabama ranks 30th in total land area and ranks second in the size of its inland... opinion polls |
||||||
|---|---|---|---|---|---|---|
| Poll Source | Date administered (2008) | Democrat | % | Republican | % | Lead Margin |
| Survey USA | Oct 27-28 | Barack Obama | 36% | John McCain | 61% | |
| Capital Survey Research Center | Oct 15-21 | Barack Obama | 34% | John McCain | 54% | |
| Survey USA | Oct 8-9 | Barack Obama | 35% | John McCain | 62% | |
| Capital Research Center | Oct 6-7 | Barack Obama | 35% | John McCain | 54.5% | |
| Rasmussen Reports | Sept 22 | Barack Obama | 39% | John McCain | 60% | |
| Survey USA | Sept 16-17 | Barack Obama | 34% | John McCain | 64% | |
| American Research Group | Sept 13-16 | Barack Obama | 36% | John McCain | 58% | |
| University of South Alabama/ Press-Register |
Sept 8-15 | Barack Obama | 25% | John McCain | 52% | |
| Capital Survey Research Center/ Alabama Education Association |
Sept 3-9 | Barack Obama | 35% | John McCain | 55% | |
| Capital Survey Research Center/ Alabama Education Association |
July 29-Aug 4 | Barack Obama | 34% | John McCain | 47% | |
| Rasmussen Reports | July 31 | Barack Obama | 38% | John McCain | 58% |
 Alaska
3 electoral votes(Republican in 2000 & 2004)
| Alaska Alaska Alaska is the largest state in the United States by area. It is situated in the northwest extremity of the North American continent, with Canada to the east, the Arctic Ocean to the north, and the Pacific Ocean to the west and south, with Russia further west across the Bering Strait... opinion polls |
||||||
|---|---|---|---|---|---|---|
| Poll Source | Date administered (2008) | Democrat | % | Republican | % | Lead Margin |
| Hays Research ** | Nov 2 | Barack Obama | 45% | John McCain | 48% | |
| Research 2000/Daily Kos | Oct 28-30 | Barack Obama | 39% | John McCain | 58% | |
| Rasmussen Reports | Oct 28 | Barack Obama | 41% | John McCain | 57% | |
| Ivan Moore Research | Oct 17-19 | Barack Obama | 42% | John McCain | 53% | |
| Research 2000/ Daily Kos |
Oct 14-16 | Barack Obama | 38% | John McCain | 57% | |
| Rasmussen Reports | Oct 6 | Barack Obama | 40% | John McCain | 55% | |
| Fairleigh Dickinson University | Sept 17-21 | Barack Obama | 37% | John McCain | 55% | |
| Research 2000/ Daily Kos |
Sept 15-17 | Barack Obama | 38% | John McCain | 55% | |
| American Research Group | Sept 9-11 | Barack Obama | 39% | John McCain | 55% | |
| Rasmussen Reports | Sept 9 | Barack Obama | 33% | John McCain | 64% | |
| American Viewpoint ** | Sept 2 | Barack Obama | 33% | John McCain | 57% | |
| Ivan Moore Research | Aug 30- Sept 2 |
Barack Obama | 34.9% | John McCain | 53.5% | |
| Hays Research Group ** | Aug 6-7 | Barack Obama | 45% | John McCain | 40% | |
| Rasmussen Reports | July 30 | Barack Obama | 42% | John McCain | 48% | |
| Ivan Moore Research | July 18–22 | Barack Obama | 44% | John McCain | 47% | |
| Rasmussen Reports | July 17 | Barack Obama | 44% | John McCain | 49% | |
| Research 2000/ Daily Kos |
July 14–16 | Barack Obama | 41% | John McCain | 51% |
 Arizona
10 electoral votes(Republican in 2000 & 2004)
| Arizona Arizona Arizona ; is a state located in the southwestern region of the United States. It is also part of the western United States and the mountain west. The capital and largest city is Phoenix... opinion polls |
||||||
|---|---|---|---|---|---|---|
| Poll Source | Date administered (2008) | Democrat | % | Republican | % | Lead Margin |
| American Research Group | Oct 28-30 | Barack Obama | 46% | John McCain | 50% | |
| Research 2000/Daily Kos | Oct 28-30 | Barack Obama | 47% | John McCain | 48% | |
| NBC News/Mason Dixon | Oct 27-28 | Barack Obama | 44% | John McCain | 48% | |
| CNN/Time Magazine/ Opinion Research |
Oct 23-28 | Barack Obama | 46% | John McCain | 53% | |
| Northern Arizona University/ University of Washington |
Oct 18-27 | Barack Obama | 41% | John McCain | 49% | |
| Rasmussen Reports | Oct 26 | Barack Obama | 46% | John McCain | 51% | |
| Arizona State University/ Cronkite/Eight |
Oct 23-26 | Barack Obama | 44% | John McCain | 46% | |
| Myers Research/Grove Insight/ Project New West ** |
Oct 23-25 | Barack Obama | 40% | John McCain | 44% | |
| Zimmerman & Associates/ Marketing Intelligence ** |
Oct 16-18 | Barack Obama | 41.5% | John McCain | 43.5% | |
| Rasmussen Reports | Sept 29 | Barack Obama | 38% | John McCain | 59% | |
| Arizona State University/ Cronkite/Eight |
Sept 25-28 | Barack Obama | 38% | John McCain | 45% | |
| American Research Group | Sept 11-14 | Barack Obama | 39% | John McCain | 56% | |
| Walter Cronkite School/ Channel 8 (KAET) |
Aug 20 | Barack Obama | 30% | John McCain | 40% | |
| Mason-Dixon | Aug 13-15 | Barack Obama | 41% | John McCain | 47% | |
| Public Policy Polling(PPP) | July 30–31 | Barack Obama | 40% | John McCain | 52% | |
| Rasmussen Reports | July 30 | Barack Obama | 38% | John McCain | 57% |
 Arkansas
6 electoral votes(Republican in 2000 & 2004)
| Arkansas Arkansas Arkansas is a state located in the southern region of the United States. Its name is an Algonquian name of the Quapaw Indians. Arkansas shares borders with six states , and its eastern border is largely defined by the Mississippi River... opinion polls |
||||||
|---|---|---|---|---|---|---|
| Poll Source | Date administered (2008) | Democrat | % | Republican | % | Lead Margin |
| American Research Group | Oct 28-31 | Barack Obama | 44% | John McCain | 51% | |
| Rasmussen Reports | Oct 27 | Barack Obama | 44% | John McCain | 54% | |
| Research 2000/Daily Kos | Oct 21-22 | Barack Obama | 41% | John McCain | 52% | |
| University of Arkansas | Oct 1-21 | Barack Obama | 36% | John McCain | 51% | |
| Rasmussen Reports | Sept 22 | Barack Obama | 42% | John McCain | 51% | |
| American Research Group | Sept 20-22 | Barack Obama | 41% | John McCain | 53% | |
| Rasmussen Reports | July 17 | Barack Obama | 39% | John McCain | 52% |
 California
55 electoral votes(Democrat in 2000 & 2004)
| California California California is a state located on the West Coast of the United States. It is by far the most populous U.S. state, and the third-largest by land area... opinion polls |
||||||
|---|---|---|---|---|---|---|
| Poll Source | Date administered (2008) | Democrat | % | Republican | % | Lead Margin |
| Survey USA | Oct 29-31 | Barack Obama | 60% | John McCain | 36% | |
| Field Poll | Oct 18-28 | Barack Obama | 55% | John McCain | 33% | |
| Rasmussen Reports | Oct 25 | Barack Obama | 61% | John McCain | 34% | |
| Public Policy Institute of California | Oct 12-19 | Barack Obama | 56% | John McCain | 33% | |
| Survey USA | Oct 15-16 | Barack Obama | 59% | John McCain | 35% | |
| Rasmussen Reports | Oct 9 | Barack Obama | 56% | John McCain | 40% | |
| Survey USA | Oct 4-5 | Barack Obama | 55% | John McCain | 39% | |
| Survey USA | Sept 23-24 | Barack Obama | 53% | John McCain | 43% | |
| Rasmussen Reports | Sept 22 | Barack Obama | 56% | John McCain | 39% | |
| American Research Group | Sept 18-20 | Barack Obama | 53% | John McCain | 39% | |
| Public Policy Institute of California | Sept 9-16 | Barack Obama | 50% | John McCain | 40% | |
| Field Research Corporation | Sept 5-14 | Barack Obama | 52% | John McCain | 36% | |
| Rasmussen Reports | Aug 21 | Barack Obama | 54% | John McCain | 41% | |
| Public Policy Institute of California | Aug 12-19 | Barack Obama | 48% | John McCain | 39% | |
| Rasmussen Reports | July 24 | Barack Obama | 52% | John McCain | 42% | |
| Public Policy Institute of California | July 8–22 | Barack Obama | 50% | John McCain | 35% | |
| Field Research Corporation | July 8–14 | Barack Obama | 54% | John McCain | 30% | |
| Zogby International * | June 11–30 | Barack Obama | 52% | John McCain | 32% | |
| Rasmussen Reports | June 23 | Barack Obama | 58% | John McCain | 30% |
 Colorado
9 electoral voteschart
(Republican in 2000 & 2004)
| Colorado Colorado Colorado is a U.S. state that encompasses much of the Rocky Mountains as well as the northeastern portion of the Colorado Plateau and the western edge of the Great Plains... opinion polls |
||||||||||||||||
|---|---|---|---|---|---|---|---|---|---|---|---|---|---|---|---|---|
| Poll Source | Date administered (2008) | Democrat | % | Republican | % | Lead Margin | Others | % | ||||||||
| Rasmussen/Fox News | Nov 2 | Barack Obama | 51% | John McCain | 47% | |||||||||||
| American Research Group | Oct 28-30 | Barack Obama | 52% | John McCain | 45% | |||||||||||
| Public Policy Polling | Oct 28-30 | Barack Obama | 54% | John McCain | 44% | |||||||||||
| Denver Post/Mason-Dixon | Oct 28-29 | Barack Obama | 49% | John McCain | 44% | |||||||||||
| Marist College | Oct 27-28 | Barack Obama | 51% | John McCain | 45% | |||||||||||
| CNN/Time Magazine/ Opinion Research |
Oct 23-28 | Barack Obama | 53% | John McCain | 45% | |||||||||||
| Allstate/National Journal/FD | Oct 23-27 | Barack Obama | 48% | John McCain | 44% | |||||||||||
| Politico/InsiderAdvantage | Oct 26 | Barack Obama | 53% | John McCain | 45% | |||||||||||
| Rasmussen Reports/ Fox News |
Oct 26 | Barack Obama | 50% | John McCain | 46% | |||||||||||
| Associated Press/GfK | Oct 22-26 | Barack Obama | 50% | John McCain | 41% | |||||||||||
| Rocky Mountain News/ CBS4 News/ Public Opinion Strategies |
Oct 21-23 | Barack Obama | 52% | John McCain | 40% | |||||||||||
| InsiderAdvantage/ Poll Position |
Oct 20 | Barack Obama | 51% | John McCain | 46% | |||||||||||
| Rasmussen Reports/ Fox News |
Oct 19 | Barack Obama | 51% | John McCain | 46% | |||||||||||
| Rasmussen Reports | Oct 16 | Barack Obama | 52% | John McCain | 45% | |||||||||||
| CNN/Time Magazine/ Opinion Research |
Oct 11-14 | Barack Obama | 51% | John McCain | 47% | |||||||||||
| Suffolk University | Oct 10-13 | Barack Obama | 47% | John McCain | 43% | |||||||||||
| Quinnipiac University/ Wall Street Journal/ Washington Post |
Oct 8-12 | Barack Obama | 52% | John McCain | 43% | |||||||||||
| Public Policy Polling | Oct 8-10 | Barack Obama | 52% | John McCain | 42% | |||||||||||
| InsiderAdvantage/ Poll Position |
Oct 6 | Barack Obama | 51% | John McCain | 45% | |||||||||||
| Rasmussen Reports Fox News |
Oct 5 | Barack Obama | 51% | John McCain | 45% | |||||||||||
| Mason Dixon/Denver Post | Sept 29-Oct 1 | Barack Obama | 44% | John McCain | 44% | |||||||||||
| Rasmussen Reports/ Fox News |
Sept 28 | Barack Obama | 49% | John McCain | 48% | |||||||||||
| American Research Group | Sept 23-25 | Barack Obama | 45% | John McCain | 48% | |||||||||||
| Insider Advantage/ Poll Position |
Sept 23 | Barack Obama | 50% | John McCain | 41% | |||||||||||
| Rasmussen Reports | Sept 23 | Barack Obama | 50% | John McCain | 47% | |||||||||||
| CNN/Time Magazine | Sept 21-23 | Barack Obama | 49% | John McCain | 45% | |||||||||||
| Ciruli Associates/ Economic Development Council of Colorado |
Sept 19-23 | Barack Obama | 44% | John McCain | 43% | |||||||||||
| Public Policy Polling | Sept 20-21 | Barack Obama | 51% | John McCain | 44% | |||||||||||
| Quinnipiac University/ Wall Street Journal/ Washington Post |
Sept 14-21 | Barack Obama | 49% | John McCain | 45% | |||||||||||
| Insider Advantage/ Poll Position |
Sept 17 | Barack Obama | 51% | John McCain | 41% | |||||||||||
| Allstate/National Journal/FD | Sept 11-15 | Barack Obama | 45% | John McCain | 44% | |||||||||||
| Fox News/ Rasmussen Reports |
Sept 14 | Barack Obama | 46% | John McCain | 48% | |||||||||||
| American Research Group | Sept 10-13 | Barack Obama | 44% | John McCain | 46% | |||||||||||
| InsiderAdvantage/ Poll Position |
Sept 10 | Barack Obama | 49% | John McCain | 46% | |||||||||||
| Public Policy Polling | Sept 9 | Barack Obama | 47% | John McCain | 46% | |||||||||||
| Fox News/ Rasmussen Reports |
Sept 7 | Barack Obama | 49% | John McCain | 46% | |||||||||||
| Tarrance Group ** | Sept 2-3 | Barack Obama | 45% | John McCain | 47% | |||||||||||
| CNN/Time Magazine/ Opinion Research |
Aug 24-26 | Barack Obama | 46% | John McCain | 47% | |||||||||||
| Hill Research Consultants ** | Aug 23-24 | Barack Obama | 43% | John McCain | 40% | |||||||||||
| Suffolk University | Aug 21-24 | Barack Obama | 44% | John McCain | 39% | |||||||||||
| Quinnipiac University | Aug 15-21 | Barack Obama | 46% | John McCain | 47% | |||||||||||
| Ralph Nader | 2% | |||||||||||||||
| Other | 8% | |||||||||||||||
| Mason Dixon | Aug 13-15 | Barack Obama | 46% | John McCain | 43% | |||||||||||
| Rasmussen Reports | Aug 13 | Barack Obama | 48% | John McCain | 49% | |||||||||||
| Rocky Mtn News/CBS4 | Aug 11-13 | Barack Obama | 41% | John McCain | 44% | Bob Barr | 3% | |||||||||
| Ralph Nader | 2% | |||||||||||||||
| Other | 2% | |||||||||||||||
| Public Policy Polling | Aug 5-7 | Barack Obama | 48% | John McCain | 44% | |||||||||||
| FrederickPolls | July 16–22 | Barack Obama | 45% | John McCain | 41% | |||||||||||
| Quinnipiac University/ Wall Street Journal/ Washington Post |
July 14–22 | Barack Obama | 44% | John McCain | 46% | Other | 3% | |||||||||
| Rasmussen Reports | July 21 | Barack Obama | 50% | John McCain | 47% | |||||||||||
| Public Policy Polling | July 9–10 | Barack Obama | 47% | John McCain | 43% | |||||||||||
| Zogby International * | June 11–30 | Barack Obama | 40% | John McCain | 38% | Bob Barr | 8% | |||||||||
| Ralph Nader | 2% | |||||||||||||||
| Other | 4% | |||||||||||||||
 Connecticut
7 electoral votes(Democrat in 2000 & 2004)
| Connecticut Connecticut Connecticut is a state in the New England region of the northeastern United States. It is bordered by Rhode Island to the east, Massachusetts to the north, and the state of New York to the west and the south .Connecticut is named for the Connecticut River, the major U.S. river that approximately... opinion polls |
||||||
|---|---|---|---|---|---|---|
| Poll Source | Date administered (2008) | Democrat | % | Republican | % | Lead Margin |
| Hartford Courant/ University of Connecticut |
Oct 18-22 | Barack Obama | 56% | John McCain | 31% | |
| Rasmussen Reports | Oct 14 | Barack Obama | 56% | John McCain | 39% | |
| Survey USA | Sept 24-25 | Barack Obama | 54% | John McCain | 38% | |
| American Research Group | Sept 17-19 | Barack Obama | 54% | John McCain | 39% | |
| Rasmussen Reports | Sept 16 | Barack Obama | 53% | John McCain | 41% | |
| Rasmussen Reports | July 31 | Barack Obama | 51% | John McCain | 36% | |
| Research 2000/ Daily Kos |
June 30-July 2 | Barack Obama | 57% | John McCain | 35% | |
| Rasmussen Reports | July 1 | Barack Obama | 52% | John McCain | 35% |
 Delaware
3 electoral votes(Democrat in 2000 & 2004)
| Delaware Delaware Delaware is a U.S. state located on the Atlantic Coast in the Mid-Atlantic region of the United States. It is bordered to the south and west by Maryland, and to the north by Pennsylvania... opinion polls |
||||||
|---|---|---|---|---|---|---|
| Poll Source | Date administered (2008) | Democrat | % | Republican | % | Lead Margin |
| Survey USA | Oct 27-28 | Barack Obama | 63% | John McCain | 33% | |
| Rasmussen Reports | Oct 10 | Barack Obama | 56% | John McCain | 41% | |
| West Chester University | Oct 6-8 | Barack Obama | 55% | John McCain | 38% | |
| Survey USA | Sept 22-23 | Barack Obama | 57% | John McCain | 37% | |
| Fairleigh Dickinson University | Sept 17-21 | Barack Obama | 56% | John McCain | 36% | |
| American Research Group | Sept 13-15 | Barack Obama | 51% | John McCain | 40% | |
| Rasmussen Reports | Sept 13 | Barack Obama | 55% | John McCain | 43% |
 District of Columbia
3 electoral votes(Democrat in 2000 & 2004)
| District of Columbia opinion polls | ||||||
|---|---|---|---|---|---|---|
| Poll Source | Date administered (2008) | Democrat | % | Republican | % | Lead Margin |
| American Research Group | Sept 11-13 | Barack Obama | 82% | John McCain | 13% |
 Florida
27 electoral voteschart
(Republican in 2000 & 2004)
| Florida Florida Florida is a state in the southeastern United States, located on the nation's Atlantic and Gulf coasts. It is bordered to the west by the Gulf of Mexico, to the north by Alabama and Georgia and to the east by the Atlantic Ocean. With a population of 18,801,310 as measured by the 2010 census, it... opinion polls |
||||||
|---|---|---|---|---|---|---|
| Poll Source | Date administered (2008) | Democrat | % | Republican | % | Lead Margin |
| SurveyUSA | Oct 31-Nov 3 | Barack Obama | 50% | John McCain | 47% | |
| Reuters/Zogby | Oct 31-Nov 3 | Barack Obama | 49.25% | John McCain | 48% | |
| Datamar Inc. | Nov 1-2 | Barack Obama | 47% | John McCain | 48.2% | |
| Rasmussen Reports | Nov 2 | Barack Obama | 49% | John McCain | 50% | |
| Strategic Vision | Oct 31-Nov 2 | Barack Obama | 49% | John McCain | 47% | |
| Public Policy Polling | Oct 31-Nov 2 | Barack Obama | 50% | John McCain | 48% | |
| Reuters/Zogby | Oct 30-Nov 2 | Barack Obama | 47.5% | John McCain | 46.2% | |
| Quinnipiac University | Oct 27-Nov 2 | Barack Obama | 47% | John McCain | 45% | |
| American Research Group | Oct 29-31 | Barack Obama | 50% | John McCain | 46% | |
| Datamar Inc. | Oct 29-30 | Barack Obama | 46.7% | John McCain | 46.7% | |
| Mason-Dixon | Oct 29-30 | Barack Obama | 49% | John McCain | 47% | |
| CNN/Time Magazine/ Opinion Research |
Oct 23-28 | Barack Obama | 51% | John McCain | 47% | |
| Los Angeles Times/ Bloomberg |
Oct 25-27 | Barack Obama | 50% | John McCain | 43% | |
| Allstate/National Journal/FD | Oct 23-27 | Barack Obama | 45% | John McCain | 44% | |
| Suffolk University | Oct 26 | Barack Obama | 49% | John McCain | 44% | |
| Rasmussen Reports/ Fox News |
Oct 26 | Barack Obama | 51% | John McCain | 47% | |
| Datamar Inc. | Oct 25-26 | Barack Obama | 49.2% | John McCain | 44.4% | |
| Reuters/Zogby | Oct 23-26 | Barack Obama | 47.2% | John McCain | 46.9% | |
| Quinnipiac University | Oct 22-26 | Barack Obama | 47% | John McCain | 45% | |
| Associated Press/GfK | Oct 22-26 | Barack Obama | 45% | John McCain | 43% | |
| Politico/ InsiderAdvantage |
Oct 22 | Barack Obama | 48% | John McCain | 47% | |
| Strategic Vision | Oct 20-22 | Barack Obama | 46% | John McCain | 48% | |
| St. Petersburg Times/ Bay News 9/ Miami Herald |
Oct 20-22 | Barack Obama | 49% | John McCain | 42% | |
| NBC/Mason-Dixon | Oct 20-21 | Barack Obama | 45% | John McCain | 46% | |
| Quinnipiac University | Oct 16-21 | Barack Obama | 49% | John McCain | 44% | |
| Rasmussen Reports/ |
Oct 19 | Barack Obama | 48% | John McCain | 49% | |
| Public Policy Polling | Oct 16-19 | Barack Obama | 48% | John McCain | 47% | |
| SurveyUSA | Oct 16 | Barack Obama | 47% | John McCain | 49% | |
| Research 2000 Times-Union South Florida Sun Sentinel |
Oct 13-15 | Barack Obama | 49% | John McCain | 45% | |
| CNN/Time Magazine/ Opinion Research |
Oct 11-14 | Barack obama | 51% | John McCain | 46% | |
| InsiderAdvantage/ Poll Position |
Oct 13 | Barack Obama | 48% | John McCain | 44% | |
| Rasmussen Reports Fox News |
Oct 12 | Barack Obama | 51% | John McCain | 46% | |
| Rasmussen Reports | Oct 8 | Barack Obama | 50% | John McCain | 47% | |
| Strategic Vision | Oct 6-8 | Barack Obama | 52% | John McCain | 44% | |
| Research 2000 | Oct 6-8 | Barack Obama | 49% | John McCain | 44% | |
| NBC/Mason-Dixon | Oct 4-6 | Barack Obama | 48% | John McCain | 46% | |
| Rasmussen Reports/ Fox News |
Oct 5 | Barack Obama | 52% | John McCain | 45% | |
| InsiderAdvantage/ Poll Position |
Sept 30 | Barack Obama | 49% | John McCain | 46% | |
| CNN/Time Magazine/ Opinion Research |
Sept 28-30 | Barack Obama | 51% | John McCain | 47% | |
| Suffolk University/WSVN | Sept 27-30 | Barack Obama | 46% | John McCain | 42% | |
| Quinnipiac University | Sept 27-29 | Barack Obama | 51% | John McCain | 43% | |
| Rasmussen Reports/ |
Sept 28 | Barack Obama | 48% | John McCain | 48% | |
| Public Policy Polling | Sept 27-28 | Barack Obama | 49% | John McCain | 46% | |
| SurveyUSA | Sept 27-28 | Barack Obama | 47% | John McCain | 48% | |
| American Research Group | Sept 23-25 | Barack Obama | 47% | John McCain | 46% | |
| Rasmussen Reports | Sept 24 | Barack Obama | 47% | John McCain | 48% | |
| Strategic Vision | Sept 20-22 | Barack Obama | 45% | John McCain | 48% | |
| Fox News/ Rasmussen Reports |
Sept 21 | Barack Obama | 46% | John McCain | 51% | |
| NBC/Mason Dixon | Sept 16-18 | Barack Obama | 47% | John McCain | 45% | |
| Florida Times-Union/ South Florida Sun-Sentinel/ Research 2000 |
Sept 15-18 | Barack Obama | 45% | John McCain | 46% | |
| SurveyUSA | Sept 16-17 | Barack Obama | 45% | John McCain | 51% | |
| American Research Group | Sept 14-17 | Barack Obama | 46% | John McCain | 46% | |
| Miami Herald/ St. Petersberg Times/ Schroth, Eldon & Associates/ The Polling Company |
Sept 14-17 | Barack Obama | 45% | John McCain | 47% | |
| CNN/Time Magazine/ Opinion Research |
Sept 14-16 | Barack Obama | 48% | John McCain | 48% | |
| Allstate/National Journal/FD | Sept 11-15 | Barack Obama | 44% | John McCain | 44% | |
| Fox News/ Rasmussen Reports |
Sept 14 | Barack Obama | 44% | John McCain | 49% | |
| Insider Advantage/ Poll Position |
Sept 10 | Barack Obama | 42% | John McCain | 50% | |
| Quinnipiac University | Sept 5-9 | Barack Obama | 43% | John McCain | 50% |
 Georgia
15 electoral votes(Republican in 2000 & 2004)
| Georgia Georgia (U.S. state) Georgia is a state located in the southeastern United States. It was established in 1732, the last of the original Thirteen Colonies. The state is named after King George II of Great Britain. Georgia was the fourth state to ratify the United States Constitution, on January 2, 1788... opinion polls |
||||||
|---|---|---|---|---|---|---|
| Poll Source | Date administered (2008) | Democrat | % | Republican | % | Lead Margin |
| InsiderAdvantage/ Poll Position |
Nov 2 | Barack Obama | 47% | John McCain | 48% | |
| Strategic Vision | Oct 31-Nov 2 | Barack Obama | 46% | John McCain | 50% | |
| Public Policy Polling | Oct 31-Nov 2 | Barack Obama | 48% | John McCain | 50% | |
| SurveyUSA/ 13WAMZ |
Oct 30-Nov 2 | Barack Obama | 45% | John McCain | 52% | |
| Rasmussen Reports | Oct 30 | Barack Obama | 47% | John McCain | 52% | |
| Research 2000/Daily Kos | Oct 28-30 | Barack Obama | 44% | John McCain | 47% | |
| CNN/Time Magazine/ Opinion Research |
Oct 23-28 | Barack Obama | 47% | John McCain | 52% | |
| InsiderAdvantage/ Poll Position |
Oct 27 | Barack Obama | 47% | John McCain | 48% | |
| InsiderAdvantage/ Poll Position |
Oct 23 | Barack Obama | 48% | John McCain | 47% | |
| Mason-Dixon/NBC | Oct 22-23 | Barack Obama | 43% | John McCain | 49% | |
| Rasmussen Reports | Oct 22 | Barack Obama | 46% | John McCain | 51% | |
| Strategic Vision | Oct 20-22 | Barack Obama | 45% | John McCain | 51% | |
| Democracy Corps/ Greenberg, Quinlan, Rosner ** |
Oct 16-19 | Barack Obama | 44% | John McCain | 46% | |
| Research 2000/Daily Kos | Oct 14-15 | Barack Obama | 43% | John McCain | 49% | |
| CNN/Time Magazine/ Opinion Research |
Oct 11-14 | Barack Obama | 45% | John McCain | 51% | |
| SurveyUSA | Oct 12 | Barack Obama | 43% | John McCain | 51% | |
| InsiderAdvantage/ Poll Position |
Oct 9 | Barack Obama | 46% | John McCain | 49% | |
| Rasmussen Reports | Oct 7 | Barack Obama | 45% | John McCain | 54% | |
| Strategic Vision | Oct 5-7 | Barack Obama | 43% | John McCain | 50% | |
| Research 2000/Daily Kos | Sept 29-Oct 1 | Barack Obama | 43% | John McCain | 50% | |
| InsiderAdvantage/ Poll Position |
Sept 30 | Barack Obama | 44% | John McCain | 50% | |
| SurveyUSA | Sept 28-29 | Barack Obama | 44% | John McCain | 52% | |
| American Research Group | Sept 18-21 | Barack Obama | 39% | John McCain | 57% | |
| Rasmussen Reports | Sept 18 | Barack Obama | 43% | John McCain | 54% | |
| InsiderAdvantage/ Poll Position |
Sept 17 | Barack Obama | 43% | John McCain | 51% | |
| SurveyUSA | Sept 14-16 | Barack Obama | 41% | John McCain | 57% | |
| Public Opinion Strategies | Sept 9-11 | Barack Obama | 35% | John McCain | 56% | |
| InsiderAdvantage/ Poll Position |
Sept 10 | Barack Obama | 38% | John McCain | 56% | |
| Strategic Vision | Sept 7-9 | Barack Obama | 39% | John McCain | 52% | |
| Rasmussen Reports | Aug 14 | Barack Obama | 44% | John McCain | 53% | |
| Rasmussen Reports | July 17 | Barack Obama | 42% | John McCain | 53% | |
| InsiderAdvantage/ Poll Position/ Majority Opinion Research |
July 2 | Barack Obama | 44% | John McCain | 46% |
 Hawaii
4 electoral votes(Democrat in 2000)
(Democrat in 2004)
| Hawaii Hawaii Hawaii is the newest of the 50 U.S. states , and is the only U.S. state made up entirely of islands. It is the northernmost island group in Polynesia, occupying most of an archipelago in the central Pacific Ocean, southwest of the continental United States, southeast of Japan, and northeast of... opinion polls |
||||||
|---|---|---|---|---|---|---|
| Poll Source | Date administered (2008) | Democrat | % | Republican | % | Lead Margin |
| Rasmussen Reports | Sept 23 | Barack Obama | 68% | John McCain | 27% | |
| American Research Group | Sept 7-12 | Barack Obama | 63% | John McCain | 32% | |
| Survey USA | Feb 26-29 | Barack Obama | 61% | John McCain | 31% |
 Idaho
Idaho
4 electoral votes(Republican in 2000 & 2004)
| Idaho Idaho Idaho is a state in the Rocky Mountain area of the United States. The state's largest city and capital is Boise. Residents are called "Idahoans". Idaho was admitted to the Union on July 3, 1890, as the 43rd state.... opinion polls |
||||||
|---|---|---|---|---|---|---|
| Poll Source | Date administered (2008) | Democrat | % | Republican | % | Lead Margin |
| Harstead Strategic Research | Oct 19-22 | Barack Obama | 32% | John McCain | 55% | |
| Research 2000/Daily Kos | Sept 16-17 | Barack Obama | 33% | John McCain | 62% | |
| American Research Group | Sept 8-10 | Barack Obama | 25% | John McCain | 68% | |
| Rasmussen Reports | Sept 9 | Barack Obama | 29% | John McCain | 68% | |
| Greg Smith & Associates | Aug 18-22 | Barack Obama | 29% | John McCain | 52% | |
| Research 2000/Daily Kos | July 28–30 | Barack Obama | 37% | John McCain | 53% |
 Illinois
21 electoral votes(Democrat in 2000)
(Democrat in 2004)
| Illinois Illinois Illinois is the fifth-most populous state of the United States of America, and is often noted for being a microcosm of the entire country. With Chicago in the northeast, small industrial cities and great agricultural productivity in central and northern Illinois, and natural resources like coal,... opinion polls |
||||||
|---|---|---|---|---|---|---|
| Poll Source | Date administered (2008) | Democrat | % | Republican | % | Lead Margin |
| Rasmussen Reports | Nov 1 | Barack Obama | 60% | John McCain | 38% | |
| Research 2000 | Oct 20-23 | Barack Obama | 59% | John McCain | 35% | |
| Big Ten Poll | Oct 19-22 | Barack Obama | 61% | John McCain | 32% | |
| Chicago Tribune | Oct 16-18 | Barack Obama | 56% | John McCain | 32% | |
| Rasmussen Reports | Oct 13 | Barack Obama | 56% | John McCain | 39% | |
| St Louis Post-Dispatch/ Research 2000 |
Sept 15-18 | Barack Obama | 56% | John McCain | 36% | |
| Rasmussen Reports | Sept 17 | Barack Obama | 56% | John McCain | 40% | |
| Big Ten Poll | Sept 14-17 | Barack Obama | 53% | John McCain | 37% | |
| American Research Group | Sept 13-16 | Barack Obama | 51% | John McCain | 45% | |
| Rasmussen Reports | Aug 12 | Barack Obama | 55% | John McCain | 40% | |
| Rasmussen Reports | July 8 | Barack Obama | 52% | John McCain | 41% |
 Indiana
11 electoral voteschart
(Republican in 2000 & 2004)
| Indiana Indiana Indiana is a US state, admitted to the United States as the 19th on December 11, 1816. It is located in the Midwestern United States and Great Lakes Region. With 6,483,802 residents, the state is ranked 15th in population and 16th in population density. Indiana is ranked 38th in land area and is... opinion polls |
||||||
|---|---|---|---|---|---|---|
| Poll Source | Date administered (2008) | Democrat | % | Republican | % | Lead Margin |
| Reuters/Zogby | Oct 31-Nov 3 | Barack Obama | 45.1% | John McCain | 50.4% | |
| Public Policy Polling | Oct 31-Nov 2 | Barack Obama | 49% | John McCain | 48% | |
| Reuters/Zogby | Oct 30-Nov 2 | Barack Obama | 43.9% | John McCain | 49.1% | |
| American Research Group | Oct 28-31 | Barack Obama | 48% | John McCain | 48% | |
| SurveyUSA/ Mike Downs Center |
Oct 27-30 | Barack Obama | 47% | John McCain | 47% | |
| Rasmussen Reports | Oct 28-29 | Barack Obama | 46% | John McCain | 49% | |
| Indianapolis Star/WTHR/ Selzer & Co. |
Oct 26-28 | Barack Obama | 45.9% | John McCain | 45.3% | |
| Research 2000/WISH-TV | Oct 24-28 | Barack Obama | 47% | John McCain | 47% | |
| Reuters/Zogby | Oct 23-26 | Barack Obama | 44% | John McCain | 50.2% | |
| Research 2000/ South Bend Tribune/ WSBT-TV |
Oct 23-25 | Barack Obama | 48% | John McCain | 47% | |
| Howey/Gauge | Oct 23-25 | Barack Obama | 45% | John McCain | 47% | |
| Survey USA | Oct 21-22 | Barack Obama | 49% | John McCain | 45% | |
| Big Ten Poll | Oct 19-22 | Barack Obama | 51% | John McCain | 41% | |
| Public Policy Polling | Oct 18-19 | Barack Obama | 48% | John McCain | 46% | |
| Rasmussen Reports | Oct 7 | Barack Obama | 43% | John McCain | 50% | |
| CNN/Time Magazine/ Opinion Research |
Oct 3-6 | Barack Obama | 46% | John McCain | 51% | |
| Research 2000/WISH-TV | Sept 29-Oct 3 | Barack Obama | 46% | John McCain | 46% | |
| Research 2000 | Sept 28-29 | Barack Obama | 45% | John McCain | 46% | |
| Survey USA | Sept 28-29 | Barack Obama | 45% | John McCain | 48% | |
| Rasmussen Reports | Sept 17-18 | Barack Obama | 47% | John McCain | 49% | |
| American Research Group | Sept 14-18 | Barack Obama | 44% | John McCain | 47% | |
| Big Ten Poll | Sept 14-17 | Barack Obama | 43% | John McCain | 47% | |
| Indianapolis Star/WTHR/ Selzer & Co. |
Sept 14-16 | Barack Obama | 47% | John McCain | 44% | |
| CNN/Time Magazine/ Opinion Research |
Sept 14-16 | Barack Obama | 45% | John McCain | 51% | |
| Howey/Gauge | Aug 29-30 | Barack Obama | 43% | John McCain | 45% | |
| Rasmussen Reports | Aug 19-21 | Barack Obama | 43% | John McCain | 49% | |
| Survey USA | Aug 16-18 | Barack Obama | 44% | John McCain | 50% |
 Iowa
Iowa
7 electoral votes(Democrat in 2000)
(Republican in 2004)
| Iowa Iowa Iowa is a state located in the Midwestern United States, an area often referred to as the "American Heartland". It derives its name from the Ioway people, one of the many American Indian tribes that occupied the state at the time of European exploration. Iowa was a part of the French colony of New... opinion polls |
||||||
|---|---|---|---|---|---|---|
| Poll Source | Date administered (2008) | Democrat | % | Republican | % | Lead Margin |
| Des Moines Register/ Selzer & Co. |
Oct 28-31 | Barack Obama | 54% | John McCain | 37% | |
| SurveyUSA | Oct 28-29 | Barack Obama | 55% | John McCain | 40% | |
| Research 2000/ KCCI-TV |
Oct 27-29 | Barack Obama | 53% | John McCain | 39% | |
| Marist College | Oct 23-24 | Barack Obama | 52% | John McCain | 42% | |
| Rasmussen Reports | Oct 23 | Barack Obama | 52% | John McCain | 44% | |
| Mason-Dixon/NBC | Oct 22-23 | Barack Obama | 51% | John McCain | 40% | |
| Quad City Times/ Research 2000 |
Oct 19-22 | Barack Obama | 54% | John McCain | 39% | |
| Big Ten Poll | Oct 19-22 | Barack Obama | 52% | John McCain | 39% | |
| SurveyUSA | Oct 8-9 | Barack Obama | 54% | John McCain | 41% | |
| Research 2000/ KCCI-TV |
Sept 29-30 | Barack Obama | 55% | John McCain | 39% | |
| Rasmussen Reports | Sept 25 | Barack Obama | 51% | John McCain | 43% | |
| Marist College | Sept 18-21 | Barack Obama | 51% | John McCain | 41% | |
| American Research Group | Sept 17-20 | Barack Obama | 51% | John McCain | 44% | |
| SurveyUSA | Sept 17-18 | Barack Obama | 54% | John McCain | 43% | |
| Quad-City Times/ Lee Enterprises |
Sept 15-17 | Barack Obama | 53% | John McCain | 39% | |
| Big Ten Poll | Sept 14-17 | Barack Obama | 45% | John McCain | 45% | |
| Des Moines Register/ Selzer & Co. |
Sept 8-10 | Barack Obama | 52% | John McCain | 40% | |
| CNN/Time Magazine/ Opinion Research |
Aug 31-Sept 2 | Barack Obama | 55% | John McCain | 40% | |
| Hawkeye Poll | Aug 13 | Barack Obama | 49.5% | John McCain | 43.1% | |
| Rasmussen Reports | Aug 7 | Barack Obama | 49% | John McCain | 44% | |
| Rasmussen Reports | July 10 | Barack Obama | 51% | John McCain | 41% |
 Kansas
6 electoral votes(Republican in 2000 & 2004)
| Kansas Kansas Kansas is a US state located in the Midwestern United States. It is named after the Kansas River which flows through it, which in turn was named after the Kansa Native American tribe, which inhabited the area. The tribe's name is often said to mean "people of the wind" or "people of the south... opinion polls |
||||||
|---|---|---|---|---|---|---|
| Poll Source | Date administered (2008) | Democrat | % | Republican | % | Lead Margin |
| SurveyUSA | Oct 27-28 | Barack Obama | 37% | John McCain | 58% | |
| SurveyUSA | Oct 21-22 | Barack Obama | 41% | John McCain | 53% | |
| Rasmussen Reports | Oct 13 | Barack Obama | 41% | John McCain | 54% | |
| SurveyUSA | Sept 21-22 | Barack Obama | 41% | John McCain | 53% | |
| Rasmussen Reports | Sept 18 | Barack Obama | 38% | John McCain | 58% | |
| American Research Group | Sept 7-10 | Barack Obama | 31% | John McCain | 63% | |
| SurveyUSA | Aug 18-20 | Barack Obama | 35% | John McCain | 58% | |
| Rasmussen Reports | Aug 11 | Barack Obama | 41% | John McCain | 55% | |
| Rasmussen Reports | July 14 | Barack Obama | 35% | John McCain | 58% |
 Kentucky
8 electoral votes(Republican in 2000 & 2004)
| Kentucky Kentucky The Commonwealth of Kentucky is a state located in the East Central United States of America. As classified by the United States Census Bureau, Kentucky is a Southern state, more specifically in the East South Central region. Kentucky is one of four U.S. states constituted as a commonwealth... opinion polls |
||||||
|---|---|---|---|---|---|---|
| Poll Source | Date administered (2008) | Democrat | % | Republican | % | Lead Margin |
| Survey USA | Nov 1 | Barack Obama | 40% | John McCain | 56% | |
| Rasmussen Reports | Oct 29 | Barack Obama | 42% | John McCain | 51% | |
| Louisville Courier-Journal/ Mason-Dixon |
Oct 27-29 | Barack Obama | 43% | John McCain | 55% | |
| Research 2000/Daily Kos | Oct 27-29 | Barack Obama | 39% | John McCain | 56% | |
| Rasmussen Reports | Oct 21 | Barack Obama | 44% | John McCain | 52% | |
| Research 2000/ Lexington Herald-Leader/ WKYT-TV |
Oct 19-21 | Barack Obama | 39% | John McCain | 55% | |
| Survey USA | Oct 18-20 | Barack Obama | 41% | John McCain | 54% | |
| Research 2000/Daily Kos | Oct 15-16 | Barack Obama | 39% | John McCain | 53% | |
| Rasmussen Reports | Sept 30 | Barack Obama | 42% | John McCain | 52% | |
| Louisville Courier-Journal/ Mason-Dixon |
Sept 22-25 | Barack Obama | 41% | John McCain | 53% | |
| Survey USA | Sept 21-22 | Barack Obama | 38% | John McCain | 57% | |
| Research 2000/Daily Kos | Sept 15-17 | Barack Obama | 37% | John McCain | 55% | |
| American Research Group | Sept 8-12 | Barack Obama | 37% | John McCain | 57% | |
| Survey USA | Aug 9-11 | Barack Obama | 37% | John McCain | 55% | |
| Research 2000/Daily Kos | July 28–30 | Barack Obama | 35% | John McCain | 56% | |
| Rasmussen Reports | July 29 | Barack Obama | 43% | John McCain | 52% |
 Louisiana
9 electoral votes(Republican in 2000 & 2004)
| Louisiana Louisiana Louisiana is a state located in the southern region of the United States of America. Its capital is Baton Rouge and largest city is New Orleans. Louisiana is the only state in the U.S. with political subdivisions termed parishes, which are local governments equivalent to counties... opinion polls |
||||||
|---|---|---|---|---|---|---|
| Poll Source | Date administered (2008) | Democrat | % | Republican | % | Lead Margin |
| Loyola University/ WAFB 9News |
Oct 24-26 | Barack Obama | 40% | John McCain | 43% | |
| SE Louisiana University | Oct 20-23 | Barack Obama | 38.3% | John McCain | 50.6% | |
| Rasmussen Reports | Oct 21 | Barack Obama | 41% | John McCain | 57% | |
| Rasmussen Reports | Sept 25 | Barack Obama | 40% | John McCain | 55% | |
| American Research Group | Sept 9-12 | Barack Obama | 43% | John McCain | 50% | |
| Rasmussen Reports | Aug 17 | Barack Obama | 39% | John McCain | 57% | |
| Rasmussen Reports | July 9 | Barack Obama | 37% | John McCain | 56% |
 Maine
Maine
4 electoral votes(Democrat in 2000)
(Democrat in 2004)
| Maine Maine Maine is a state in the New England region of the northeastern United States, bordered by the Atlantic Ocean to the east and south, New Hampshire to the west, and the Canadian provinces of Quebec to the northwest and New Brunswick to the northeast. Maine is both the northernmost and easternmost... opinion polls |
||||||
|---|---|---|---|---|---|---|
| Poll Source | Date administered (2008) | Democrat | % | Republican | % | Lead Margin |
| Rasmussen Reports | Nov 1 | Barack Obama | 56% | John McCain | 43% | |
| SurveyUSA | Oct 19-20 | Barack Obama | 54% | John McCain | 39% | |
| Critical Insights | Oct 16-19 | Barack Obama | 56% | John McCain | 35% | |
| Pan Atlantic SMS | Oct 13-16 | Barack Obama | 51% | John McCain | 39% | |
| Research 2000/Daily Kos | Oct 14-15 | Barack Obama | 55% | John McCain | 38% | |
| Rasmussen Reports | Oct 2 | Barack Obama | 51% | John McCain | 46% | |
| SurveyUSA | Sept 22-23 | Barack Obama | 49% | John McCain | 44% | |
| Rasmussen Reports | Sept 17 | Barack Obama | 50% | John McCain | 46% | |
| American Research Group | Sept 8-10 | Barack Obama | 51% | John McCain | 41% | |
| Research 2000/ Daily Kos |
Sept 8-10 | Barack Obama | 52% | John McCain | 38% | |
| Rasmussen Reports | Aug 12 | Barack Obama | 53% | John McCain | 39% | |
| Rasmussen Reports | July 17 | Barack Obama | 49% | John McCain | 41% |
 Maryland
10 electoral votes(Democrat in 2000 & 2004)
| Maryland Maryland Maryland is a U.S. state located in the Mid Atlantic region of the United States, bordering Virginia, West Virginia, and the District of Columbia to its south and west; Pennsylvania to its north; and Delaware to its east... opinion polls |
||||||
|---|---|---|---|---|---|---|
| Poll Source | Date administered (2008) | Democrat | % | Republican | % | Lead Margin |
| Rasmussen Reports | Sept 20 | Barack Obama | 60% | John McCain | 37% | |
| American Research Group | Sept 17-19 | Barack Obama | 54% | John McCain | 39% | |
| Gonzales Research & Marketing Strategies |
Aug 29-Sept 5 | Barack Obama | 52% | John McCain | 38% | |
| Rasmussen Reports | Aug 18 | Barack Obama | 53% | John McCain | 43% |
 Massachusetts
12 electoral votes(Democrat in 2000 & 2004)
| Massachusetts Massachusetts The Commonwealth of Massachusetts is a state in the New England region of the northeastern United States of America. It is bordered by Rhode Island and Connecticut to the south, New York to the west, and Vermont and New Hampshire to the north; at its east lies the Atlantic Ocean. As of the 2010... opinion polls |
||||||
|---|---|---|---|---|---|---|
| Poll Source | Date administered (2008) | Democrat | % | Republican | % | Lead Margin |
| Survey USA | Oct 28 | Barack Obama | 56% | John McCain | 39% | |
| Survey USA | Oct 14 | Barack Obama | 59% | John McCain | 35% | |
| Rasmussen Reports | Oct 13 | Barack Obama | 62% | John McCain | 34% | |
| Rasmussen Reports | Sept 23 | Barack Obama | 58% | John McCain | 38% | |
| Survey USA | Sept 22-23 | Barack Obama | 55% | John McCain | 39% | |
| American Research Group | Sept 20-22 | Barack Obama | 55% | John McCain | 39% | |
| Rasmussen Reports | Aug 5 | Barack Obama | 54% | John McCain | 38% | |
| Suffolk University | July 31-Aug 3 | Barack Obama | 47% | John McCain | 38% |
 Michigan
17 electoral votes(Democrat in 2000 & 2004)
| Michigan Michigan Michigan is a U.S. state located in the Great Lakes Region of the United States of America. The name Michigan is the French form of the Ojibwa word mishigamaa, meaning "large water" or "large lake".... opinion polls |
||||||||
|---|---|---|---|---|---|---|---|---|
| Poll Source | Date administered (2008) | Democrat | % | Republican | % | Lead Margin | Others | % |
| Selzer/Detroit Free Press/WDIV | Oct 28-31 | Barack Obama | 53% | John McCain | 37% | |||
| Public Policy Polling | Oct 28-30 | Barack Obama | 55% | John McCain | 42% | |||
| Strategic Vision | Oct 27-29 | Barack Obama | 54% | John McCain | 41% | |||
| Rasmussen Reports | Oct 28 | Barack Obama | 53% | John McCain | 43% | |||
| Detroit News/ EPIC-MRA |
Oct 26-28 | Barack Obama | 50% | John McCain | 38% | |||
| Big Ten Poll | Oct 19-22 | Barack Obama | 58% | John McCain | 36% | |||
| Detroit News/ EPIC-MRA |
Oct 19-22 | Barack Obama | 51% | John McCain | 37% | |||
| Quinnipiac University/ Wall Street Journal/ Washington Post |
October 8–12 | Barack Obama | 54% | John McCain | 38% | |||
| Rasmussen Reports | October 8 | Barack Obama | 56% | John McCain | 40% | |||
| Rossman/Denno-Noor/ MIRS |
October 1–4 | Barack Obama | 44% | John McCain | 39% | Other | ~4% | |
| Public Policy Polling | September 29- October 1 |
Barack Obama | 51% | John McCain | 41% | |||
| Selzer/Detroit Free Press/ WDIV |
September 22–24 | Barack Obama | 51% | John McCain | 38% | |||
| Strategic Vision | September 22–24 | Barack Obama | 48% | John McCain | 45% | |||
| CNN/Time Magazine/ Opinion Research |
September 21–23 | Barack Obama | 49% | John McCain | 43% | |||
| NBC/Mason-Dixon | Sept 18-23 | Barack Obama | 46% | John McCain | 46% | |||
| EPIC-MRA/ Detroit News |
Sept 20-22 | Barack Obama | 48% | John McCain | 38% | |||
| Allstate/National Journal/ FD |
Sept 18-22 | Barack Obama | 47% | John McCain | 39% | |||
| Rasmussen Reports/ Fox News |
Sept 21 | Barack Obama | 51% | John McCain | 44% | |||
| Quinnipiac University/ Wall Street Journal/ Washington Post |
Sept 14-21 | Barack Obama | 48% | John McCain | 44% | |||
| American Research Group | Sept 16-19 | Barack Obama | 48% | John McCain | 46% | |||
| Marketing Resource Group of Lansing |
Sept 15-19 | Barack Obama | 43% | John McCain | 46% | |||
| Marist College | Sept 16-17 | Barack Obama | 52% | John McCain | 43% | |||
| EPIC-MRA/ Detroit News |
September 14–17 | Barack Obama | 45% | John McCain | 42% | |||
| Big Ten Poll | Sept 14-17 | Barack Obama | 48% | John McCain | 44% | |||
| Rasmussen Reports | September 10 | Barack Obama | 51% | John McCain | 46% | |||
| InsiderAdantagev/ Poll Position |
September 10 | Barack Obama | 44% | John McCain | 45% | |||
| CNN/Time Magazine/ Opinion Rsearch |
September 7–9 | Barack Obama | 45% | John McCain | 42% | |||
| Public Policy Polling | September 6–7 | Barack Obama | 47% | John McCain | 46% | |||
| Strategic Vision | September 5–7 | Barack Obama | 45% | John McCain | 44% | |||
| EPIC-MRA/ Detroit News |
Aug 18-21 | Barack Obama | 43% | John McCain | 41% | |||
| Selzer/ Detroit Free Press/ WDIV |
Aug 17-20 | Barack Obama | 46% | John McCain | 39% | |||
| Rasmussen Reports | Aug 7 | Barack Obama | 49% | John McCain | 45% | |||
| Public Policy Polling | July 23–27 | Barack Obama | 46% | John McCain | 43% | |||
| Quinnipiac University/ Wall Street Journal/ Washington Post |
July 14–22 | Barack Obama | 46% | John McCain | 42% | |||
| Detroit News/ EPIC-MRA |
July 13–16 | Barack Obama | 43% | John McCain | 41% | |||
| Rasmussen Reports | July 10 | Barack Obama | 50% | John McCain | 42% | |||
 Minnesota
10 electoral voteschart
(Democrat in 2000 & 2004)
| Minnesota Minnesota Minnesota is a U.S. state located in the Midwestern United States. The twelfth largest state of the U.S., it is the twenty-first most populous, with 5.3 million residents. Minnesota was carved out of the eastern half of the Minnesota Territory and admitted to the Union as the thirty-second state... opinion polls |
||||||
|---|---|---|---|---|---|---|
| Poll Source | Date administered (2008) | Democrat | % | Republican | % | Lead Margin |
| SurveyUSA | October 30-Nov 1 | Barack Obama | 49% | John McCain | 46% | |
| Star Tribune/Princeton Survey Research Associates International |
October 29–31 | Barack Obama | 53% | John McCain | 42% | |
| Public Policy Polling | Oct 28-30 | Barack Obama | 57% | John McCain | 41% | |
| Research 2000/Daily Kos | Oct 27-29 | Barack Obama | 53% | John McCain | 38% | |
| Rasmussen Reports | Oct 28 | Barack Obama | 55% | John McCain | 43% | |
| NBC News/Mason Dixon | Oct 27-28 | Barack Obama | 48% | John McCain | 40% | |
| University of Minnesota/ Minnesota Public Radio News |
Oct 24-28 | Barack Obama | 56% | John McCain | 37% | |
| Rasmussen Reports | Oct 22 | Barack Obama | 56% | John McCain | 41% | |
| Big Ten Poll | Oct 19-22 | Barack Obama | 57% | John McCain | 38% | |
| St. Cloud State University | Oct 14-22 | Barack Obama | 42% | John McCain | 37% | |
| National Journal/FD | Oct 16-20 | Barack Obama | 50% | John McCain | 40% | |
| SurveyUSA | October 16–18 | Barack Obama | 50% | John McCain | 44% | |
| Star Tribune/Princeton Survey Research Associates International |
October 16–17 | Barack Obama | 52% | John McCain | 41% | |
| Research 2000/Daily Kos | October 15–16 | Barack Obama | 52% | John McCain | 39% | |
| Quinnipiac University/ Wall Street Journal/ Washington Post |
October 8–12 | Barack Obama | 51% | John McCain | 40% | |
| Rasmussen Reports | Oct 7 | Barack Obama | 52% | John McCain | 45% | |
| American Research Group | Oct 4-7 | Barack Obama | 47% | John McCain | 46% | |
| Minnesota Public Radio News/Humphrey Institute |
Oct 3-5 | Barack Obama | 54% | John McCain | 40% | |
| Star Tribune/ Princeton Survey Research Associates International |
Sept 30- October 2 |
Barack Obama | 55% | John McCain | 37% | |
| SurveyUSA | Sept 30- October 1 |
Barack Obama | 46% | John McCain | 47% | |
| Minnesota Public Radio News/Humphrey Institute |
Sept 29- October 1 |
Barack Obama | 47% | John McCain | 43% | |
| CNN/Time Magazine/ Opinion Research |
Sept 28-30 | Barack Obama | 54% | John McCain | 43% | |
| Quinnipiac University/ Wall Street Journal/ Washington Post |
Sept 14-21 | Barack Obama | 47% | John McCain | 45% | |
| American Research Group | Sept 18-20 | Barack Obama | 48% | John McCain | 47% | |
| Rasmussen Reports | Sept 18 | Barack Obama | 52% | John McCain | 44% | |
| Big Ten Poll | Sept 14-17 | Barack Obama | 47% | John McCain | 45% | |
| Star Tribune Minnesota/ Princeton Survey Research Associates International |
Sept 10-12 | Barack Obama | 45% | John McCain | 45% | |
| Survey USA | Sept 10-11 | Barack Obama | 49% | John McCain | 47% | |
| CNN/Time Magazine/ Opinion Research |
Aug 31- September 2 |
Barack Obama | 53% | John McCain | 41% | |
| Minnesota Public Radio/ University of Minnesota |
Aug 7-17 | Barack Obama | 48% | John McCain | 38% | |
| Survey USA | Aug 13-14 | Barack Obama | 47% | John McCain | 45% | |
| Rasmussen Reports | Aug 13 | Barack Obama | 49% | John McCain | 45% | |
| Rasmussen Reports | July 22 | Barack Obama | 52% | John McCain | 39% | |
| Quinnipiac University/ Wall Street Journal/ Washington Post |
July 14–22 | Barack Obama | 46% | John McCain | 44% | |
| Rasmussen Reports | July 10 | Barack Obama | 54% | John McCain | 37% |
 Mississippi
6 electoral votes(Republican in 2000 & 2004)
| Mississippi Mississippi Mississippi is a U.S. state located in the Southern United States. Jackson is the state capital and largest city. The name of the state derives from the Mississippi River, which flows along its western boundary, whose name comes from the Ojibwe word misi-ziibi... opinion polls |
||||||
|---|---|---|---|---|---|---|
| Poll Source | Date administered (2008) | Democrat | % | Republican | % | Lead Margin |
| Research 2000/ Daily Kos |
Oct 27-29 | Barack Obama | 40% | John McCain | 53% | |
| Rasmussen Reports | Oct 27 | Barack Obama | 45% | John McCain | 53% | |
| Press-Register/ University of South Alabama |
Oct 13-23 | Barack Obama | 33% | John McCain | 46% | |
| Research 2000/ Daily Kos |
Oct 14-15 | Barack Obama | 40% | John McCain | 50% | |
| Rasmussen Reports | Sept 30 | Barack Obama | 44% | John McCain | 52% | |
| American Research Group | Sept 13-16 | Barack Obama | 39% | John McCain | 55% | |
| Research 2000/ Daily Kos |
Sept 8-10 | Barack Obama | 37% | John McCain | 55% | |
| Rasmussen Reports | Aug 21 | Barack Obama | 43% | John McCain | 56% | |
| Rasmussen Reports | July 28 | Barack Obama | 42% | John McCain | 54% | |
| Research 2000/ Daily Kos |
July 21–23 | Barack Obama | 42% | John McCain | 51% |
 Missouri
for earlier results11 electoral votes
chart
(Republican in 2000 & 2004)
| Missouri Missouri Missouri is a US state located in the Midwestern United States, bordered by Iowa, Illinois, Kentucky, Tennessee, Arkansas, Oklahoma, Kansas and Nebraska. With a 2010 population of 5,988,927, Missouri is the 18th most populous state in the nation and the fifth most populous in the Midwest. It... opinion polls |
||||||
|---|---|---|---|---|---|---|
| Poll Source | Date administered (2008) | Democrat | % | Republican | % | Lead Margin |
| Reuters/Zogby | Oct 31-Nov 3 | Barack Obama | 48.8% | John McCain | 48.8% | |
| Rasmussen Reports/ Fox News |
Nov 2 | Barack Obama | 49% | John McCain | 49% | |
| Public Policy Polling | Oct 31-Nov 2 | Barack Obama | 49.4% | John McCain | 48.6% | |
| Reuters/Zogby | Oct 30-Nov 2 | Barack Obama | 47.4% | John McCain | 45.7% | |
| Survey USA | Oct 30-Nov 2 | Barack Obama | 48% | John McCain | 48% | |
| American Research Group | Oct 28-30 | Barack Obama | 48% | John McCain | 48% | |
| Politico/ Insider Advantage |
Oct 29 | Barack Obama | 47% | John McCain | 50% | |
| Mason-Dixon/NBC | Oct 28-29 | Barack Obama | 46% | John McCain | 47% | |
| CNN/Time Magazine/ Opinion Research |
Oct 23-28 | Barack Obama | 48% | John McCain | 50% | |
| Rasmussen Reports/ Fox News |
Oct 26 | Barack Obama | 48% | John McCain | 47% | |
| Survey USA | Oct 25-26 | Barack Obama | 48% | John McCain | 48% | |
| Reuters/Zogby | Oct 23-26 | Barack Obama | 48.2% | John McCain | 45.7% | |
| Mason-Dixon/NBC | Oct 22-23 | Barack Obama | 45% | John McCain | 46% | |
| Research 2000/ Post-Dispatch |
Oct 20-23 | Barack Obama | 48% | John McCain | 47% | |
| Rasmussen Reports/ Fox News |
Oct 19 | Barack Obama | 49% | John McCain | 44% | |
| Suffolk University | Oct 17-19 | Barack Obama | 44% | John McCain | 45% | |
| Rasmussen Reports | Oct 15 | Barack Obama | 52% | John McCain | 46% | |
| CNN/Time Magazine/ Opinion Research |
Oct 11-14 | Barack Obama | 48% | John McCain | 49% | |
| Rasmussen Reports/ Fox News |
Oct 12 | Barack Obama | 50% | John McCain | 47% | |
| Public Policy Polling | Oct 11-12 | Barack Obama | 48% | John McCain | 46% | |
| SurveyUSA | Oct 10-12 | Barack Obama | 51% | John McCain | 43% | |
| American Research Group | Oct 4-6 | Barack Obama | 46% | John McCain | 49% | |
| Rasmussen Reports/ Fox News |
Oct 5 | Barack Obama | 50% | John McCain | 47% | |
| CNN/Time Magazine/ Opinion Research |
Sept 28-30 | Barack Obama | 49% | John McCain | 48% | |
| Survey USA | Sept 23-24 | Barack Obama | 46% | John McCain | 48% | |
| St Louis Post-Dispatch/ Research 2000 |
Sept 22-24 | Barack Obama | 47% | John McCain | 48% | |
| St Louis Post-Dispatch/ Research 2000 |
Sept 15-18 | Barack Obama | 45% | John McCain | 49% | |
| American Research Group | Sept 11-15 | Barack Obama | 45% | John McCain | 50% | |
| Rasmussen Reports | Sept 11 | Barack Obama | 46% | John McCain | 51% | |
| CNN/Time Magazine/ Opinion Research |
Sept 7-9 | Barack Obama | 44% | John McCain | 48% | |
| Public Policy Polling | Aug 13-17 | Barack Obama | 40% | John McCain | 50% | |
| Rasmussen Reports | Aug 7 | Barack Obama | 44% | John McCain | 50% | |
| Survey USA | July 29–31 | Barack Obama | 44% | John McCain | 49% | |
| Research 2000/ St. Louis Post Dispatch |
July 7–10 | Barack Obama | 48% | John McCain | 43% | |
| Rasmussen Reports | July 7 | Barack Obama | 42% | John McCain | 47% | |
| Public Policy Polling | July 2–5 | Barack Obama | 44% | John McCain | 47% |
 Montana
3 electoral votes(Republican in 2000 & 2004)
| Montana Montana Montana is a state in the Western United States. The western third of Montana contains numerous mountain ranges. Smaller, "island ranges" are found in the central third of the state, for a total of 77 named ranges of the Rocky Mountains. This geographical fact is reflected in the state's name,... opinion polls |
||||||||
|---|---|---|---|---|---|---|---|---|
| Poll Source | Date administered (2008) | Democrat | % | Republican | % | Lead Margin | Other | % |
| Public Policy Polling | Oct 31-Nov 2 | Barack Obama | 48% | John McCain | 47% | Ron Paul | 4% | |
| American Research Group | Oct 28-30 | Barack Obama | 46% | John McCain | 49% | |||
| Rsearch 2000/Daily Kos | Oct 28-30 | Barack Obama | 44% | John McCain | 48% | |||
| Rasmussen Reports | Oct 29 | Barack Obama | 46% | John McCain | 50% | |||
| NBC/Mason-Dixon | Oct 23-25 | Barack Obama | 44% | John McCain | 48% | |||
| Montana State University | Oct 16-20 | Barack Obama | 44.4% | John McCain | 40.2% | Ron Paul |
4.2% | |
| Research 2000/Daily Kos | Oct 15-16 | Barack Obama | 45% | John McCain | 49% | |||
| American Research Group | Oct 6-8 | Barack Obama | 45% | John McCain | 50% | |||
| Rasmussen Reports | Oct 1 | Barack Obama | 44% | John McCain | 52% | |||
| Research 2000/Daily Kos | Sept 22-24 | Barack Obama | 39% | John McCain | 52% | |||
| CNN/Time Magazine/ Opinion Research |
Sept 21-23 | Barack Obama | 40% | John McCain | 49% | Bob Barr | 1% | |
| Ralph Nader | 1% | |||||||
| American Research Group | Sept 7-9 | Barack Obama | 47% | John McCain | 49% | |||
| Rasmussen Reports | Sept 8 | Barack Obama | 42% | John McCain | 53% | |||
| Rasmussen Reports | July 31 | Barack Obama | 47% | John McCain | 47% | |||
 Nebraska
5 electoral votes(Republican in 2000 & 2004)
| Nebraska Nebraska Nebraska is a state on the Great Plains of the Midwestern United States. The state's capital is Lincoln and its largest city is Omaha, on the Missouri River.... opinion polls |
||||||
|---|---|---|---|---|---|---|
| Poll Source | Date administered (2008) | Democrat | % | Republican | % | Lead Margin |
| Rasmussen Reports | Sept 30 | Barack Obama | 37% | John McCain | 56% | |
| American Research Group | Sept 12-17 | Barack Obama | 34% | John McCain | 60% | |
| Rasmussen Reports | July 28 | Barack Obama | 36% | John McCain | 55% | |
| Rasmussen Reports | June 23 | Barack Obama | 36% | John McCain | 52% |
 Nevada
5 electoral voteschart
(Republican in 2000 & 2004)
| Nevada Nevada Nevada is a state in the western, mountain west, and southwestern regions of the United States. With an area of and a population of about 2.7 million, it is the 7th-largest and 35th-most populous state. Over two-thirds of Nevada's people live in the Las Vegas metropolitan area, which contains its... opinion polls |
||||||||
|---|---|---|---|---|---|---|---|---|
| Poll Source | Date administered (2008) | Democrat | % | Republican | % | Lead Margin | Others | % |
| Reuters/Zogby | Oct 31-Nov 3 | Barack Obama | 53.2% | John McCain | 42.4% | |||
| Public Policy Polling | Oct 31-Nov 2 | Barack Obama | 51% | John McCain | 47% | |||
| Reuters/Zogby | Oct 30-Nov 2 | Barack Obama | 50.7% | John McCain | 42.9% | |||
| Las Vegas Review-Journal/ Mason-Dixon |
Oct 28-29 | Barack Obama | 47% | John McCain | 43% | |||
| Reno Gazette-Journal/ Channel 2 |
Oct 23-28 | Barack Obama | 50% | John McCain | 45% | |||
| CNN/Time Magazine/ Opinion Research |
Oct 23-28 | Barack Obama | 52% | John McCain | 45% | |||
| Rasmussen Reports | Oct 27 | Barack Obama | 50% | John McCain | 46% | |||
| Suffolk University | Oct 23-26 | Barack Obama | 50% | John McCain | 40% | |||
| Reuters/Zogby | Oct 23-26 | Barack Obama | 48.2% | John McCain | 44% | |||
| Associated Press/GfK | Oct 22-26 | Barack Obama | 52% | John McCain | 40% | |||
| CNN/Time Magazine/ Opinion Research |
Oct 19-21 | Barack Obama | 51% | John McCain | 46% | |||
| Politico/ InsiderAdvantage |
Oct 20 | Barack Obama | 47% | John McCain | 47% | |||
| Rasmussen Reports | Oct 16 | Barack Obama | 50% | John McCain | 45% | |||
| InsiderAdvantage/ Poll Position |
Oct 13 | Barack Obama | 49% | John McCain | 46% | |||
| Las Vegas Review-Journal/ Mason-Dixon |
Oct 8-9 | Barack Obama | 47% | John McCain | 45% | |||
| InsiderAdvantage/ Poll Position |
Oct 6 | Barack Obama | 49% | John McCain | 47% | |||
| Reno Gazette-Journal/ Channel 2 News/ Research 2000 |
Oct 3-6 | Barack Obama | 50% | John McCain | 43% | |||
| Rasmussen Reports | Oct 2 | Barack Obama | 51% | John McCain | 47% | |||
| InsiderAdvantage/ Poll Position |
Sept 30 | Barack Obama | 48% | John McCain | 47% | |||
| CNN/Time Magazine/ Opinion Research |
Sept 28-30 | Barack Obama | 51% | John McCain | 47% | |||
| American Research Group | Sept 27-29 | Barack Obama | 47% | John McCain | 49% | |||
| Suffolk University | Sept 17-21 | Barack Obama | 45% | John McCain | 46% | |||
| Project New West/ Myers Research/ Grove Insight ** |
Sept 14-19 | Barack Obama | 47% | John McCain | 45% | |||
| American Research Group | Sept 12-14 | Barack Obama | 46% | John McCain | 49% | |||
| Rasmussen Reports | Sept 11 | Barack Obama | 46% | John McCain | 49% | |||
| InsiderAdvantage/ Poll Position |
Sept 10 | Barack Obama | 45% | John McCain | 46% | |||
| CNN/Time Magazine/ Opinion Research |
Aug 24-26 | Barack Obama | 49% | John McCain | 44% | |||
| Research 2000/ Reno Gazette-Journal/KTVN |
Aug 18-20 | Barack Obama | 44% | John McCain | 43% | |||
| Mason-Dixon/ Las Vegas Review Journal |
Aug 13-15 | Barack Obama | 39% | John McCain | 46% | |||
| Rasmussen Reports | Aug 11 | Barack Obama | 45% | John McCain | 48% | |||
| Rasmussen Reports | July 16 | Barack Obama | 47% | John McCain | 45% | |||
 New Hampshire
4 electoral voteschart
(Republican in 2000)
(Democrat in 2004)
| New Hampshire New Hampshire New Hampshire is a state in the New England region of the northeastern United States of America. The state was named after the southern English county of Hampshire. It is bordered by Massachusetts to the south, Vermont to the west, Maine and the Atlantic Ocean to the east, and the Canadian... opinion polls |
||||||||
|---|---|---|---|---|---|---|---|---|
| Poll Source | Date administered (2008) | Democrat | % | Republican | % | Lead Margin | Others | % |
| Rasmussen Reports | Oct 30 | Barack Obama | 51% | John McCain | 44% | |||
| SurveyUSA | Oct 29-30 | Barack Obama | 53% | John McCain | 42% | |||
| Univ. of New Hampshire/ WMUR |
Oct 28-30 | Barack Obama | 53% | John McCain | 39% | |||
| American Research Group | Oct 28-30 | Barack Obama | 56% | John McCain | 41% | |||
| Concord Monitor/ Research 2000 |
Oct 28-30 | Barack Obama | 51% | John McCain | 44% | |||
| Suffolk University | Oct 27-29 | Barack Obama | 53% | John McCain | 40% | |||
| Strategic Vision | Oct 27-29 | Barack Obama | 50% | John McCain | 41% | |||
| Univ. of New Hampshire/ WMUR |
Oct 25-27 | Barack Obama | 58% | John McCain | 33% | |||
| Univ. of New Hampshire/ WMUR |
Oct 24-26 | Barack Obama | 55% | John McCain | 39% | |||
| Associated Press/GfK | Oct 22-26 | Barack Obama | 55% | John McCain | 37% | |||
| NBC/Mason-Dixon | Oct 23-25 | Barack Obama | 50% | John McCain | 39% | |||
| Rasmussen Reports | Oct 23 | Barack Obama | 50% | John McCain | 46% | |||
| Marist College | Oct 22-23 | Barack Obama | 50% | John McCain | 45% | |||
| University of New Hampshire/ Boston Globe |
Oct 18-22 | Barack Obama | 54% | John McCain | 39% | |||
| Concord Mintor/ Research 2000 |
Oct 17-19 | Barack Obama | 50% | John McCain | 43% | |||
| American Research Group | Oct 6-8 | Barack Obama | 52% | John McCain | 43% | |||
| CNN/Time Magazin/ Opinion Research |
Oct 3-6 | Barack Obama | 53% | John McCain | 45% | |||
| Survey USA | Oct 4-5 | Barack Obama | 53% | John McCain | 40% | |||
| Rasmussen Reports | Oct 1 | Barack Obama | 53% | John McCain | 43% | |||
| St. Anselm/SRBI | Sept 25-30 | Barack Obama | 49% | John McCain | 37% | |||
| Concord Monitor/ Research 2000 |
Sept 22-24 | Barack Obama | 48% | John McCain | 44% | |||
| Strategic Vision | Sept 22-24 | Barack Obama | 46% | John McCain | 45% | |||
| Suffolk University | Sept 20-24 | Barack Obama | 46% | John McCain | 45% | |||
| Rasmussen Reports | Sept 23 | Barack Obama | 47% | John McCain | 49% | |||
| Allstate/National Journal/FD | Sept 18-22 | Barack Obama | 44% | John McCain | 43% | |||
| Marist College | Sept 17-21 | Barack Obama | 51% | John McCain | 45% | |||
| University of New Hampshire | Sept 14-21 | Barack Obama | 45% | John McCain | 47% | |||
| American Research Group | Sept 13-15 | Barack Obama | 45% | John McCain | 48% | Others | 1% | |
| CNN/Time Magazine/ Opinion Research |
Sept 9 | Barack Obama | 48% | John McCain | 43% | |||
| Rasmussen Reports | Aug 20 | Barack Obama | 47% | John McCain | 46% | |||
| American Research Group | Aug 18-20 | Barack Obama | 46% | John McCain | 45% | |||
| Rasmussen Reports | July 23 | Barack Obama | 49% | John McCain | 45% | |||
| American Research Group | July 19–21 | Barack Obama | 47% | John McCain | 45% | |||
| University of New Hampshire | July 11–20 | Barack Obama | 46% | John McCain | 43% | |||
 New Jersey
15 electoral votes(Democrat in 2000 & 2004)
| New Jersey New Jersey New Jersey is a state in the Northeastern and Middle Atlantic regions of the United States. , its population was 8,791,894. It is bordered on the north and east by the state of New York, on the southeast and south by the Atlantic Ocean, on the west by Pennsylvania and on the southwest by Delaware... opinion polls |
||||||
|---|---|---|---|---|---|---|
| Poll Source | Date administered (2008) | Democrat | % | Republican | % | Lead Margin |
| Rasmussen Reports | Nov 2 | Barack Obama | 57% | John McCain | 42% | |
| Monmouth University/ Gannett New Jersey |
Oct 29-31 | Barack Obama | 55% | John McCain | 34% | |
| SurveyUSA | Oct 29-30 | Barack Obama | 52% | John McCain | 42% | |
| Fairleigh Dickinson University | Oct 23-29 | Barack Obama | 53% | John McCain | 35% | |
| The Record/Research 2000 | Oct 26-28 | Barack Obama | 54% | John McCain | 38% | |
| Strategic Vision | Oct 24-26 | Barack Obama | 53% | John McCain | 38% | |
| Marist College | Oct 20-21 | Barack Obama | 56% | John McCain | 39% | |
| Quinnipiac University | Oct 16-19 | Barack Obama | 59% | John McCain | 36% | |
| Monmouth University/ Gannett New Jersey |
Oct 15-18 | Barack Obama | 55% | John McCain | 38% | |
| SurveyUSA | Oct 12 | Barack Obama | 55% | John McCain | 40% | |
| Rasmussen Reports | Oct 7 | Barack Obama | 50% | John McCain | 42% | |
| Fairleigh Dickinson University | Sept 29- October 5 |
Barack Obama | 50% | John McCain | 37% | |
| SurveyUSA | Sept 27-28 | Barack Obama | 52% | John McCain | 42% | |
| Strategic Vision | Sept 26-28 | Barack Obama | 48% | John McCain | 39% | |
| American Research Group | Sept 19-21 | Barack Obama | 51% | John McCain | 42% | |
| Rasmussen Reports | Sept 16 | Barack Obama | 55% | John McCain | 42% | |
| Strategic Vision | Sept 14-16 | Barack Obama | 47% | John McCain | 43% | |
| Monmouth University/ Gannett New Jersey |
Sept 11-14 | Barack Obama | 49% | John McCain | 41% | |
| Quinnipiac University | Sept 10-14 | Barack Obama | 48% | John McCain | 45% | |
| The Record/ Research 2000 |
Sept 9-11 | Barack Obama | 50% | John McCain | 41% | |
| Marist College | Sept 5-8 | Barack Obama | 48% | John McCain | 45% | |
| Fairleigh Dickinson University | Sept 4-7 | Barack Obama | 47% | John McCain | 41% | |
| Quinnipiac University | Aug 4-10 | Barack Obama | 51% | John McCain | 41% | |
| Rasmussen Reports | Aug 4 | Barack Obama | 52% | John McCain | 42% | |
| Monmouth University/ Gannett New Jersey |
July 17–21 | Barack Obama | 50% | John McCain | 36% | |
| Strategic Vision | July 11–13 | Barack Obama | 47% | John McCain | 38% | |
| Rasmussen Reports | July 7 | Barack Obama | 47% | John McCain | 44% |
 New Mexico
5 electoral votes(Democrat in 2000)
(Republican in 2004)
| New Mexico New Mexico New Mexico is a state located in the southwest and western regions of the United States. New Mexico is also usually considered one of the Mountain States. With a population density of 16 per square mile, New Mexico is the sixth-most sparsely inhabited U.S... opinion polls |
|||||||||||||||||||||||
|---|---|---|---|---|---|---|---|---|---|---|---|---|---|---|---|---|---|---|---|---|---|---|---|
| Poll Source | Date administered (2008) | Democrat | % | Republican | % | Lead Margin | Others | % | |||||||||||||||
| SurveyUSA | Oct 29-31 | Barack Obama | 52% | John McCain | 45% | ||||||||||||||||||
| Albuquerque Journal/ Research & Polling |
Oct 28-30 | Barack Obama | 51% | John McCain | 43% | ||||||||||||||||||
| Public Policy Polling | Oct 28-30 | Barack Obama | 58% | John McCain | 41% | ||||||||||||||||||
| Rasmussen Reports | Oct 28 | Barack Obama | 54% | John McCain | 44% | ||||||||||||||||||
| Rasmussen Reports | Oct 13 | Barack Obama | 55% | John McCain | 42% | ||||||||||||||||||
| SurveyUSA | Oct 12-13 | Barack Obama | 52% | John McCain | 45% | ||||||||||||||||||
| Albuquerque Journal/ Research & Polling |
Sept 29- October 2 |
Barack Obama | 45% | John McCain | 40% | Ralph Nader | 1% | ||||||||||||||||
| Rasmussen Reports | Oct 1 | Barack Obama | 49% | John McCain | 44% | ||||||||||||||||||
| SurveyUSA | Sept 29-30 | Barack Obama | 52% | John McCain | 44% | ||||||||||||||||||
| Public Policy Polling | Sept 17-19 | Barack Obama | 53% | John McCain | 42% | ||||||||||||||||||
| SurveyUSA | Sept 14-16 | Barack Obama | 52% | John McCain | 44% | ||||||||||||||||||
| American Research Group | Sept 14-16 | Barack Obama | 51% | John McCain | 44% | ||||||||||||||||||
| Allstate/National Journal/ FD |
Sept 11-15 | Barack Obama | 49% | John McCain | 42% | ||||||||||||||||||
| Rasmussen Reports | Sept 8 | Barack Obama | 47% | John McCain | 49% | ||||||||||||||||||
| CNN/Time Magazine/ Opinion Research |
Aug 24-26 | Barack Obama | 53% | John McCain | 40% | ||||||||||||||||||
| Rasmussen Reports | Aug 20 | Barack Obama | 48% | John McCain | 44% | ||||||||||||||||||
| Mason-Dixon | Aug 13-15 | Barack Obama | 41% | John McCain | 45% | ||||||||||||||||||
| Rasmussen Reports | July 24 | Barack Obama | 49% | John McCain | 43% | ||||||||||||||||||
 New York
31 electoral votes(Democrat in 2000 & 2004)
| New York New York New York is a state in the Northeastern region of the United States. It is the nation's third most populous state. New York is bordered by New Jersey and Pennsylvania to the south, and by Connecticut, Massachusetts and Vermont to the east... opinion polls |
||||||
|---|---|---|---|---|---|---|
| Poll Source | Date administered (2008) | Democrat | % | Republican | % | Lead Margin |
| Survey USA | Oct 27-28 | Barack Obama | 62% | John McCain | 33% | |
| Marist College | Oct 21-22 | Barack Obama | 65% | John McCain | 29% | |
| Siena College | Oct 19-21 | Barack Obama | 62% | John McCain | 31% | |
| Rasmussen Reports | Oct 14 | Barack Obama | 57% | John McCain | 37% | |
| Survey USA | Oct 11-12 | Barack Obama | 64% | John McCain | 31% | |
| Survey USA | Sept 23-24 | Barack Obama | 57% | John McCain | 38% | |
| American Research Group | Sept 14-16 | Barack Obama | 55% | John McCain | 38% | |
| Rasmussen Reports | Sept 15 | Barack Obama | 55% | John McCain | 42% | |
| Siena College | Sept 8-10 | Barack Obama | 46% | John McCain | 41% | |
| Siena College | Aug 11-14 | Barack Obama | 47% | John McCain | 39% | |
| Rasmussen Reports | Aug 4 | Barack Obama | 55% | John McCain | 36% | |
| Quinnipiac University | July 31-Aug 4 | Barack Obama | 57% | John McCain | 36% | |
| Siena College | July 17–29 | Barack Obama | 44% | John McCain | 26% | |
| Siena College | July 7–10 | Barack Obama | 50% | John McCain | 37% |
 North Carolina
15 electoral voteschart
(Republican in 2000 & 2004)
| North Carolina North Carolina North Carolina is a state located in the southeastern United States. The state borders South Carolina and Georgia to the south, Tennessee to the west and Virginia to the north. North Carolina contains 100 counties. Its capital is Raleigh, and its largest city is Charlotte... opinion polls |
||||||
|---|---|---|---|---|---|---|
| Poll Source | Date administered (2008) | Democrat | % | Republican | % | Lead Margin |
| American Research Group | Oct 31-Nov 3 | Barack Obama | 49% | John McCain | 48% | |
| Reuters/Zogby | Oct 31-Nov 3 | Barack Obama | 49.5% | John McCain | 49.1% | |
| Rasmussen Reports | Nov 2 | Barack Obama | 49% | John McCain | 50% | |
| Survey USA | Oct 30-Nov 2 | Barack Obama | 48% | John McCain | 49% | |
| Public Policy Polling | Oct 31-Nov 2 | Barack Obama | 50% | John McCain | 49% | |
| Reuters/Zogby | Oct 30-Nov 2 | Barack Obama | 47.7% | John McCain | 49.3% | |
| Research 2000/Daily Kos | Oct 28-30 | Barack Obama | 47% | John McCain | 45% | |
| Rasmussen Reports | Oct 29 | Barack Obama | 50% | John McCain | 48% | |
| Politico/ Insider Advantage |
Oct 29 | Barack Obama | 48% | John McCain | 48% | |
| Mason-Dixon/NBC | Oct 28-29 | Barack Obama | 46% | John McCain | 49% | |
| Civitas Institute/ TelOpinion |
Oct 27-29 | Barack Obama | 47% | John McCain | 46% | |
| CNN/Time Magazine/ Opinion Research |
Oct 23-28 | Barack Obama | 52% | John McCain | 46% | |
| Allstate/National Journal/FD | Oct 23-27 | Barack Obama | 47% | John McCain | 43% | |
| Rasmussen Reports/ Fox News |
Oct 26 | Barack Obama | 48% | John McCain | 49% | |
| Public Policy Polling | Oct 25-26 | Barack Obama | 49% | John McCain | 48% | |
| Reuters/Zogby | Oct 23-26 | Barack Obama | 49.7% | John McCain | 46.4% | |
| Associated Press/GfK | Oct 22-26 | Barack Obama | 48% | John McCain | 46% | |
| NBC/Mason-Dixon | Oct 23-25 | Barack Obama | 47% | John McCain | 47% | |
| Rasmussen Reports | Oct 23 | Barack Obama | 48% | John McCain | 50% | |
| WSOC-TV | Oct 20-21 | Barack Obama | 48.4% | John McCain | 46.4% | |
| CNN/Time Magazine/ Opinion Research |
Oct 19-21 | Barack Obama | 51% | John McCain | 47% | |
| InsiderAdvantage/ Politico |
Oct 20 | Barack Obama | 49% | John McCain | 48% | |
| SurveyUSA/WTVD-TV | Oct 18-20 | Barack Obama | 47% | John McCain | 47% | |
| Civitas Institute/ TelOpinion |
Oct 18-20 | Barack Obama | 48% | John McCain | 45% | |
| Rasmussen Reports/ Fox News |
Oct 19 | Barack Obama | 51% | John McCain | 48% | |
| Public Policy Polling | Oct 18-19 | Barack Obama | 51% | John McCain | 44% | |
| Winthrop University/ETV | Sept 28- October 19 |
Barack Obama | 44.6% | John McCain | 44.2% | |
| Research 2000/ Daily Kos |
Oct 14-15 | Barack Obama | 46% | John McCain | 44% | |
| InsiderAdvantage/ Poll Position |
Oct 13 | Barack Obama | 48% | John McCain | 46% | |
| Rasmussen Reports/ Fox News |
Oct 12 | Barack Obama | 48% | John McCain | 48% | |
| Public Policy Polling | Oct 11-12 | Barack Obama | 49% | John McCain | 46% | |
| Rasmussen Reports | Oct 8 | Barack Obama | 49% | John McCain | 48% | |
| Civitas/TelOpinion | Oct 6-8 | Barack Obama | 48% | John McCain | 43% | |
| WSOC-TV | Oct 6-7 | Barack Obama | 46% | John McCain | 47.8% | |
| SurveyUSA | Oct 5-6 | Barack Obama | 46% | John McCain | 49% | |
| CNN/Time Magazine/ Opinion Research |
Oct 3-6 | Barack Obama | 49% | John McCain | 49% | |
| Public Policy Polling | Oct 4-5 | Barack Obama | 50% | John McCain | 44% | |
| Rasmussen Reports | Sept 30 | Barack Obama | 50% | John McCain | 47% | |
| American Research Group | Sept 27-29 | Barack Obama | 46% | John McCain | 49% | |
| Public Policy Polling | 28 | Barack Obama | 47% | John McCain | 45% | |
| Rasmussen Reports | Sept 23 | Barack Obama | 49% | John McCain | 47% | |
| Civitas Institute/ Tel Opinion Research |
20 | Barack Obama | 45% | John McCain | 45% | |
| Public Policy Polling | Sept 17-19 | Barack Obama | 46% | John McCain | 46% | |
| Rasmussen Reports | Sept 18 | Barack Obama | 47% | John McCain | 50% | |
| CNN/Time Magazine/ Opinion Research |
Sept 14-16 | Barack Obama | 47% | John McCain | 48% | |
| American Research Group | Sept 13-16 | Barack Obama | 41% | John McCain | 52% | |
| Research 2000/ Daily Kos |
Sept 8-10 | Barack Obama | 38% | John McCain | 55% | |
| Civitas Institute/ Tel Opinion Research |
Sept 6-10 | Barack Obama | 44% | John McCain | 47% | |
| Public Policy Polling | Sept 9 | Barack Obama | 44% | John McCain | 48% | |
| SurveyUSA | Sept 6-8 | Barack Obama | 38% | John McCain | 58% | |
| Garin Hart Yang | Sept 5-7 | Barack Obama | 46% | John McCain | 49% | |
| Democracy Corps/ Greenberg Quinlan Rosner |
Aug 20-26 | Barack Obama | 44% | John McCain | 47% | |
| Public Policy Polling | Aug 23 | Barack Obama | 42% | John McCain | 45% | |
| InsiderAdvantage | Aug 19 | Barack Obama | 42.8% | John McCain | 44.5% | |
| Zogby International * | Aug 15-19 | Barack Obama | 47% | John McCain | 39% | |
| Civitas Institute/ Tel Opinion Research |
Aug 14-17 | Barack Obama | 40% | John McCain | 46% | |
| Rasmussen Reports | Aug 13 | Barack Obama | 44% | John McCain | 50% | |
| Survey USA | Aug 9-11 | Barack Obama | 45% | John McCain | 49% | |
| Research 2000/Daily Kos | July 28–30 | Barack Obama | 43% | John McCain | 47% | |
| Public Policy Polling | July 23–27 | Barack Obama | 44% | John McCain | 47% | |
| Civitas Institute/ Tel Opinion Research |
July 14–16 | Barack Obama | 40% | John McCain | 43% | |
| Rasmussen Reports | July 15 | Barack Obama | 45% | John McCain | 48% | |
| Survey USA | July 12–14 | Barack Obama | 45% | John McCain | 50% |
 North Dakota
3 electoral votes(Republican in 2000 & 2004)
| North Dakota North Dakota North Dakota is a state located in the Midwestern region of the United States of America, along the Canadian border. The state is bordered by Canada to the north, Minnesota to the east, South Dakota to the south and Montana to the west. North Dakota is the 19th-largest state by area in the U.S.... opinion polls |
||||||
|---|---|---|---|---|---|---|
| Poll Source | Date administered (2008) | Democrat | % | Republican | % | Lead Margin |
| Research 2000/Daily Kos | Oct 28-29 | Barack Obama | 46% | John McCain | 47% | |
| Research 2000/Daily Kos | Oct 14-15 | Barack Obama | 45% | John McCain | 45% | |
| The Bismarck Tribune | Oct 13-14 | Barack Obama | 44% | John McCain | 41% | |
| Minnesota State University/ Fargo Forum |
Oct 6-8 | Barack Obama | 45% | John McCain | 43% | |
| Research 2000/Daily Kos | Sept 16-17 | Barack Obama | 40% | John McCain | 53% | |
| American Research Group | Sept 15-17 | Barack Obama | 43% | John McCain | 52% | |
| Rasmussen Reports | Sept 8 | Barack Obama | 41% | John McCain | 55% | |
| North Dakota United Transportation Union/ DFM Research ** |
Aug 23-27 | Barack Obama | 43% | John McCain | 40% | |
| Research 2000/ Daily Kos |
July 21–23 | Barack Obama | 42% | John McCain | 45% | |
| Rasmussen Reports | July 8 | Barack Obama | 46% | John McCain | 47% |
 Ohio
Ohio
20 electoral voteschart
(Republican in 2000 & 2004)
| Ohio Ohio Ohio is a Midwestern state in the United States. The 34th largest state by area in the U.S.,it is the 7th‑most populous with over 11.5 million residents, containing several major American cities and seven metropolitan areas with populations of 500,000 or more.The state's capital is Columbus... opinion polls |
||||||||
|---|---|---|---|---|---|---|---|---|
| Poll Source | Date administered (2008) | Democrat | % | Republican | % | Lead Margin | Others | % |
| Reuters/Zogby | Oct 31-Nov 3 | Barack Obama | 49.4% | John McCain | 47.4% | |||
| Rasmussen Reports | Nov 2 | Barack Obama | 49% | John McCain | 49% | |||
| Strategic Vision | Oct 31-Nov 2 | Barack Obama | 46% | John McCain | 48% | |||
| Public Policy Polling | Oct 31-Nov 2 | Barack Obama | 50% | John McCain | 48% | |||
| Reuters/Zogby | Oct 30-Nov 2 | Barack Obama | 50.2% | John McCain | 43.9% | |||
| SurveyUSA | Oct 30-Nov 2 | Barack Obama | 48% | John McCain | 46% | |||
| University of Cinncinati | Oct 29-Nov 2 | Barack Obama | 51.5% | John McCain | 45.7% | |||
| Quinnipiac University | Oct 27-Nov 2 | Barack Obama | 50% | John McCain | 43% | |||
| Columbus Dispatch | Oct 22-31 | Barack Obama | 52% | John McCain | 46% | |||
| Mason-Dixon | Oct 28-29 | Barack Obama | 45% | John McCain | 47% | |||
| CNN/Time Magazine/ Opinion Research |
Oct 23-28 | Barack Obama | 51% | John McCain | 47% | |||
| SurveyUSA | Oct 26-27 | Barack Obama | 49% | John McCain | 45% | |||
| Los Angeles Times/ Bloomberg |
Oct 25-27 | Barack Obama | 49% | John McCain | 40% | |||
| Allstate/National Journal/ FD |
Oct 23-27 | Barack Obama | 48% | John McCain | 41% | |||
| Rasmussen Reports/ Fox News |
Oct 26 | Barack Obama | 49% | John McCain | 45% | |||
| Marist College | Oct 24-26 | Barack Obama | 48% | John McCain | 45% | |||
| Reuters/Zogby | Oct 23-26 | Barack Obama | 49.7% | John McCain | 45.1% | |||
| Quinnipiac University | Oct 22-26 | Barack Obama | 51% | John McCain | 42% | |||
| AP/GfK | Oct 22-26 | Barack Obama | 48% | John McCain | 41% | |||
| Public Policy Polling | Oct 21-23 | Barack Obama | 51% | John McCain | 44% | |||
| Ohio University | Oct 12-23 | Barack Obama | 57% | John McCain | 41% | |||
| Politico/ InsiderAdvantage |
Oct 22 | Barack Obama | 52% | John McCain | 42% | |||
| Strategic Vision | Oct 20-22 | Barack Obama | 45% | John McCain | 48% | |||
| Big Ten Poll | Oct 19-22 | Barack Obama | 53% | John McCain | 41% | |||
| University of Cincinnati/ Ohio News Organization |
Oct 18-22 | Barack Obama | 49% | John McCain | 46% | |||
| CNN/Time Magazine/ Opinion Research |
Oct 19-21 | Barack Obama | 50% | John McCain | 46% | |||
| Quinnipiac University | Oct 16-21 | Barack Obama | 52% | John McCain | 38% | |||
| Rasmussen Reports/ Fox News |
Oct 19 | Barack Obama | 47% | John McCain | 49% | |||
| Suffolk University | Oct 16-19 | Barack Obama | 51% | John McCain | 42% | |||
| NBC/Mason-Dixon | Oct 16-17 | Barack Obama | 45% | John McCain | 46% | |||
| Rasmussen Reports | Oct 14 | Barack Obama | 49% | John McCain | 49% | |||
| SurveyUSA | Oct 12-13 | Barack Obama | 50% | John McCain | 45% | |||
| Rasmussen Reports/ Fox News |
Oct 12 | Barack Obama | 49% | John McCain | 47% | |||
| InsiderAdvantage/ PollPosition |
Oct 9 | Barack Obama | 49% | John McCain | 44% | |||
| Strategic Vision | Oct 6-8 | Barack Obama | 48% | John McCain | 46% | |||
| Marist College | Oct 5-8 | Barack Obama | 49% | John McCain | 45% | |||
| University of Cincinnati/ Ohio News Organization |
Oct 4-8 | Barack Obama | 46% | John McCain | 48% | |||
| American Research Group | Oct 4-7 | Barack Obama | 48% | John McCain | 45% | |||
| CNN/Time Magazine/ Opinion Research |
Oct 3-6 | Barack Obama | 50% | John McCain | 47% | |||
| Rasmussen Reports/ Fox News |
Oct 5 | Barack Obama | 47% | John McCain | 48% | |||
| Public Policy Polling | Oct 4-5 | Barack Obama | 49% | John McCain | 43% | |||
| ABC News/ Washington Post |
Oct 3-5 | Barack Obama | 51% | John McCain | 45% | |||
| Columbus Dispatch | Sept 24-Oct 4 | Barack Obama | 49% | John McCain | 42% | |||
| Democracy Corps/ Greenberg Quinlan Rosner ** |
Sept 29-Oct 1 | Barack Obama | 49% | John McCain | 43% | |||
| Insider Advantage/ PollPosition |
Sept 29 | Barack Obama | 47% | John McCain | 45% | |||
| SurveyUSA | Sept 28-29 | Barack Obama | 48% | John McCain | 49% | |||
| Quinnipiac University | Sept 27-29 | Barack Obama | 50% | John McCain | 42% | |||
| Rasmussen Reports/ Fox News |
Sept 28 | Barack Obama | 47% | John McCain | 48% | |||
| Rasmussen Reports | Sept 23 | Barack Obama | 46% | John McCain | 47% | |||
| InsiderAdvantage/ Poll Position |
Sept 22 | Barack Obama | 46% | John McCain | 46% | |||
| Rasmussen Reports/ Fox News |
Sept 21 | Barack Obama | 46% | John McCain | 50% | |||
| Big Ten Poll | Sept 14-17 | Barack Obama | 46% | John McCain | 45% | |||
| University of Cincinnati/ Ohio News Organization |
Sept 12-16 | Barack Obama | 42% | John McCain | 48% | |||
| Marist College | Sept 11-15 | Barack Obama | 47% | John McCain | 45% | |||
| Allstate/National Journal/ FD |
Sept 11-15 | Barack Obama | 41% | John McCain | 42% | |||
| Fox News/ Rasmussen Reports |
Sept 14 | Barack Obama | 45% | John McCain | 48% | |||
| CNN/Time Magazine/ Opinion Research |
Sept 13-14 | Barack Obama | 49% | John McCain | 47% | |||
| Public Policy Polling | Sept 13-14 | Barack Obama | 44% | John McCain | 48% | |||
| SurveyUSA | Sept 12-14 | Barack Obama | 45% | John McCain | 49% | |||
| American Research Group | Sept 10-13 | Barack Obama | 44% | John McCain | 50% | |||
| Suffolk University | Sept 10-13 | Barack Obama | 42% | John McCain | 46% | |||
| InsiderAdvantage/ Poll Position |
Sept 10 | Barack Obama | 47% | John McCain | 48% | |||
| University of Cincinnati | Sept 5-10 | Barack Obama | 44% | John McCain | 48% | Other | 5% | |
| Strategic Version | Sept 7-9 | Barack Obama | 44% | John McCain | 48% | |||
| Quinnipiac University | Sept 5-9 | Barack Obama | 49% | John McCain | 44% | |||
| Fox News/ Rasmussen Reports |
Sept 7 | Barack Obama | 44% | John McCain | 51% | |||
| CNN/Time Magazine/ Opinion Research |
Aug 31-Sept 2 | Barack Obama | 47% | John McCain | 45% | |||
| Quinnipiac University | Aug 17-24 | Barack Obama | 44% | John McCain | 43% | |||
| The Columbus Dispatch | Aug 12-21 | Barack Obama | 41% | John McCain | 42% | |||
| Rasmussen Reports | Aug 20 | Barack Obama | 43% | John McCain | 48% | |||
| Public Policy Polling | Aug 12-14 | Barack Obama | 45% | John McCain | 45% | |||
| Quinnipiac University | July 23–29 | Barack Obama | 46% | John McCain | 44% | |||
| Rasmussen Reports | July 21 | Barack Obama | 42% | John McCain | 52% | |||
| Public Policy Polling | July 17–20 | Barack Obama | 48% | John McCain | 40% | |||
 Oklahoma
7 electoral votes(Republican in 2000 & 2004)
| Oklahoma Oklahoma Oklahoma is a state located in the South Central region of the United States of America. With an estimated 3,751,351 residents as of the 2010 census and a land area of 68,667 square miles , Oklahoma is the 28th most populous and 20th-largest state... opinion polls |
||||||
|---|---|---|---|---|---|---|
| Poll Source | Date administered (2008) | Democrat | % | Republican | % | Lead Margin |
| SurveyUSA | Oct 28-29 | Barack Obama | 34% | John McCain | 63% | |
| TVPoll.com | Oct 24-26 | Barack Obama | 34.8% | John McCain | 61.8% | |
| SurveyUSA/KFOR-TV | Oct 18-19 | Barack Obama | 35% | John McCain | 59% | |
| TVPoll.com | Oct 10-12 | Barack Obama | 31.9% | John McCain | 63.0% | |
| TVPoll.com | Oct 4-5 | Barack Obama | 29.1% | John McCain | 65.5% | |
| SurveyUSA | Sept 28-29 | Barack Obama | 34% | John McCain | 64% | |
| TVPoll.com | Sept 26-28 | Barack Obama | 26.5% | John McCain | 67.6% | |
| TVPoll.com | Sept 20-22 | Barack Obama | 26.2% | John McCain | 65.8% | |
| Research 2000/Daily Kos | Sept 16-18 | Barack Obama | 36% | John McCain | 59% | |
| American Research Group | Sept 15-18 | Barack Obama | 34% | John McCain | 61% | |
| TVPoll.com | Sept 14 | Barack Obama | 26.9% | John McCain | 69.1% | |
| Rasmussen Reports | Sept 11 | Barack Obama | 32% | John McCain | 63% | |
| TVPoll.com | Sept 7 | Barack Obama | 27.9% | John McCain | 65.9% | |
| SurveyUSA | Sept 5-7 | Barack Obama | 32% | John McCain | 65% | |
| Sooner Poll/ Tulsa World |
July 19–23 | Barack Obama | 24% | John McCain | 56% |
 Oregon
7 electoral votes(Democrat in 2000 & 2004)
| Oregon Oregon Oregon is a state in the Pacific Northwest region of the United States. It is located on the Pacific coast, with Washington to the north, California to the south, Nevada on the southeast and Idaho to the east. The Columbia and Snake rivers delineate much of Oregon's northern and eastern... opinion polls |
||||||
|---|---|---|---|---|---|---|
| Poll Source | Date administered (2008) | Democrat | % | Republican | % | Lead margin |
| Rasmussen Reports | Oct 30 | Barack Obama | 54% | John McCain | 42% | |
| SurveyUSA | Oct 29-30 | Barack Obama | 57% | John McCain | 38% | |
| Public Policy Polling | Oct 28-30 | Barack Obama | 57% | John McCain | 42% | |
| Research 2000/Daily Kos | Oct 27-29 | Barack Obama | 55% | John McCain | 39% | |
| SurveyUSA | Oct 25-26 | Barack Obama | 57% | John McCain | 38% | |
| Riley Research | Oct 10-20 | Barack Obama | 48% | John McCain | 34% | |
| Research 2000/ Daily Kos |
Oct 14-15 | Barack Obama | 53% | John McCain | 38% | |
| Rasmussen Reports | Oct 14 | Barack Obama | 54% | John McCain | 41% | |
| SurveyUSA | Oct 11-12 | Barack Obama | 57% | John McCain | 40% | |
| Grove Insight ** | Oct 7-9 | Barack Obama | 52% | John McCain | 39% | |
| Rasmussen Reports | Oct 9 | Barack Obama | 54% | John McCain | 43% | |
| Research 2000/Daily Kos | Sept 22-24 | Barack Obama | 53% | John McCain | 39% | |
| Survey USA | Sept 22-23 | Barack Obama | 52% | John McCain | 41% | |
| American Research Group | Sept 19-22 | Barack Obama | 52% | John McCain | 41% | |
| Rasmussen Reports | Sept 15 | Barack Obama | 51% | John McCain | 47% | |
| Portland Tribune/ Davis, Hibbitts & Midghall |
Sept 11-14 | Barack Obama | 50% | John McCain | 40% | |
| Hoffman Research Group ** | Sept 8-9 | Barack Obama | 46% | John McCain | 39% | |
| Rasmussen Reports | Aug 7 | Barack Obama | 52% | John McCain | 42% | |
| Survey USA | Aug 2-4 | Barack Obama | 48% | John McCain | 45% | |
| Rasmussen Reports | July 15 | Barack Obama | 49% | John McCain | 40% |
 Pennsylvania
21 electoral voteschart
(Democrat in 2000 & 2004)
| Pennsylvania Pennsylvania The Commonwealth of Pennsylvania is a U.S. state that is located in the Northeastern and Mid-Atlantic regions of the United States. The state borders Delaware and Maryland to the south, West Virginia to the southwest, Ohio to the west, New York and Ontario, Canada, to the north, and New Jersey to... opinion polls |
|||||||||
|---|---|---|---|---|---|---|---|---|---|
| Poll Source | Date administered (2008) | Democrat | % | Republican | % | Lead Margin | Others | % | |
| SurveyUSA | Oct 31-Nov 3 | Barack Obama | 52% | John McCain | 43% | ||||
| Reuters/Zogby | Oct 31-Nov 3 | Barack Obama | 51.2% | John McCain | 41.4% | ||||
| Strategic Vision | Oct 31-Nov 2 | Barack Obama | 51% | John McCain | 44% | ||||
| Public Policy Polling | Oct 31-Nov 2 | Barack Obama | 53% | John McCain | 45% | ||||
| Reuters/Zogby | Oct 30-Nov 2 | Barack Obama | 53.7% | John McCain | 40% | ||||
| Muhlenberg College/ Morning Call |
Oct 29-Nov 2 | Barack Obama | 52% | John McCain | 46% | ||||
| Quinnipiac University | Oct 27-Nov 2 | Barack Obama | 52% | John McCain | 42% | ||||
| Rasmussen Reports | Nov 1 | Barack Obama | 52% | John McCain | 46% | ||||
| SurveyUSA | Oct 29-31 | Barack Obama | 51% | John McCain | 44% | ||||
| American Research Group | Oct 29-31 | Barack Obama | 51% | John McCain | 45% | ||||
| Muhlenberg College/ Morning Call |
Oct 27-31 | Barack Obama | 52% | John McCain | 44% | ||||
| Rasmussen Reports | Oct 30 | Barack Obama | 51% | John McCain | 47% | ||||
| Muhlenberg College/ Morning Call |
Oct 26-30 | Barack Obama | 53% | John McCain | 43% | ||||
| Mason-Dixon/NBC | Oct 28-29 | Barack Obama | 47% | John McCain | 43% | ||||
| Strategic Vision | Oct 27-29 | Barack Obama | 49% | John McCain | 44% | ||||
| Muhlenberg College/ Morning Call |
Oct 25-29 | Barack Obama | 53% | John McCain | 40% | ||||
| NBC/Mason-Dixon | Oct 27-28 | Barack Obama | 47% | John McCain | 43% | ||||
| CNN/Time Magazine/ Opinion Research |
Oct 23-28 | Barack Obama | 55% | John McCain | 43% | ||||
| Rasmussen Reports | Oct 27 | Barack Obama | 53% | John McCain | 46% | ||||
| Marist College | Oct 26-27 | Barack Obama | 55% | John McCain | 41% | ||||
| Politico/ InsiderAdvantage |
Oct 26 | Barack Obama | 51% | John McCain | 42% | ||||
| Quinnipiac University | Oct 22-26 | Barack Obama | 53% | John McCain | 41% | ||||
| Associated Press/GfK | Oct 22-26 | Barack Obama | 52% | John McCain | 40% | ||||
| Muhlenberg College/ Morning Call |
Oct 22-26 | Barack Obama | 53% | John McCain | 40% | ||||
| Franklin & Marshall College | Oct 21-26 | Barack Obama | 53% | John McCain | 40% | ||||
| Temple University | Oct 20-26 | Barack Obama | 50% | John McCain | 41% | ||||
| Muhlenberg College/ Morning Call |
Oct 19-23 | Barack Obama | 52% | John McCain | 40% | ||||
| Strategic Vision | Oct 20-22 | Barack Obama | 50% | John McCain | 43% | ||||
| Big Ten Poll | Oct 19-22 | Barack Obama | 52% | John McCain | 41% | ||||
| SurveyUSA | Oct 21 | Barack Obama | 53% | John McCain | 41% | ||||
| Quinnipiac University | Oct 16-21 | Barack Obama | 53% | John McCain | 40% | ||||
| National Journal/FD | Oct 16-20 | Barack Obama | 51% | John McCain | 41% | ||||
| Muhlenberg College/ Morning Call |
Oct 15-19 | Barack Obama | 53% | John McCain | 41% | ||||
| Susquehanna Polling and Research/ Pittsburgh Tribune-Review |
Oct 16-18 | Barack Obama | 48% | John McCain | 40% | ||||
| Muhlenberg College/ Morning Call |
Oct 11-15 | Barack Obama | 53% | John McCain | 37% | ||||
| SurveyUSA | Oct 11-13 | Barack Obama | 55% | John McCain | 40% | ||||
| Marist College | Oct 5-8 | Barack Obama | 53% | John McCain | 41% | ||||
| Strategic Vision | Oct 5-7 | Barack Obama | 54% | John McCain | 40% | ||||
| Muhlenberg College/ Morning Call |
Oct 3-7 | Barack Obama | 50% | John McCain | 38% | ||||
| Rasmussen Reports | Oct 6 | Barack Obama | 54% | John McCain | 41% | ||||
| SurveyUSA | Oct 5-6 | Barack Obama | 55% | John McCain | 40% | ||||
| Muhlenberg College/ Morning Call |
Oct 1-5 | Barack Obama | 49% | John McCain | 38% | ||||
| Muhlenberg College/ Morning Call |
Sept 30- October 3 |
Barack Obama | 51% | John McCain | 39% | ||||
| Muhlenberg College/ Morning Call |
Sept 27- October 1 |
Barack Obama | 50% | John McCain | 41% | ||||
| Quinnipiac University | Sept 27-29 | Barack Obama | 54% | John McCain | 39% | ||||
| Muhlenberg College/ Morning Call |
Sept 25-29 | Barack Obama | 49% | John McCain | 41% | ||||
| Rasmussen Reports/ Fox News |
Sept 28 | Barack Obama | 50% | John McCain | 42% | ||||
| Muhlenberg College/ Morning Call |
Sept 24-28 | Barack Obama | 49% | John McCain | 42% | ||||
| Franklin & Marshall | Sept 23-28 | Barack Obama | 45% | John McCain | 38% | ||||
| Rasmussen Reports | Sept 24 | Barack Obama | 49% | John McCain | 45% | ||||
| SurveyUSA | Sept 23-24 | Barack Obama | 50% | John McCain | 44% | ||||
| Muhlenberg College/ Morning Call |
Sept 21-24 | Barack Obama | 47% | John McCain | 43% | ||||
| CNN/Time Magazine/ Opinion Research |
Sept 21-23 | Barack Obama | 51% | John McCain | 43% | Bob Barr | 1% | ||
| Ralph Nader | 3% | ||||||||
| American Research Group | Sept 20-22 | Barack Obama | 50% | John McCain | 46% | ||||
| Strategic Vision | Sept 20-22 | Barack Obama | 47% | John McCain | 46% | ||||
| Allstate/National Journal/FD | Sept 18-22 | Barack Obama | 43% | John McCain | 41% | ||||
| Fox News/ Rasmussen Reports |
Sept 21 | Barack Obama | 48% | John McCain | 45% | ||||
| NBC/Mason-Dixon | Sept 16-18 | Barack Obama | 46% | John McCain | 44% | ||||
| Big Ten Poll | Sept 14-17 | Barack Obama | 45% | John McCain | 45% | ||||
| Marist College | Sept 11-15 | Barack Obama | 49% | John McCain | 44% | ||||
| Fox News/ Rasmussen Reports |
Sept 14 | Barack Obama | 47% | John McCain | 47% | ||||
| Quinnipiac University | Sept 5-9 | Barack Obama | 48% | John McCain | 45% | ||||
| Fox News/ Rasmussen Reports |
Sept 8 | Barack Obama | 47% | John McCain | 45% | ||||
| Strategic Vision | Sept 5-7 | Barack Obama | 47% | John McCain | 45% | ||||
| CNN/Time Magazine/ Opinion Research |
Aug 24-26 | Barack Obama | 48% | John McCain | 43% | ||||
| Quinnipiac University | Aug 17-24 | Barack Obama | 49% | John McCain | 42% | ||||
| Rasmussen Reports | Aug 19 | Barack Obama | 48% | John McCain | 45% | ||||
| Susquehanna Polling & Research |
Aug 11-14 | Barack Obama | 46% | John McCain | 41% | ||||
| Franklin & Marshall College | Aug 4-10 | Barack Obama | 46% | John McCain | 41% | ||||
| Quinnipiac University | July 23–29 | Barack Obama | 49% | John McCain | 42% | ||||
| Strategic Vision | July 25–27 | Barack Obama | 49% | John McCain | 40% | ||||
| Rasmussen Reports | July 23 | Barack Obama | 51% | John McCain | 45% | ||||
 Rhode Island
4 electoral votes(Democrat in 2000 & 2004)
| Rhode Island Rhode Island The state of Rhode Island and Providence Plantations, more commonly referred to as Rhode Island , is a state in the New England region of the United States. It is the smallest U.S. state by area... opinion polls |
||||||
|---|---|---|---|---|---|---|
| Poll Source | Date administered (2008) | Democrat | % | Republican | % | Lead Margin |
| Rhode Island College | Sept 17-24 | Barack Obama | 47% | John McCain | 34% | |
| Brown University | Sept 15-16 | Barack Obama | 47% | John McCain | 34% | |
| Rasmussen Reports | Sept 13 | Barack Obama | 58% | John McCain | 39% | |
| American Research Group | Sept 11-13 | Barack Obama | 59% | John McCain | 33% | |
| Brown University | Aug 18-20 | Barack Obama | 50% | John McCain | 30% |
 South Carolina
8 electoral votes(Republican in 2000 & 2004)
| South Carolina South Carolina South Carolina is a state in the Deep South of the United States that borders Georgia to the south, North Carolina to the north, and the Atlantic Ocean to the east. Originally part of the Province of Carolina, the Province of South Carolina was one of the 13 colonies that declared independence... opinion polls |
||||||
|---|---|---|---|---|---|---|
| Poll Source | Date administered (2008) | Democrat | % | Republican | % | Lead Margin |
| Survey USA | Oct 28-29 | Barack Obama | 44% | John McCain | 52% | |
| NBC/Princeton Survey Research |
Oct 25-28 | Barack Obama | 42% | John McCain | 53% | |
| Rasmussen Reports | Oct 20 | Barack Obama | 43% | John McCain | 54% | |
| Winthrop University/ETV | Sept 28-Oct 19 | Barack Obama | 34.9% | John McCain | 55.1% | |
| Survey USA | Oct 12-13 | Barack Obama | 41% | John McCain | 55% | |
| Research 2000/Daily Kos | Sept 22-24 | Barack Obama | 39% | John McCain | 54% | |
| Survey USA | Sept 21-22 | Barack Obama | 39% | John McCain | 58% | |
| Rasmussen Reports | Sept 18 | Barack Obama | 45% | John McCain | 51% | |
| American Research Group | Sept 14-17 | Barack Obama | 37% | John McCain | 59% | |
| Research 2000/Daily Kos | July 22–23 | Barack Obama | 40% | John McCain | 53% | |
| Public Policy Polling | July 9–11 | Barack Obama | 39% | John McCain | 45% |
 South Dakota
3 electoral votes(Republican in 2000 & 2004)
| South Dakota South Dakota South Dakota is a state located in the Midwestern region of the United States. It is named after the Lakota and Dakota Sioux American Indian tribes. Once a part of Dakota Territory, South Dakota became a state on November 2, 1889. The state has an area of and an estimated population of just over... opinion polls |
||||||
|---|---|---|---|---|---|---|
| Poll Source | Date administered (2008) | Democrat | % | Republican | % | Lead Margin |
| Rasmussen Reports | Oct 30 | Barack Obama | 44% | John McCain | 53% | |
| Research 2000/Daily Kos | Oct 22-24 | Barack Obama | 41% | John McCain | 50% | |
| Argus Leader Media/KELO-TV | Oct 13-15 | Barack Obama | 41% | John McCain | 48% | |
| American Research Group | Sept 19-21 | Barack Obama | 39% | John McCain | 55% | |
| Rasmussen Reports | Sept 9 | Barack Obama | 37% | John McCain | 54% | |
| Rasmussen Reports | July 9 | Barack Obama | 43% | John McCain | 47% |
 Tennessee
11 electoral votes(Republican in 2000 & 2004)
| Tennessee Tennessee Tennessee is a U.S. state located in the Southeastern United States. It has a population of 6,346,105, making it the nation's 17th-largest state by population, and covers , making it the 36th-largest by total land area... opinion polls |
||||||
|---|---|---|---|---|---|---|
| Poll Source | Date administered (2008) | Democrat | % | Republican | % | Lead Margin |
| Research 2000/Daily Kos | Oct 21-22 | Barack Obama | 38% | John McCain | 54% | |
| Rasmussen Reports | Oct 16 | Barack Obama | 42% | John McCain | 54% | |
| Rasmussen Reports | Sept 29 | Barack Obama | 39% | John McCain | 58% | |
| Middle Tennessee State University | Sept 15-27 | Barack Obama | 36% | John McCain | 48% | |
| Mason-Dixon | Sept 22-24 | Barack Obama | 39% | John McCain | 55% | |
| American Research Group | Sept 16-19 | Barack Obama | 36% | John McCain | 59% | |
| Rasmussen Reports | Aug 20 | Barack Obama | 35% | John McCain | 60% | |
| Ayres, McHenry & Associates ** | Aug 10-12 | Barack Obama | 36% | John McCain | 51% |
 Texas
Texas
34 electoral votes(Republican in 2000 & 2004)
| Texas Texas Texas is the second largest U.S. state by both area and population, and the largest state by area in the contiguous United States.The name, based on the Caddo word "Tejas" meaning "friends" or "allies", was applied by the Spanish to the Caddo themselves and to the region of their settlement in... opinion polls |
||||||
|---|---|---|---|---|---|---|
| Poll Source | Date administered (2008) | Democrat | % | Republican | % | Lead Margin |
| University of Texas | Oct 15-22 | Barack Obama | 40% | John McCain | 51% | |
| Rasmussen Reports | Oct 21 | Barack Obama | 44% | John McCain | 54% | |
| Research 2000/Daily Kos | Oct 14-15 | Barack Obama | 40% | John McCain | 52% | |
| American Research Group | Oct 5-8 | Barack Obama | 38% | John McCain | 57% | |
| Rasmussen Reports | Sept 29 | Barack Obama | 43% | John McCain | 52% | |
| American Research Group | Sept 13-16 | Barack Obama | 36% | John McCain | 57% | |
| Rasmussen Reports | Aug 21 | Barack Obama | 44% | John McCain | 54% | |
| University of Texas | July 18–30 | Barack Obama | 33% | John McCain | 43% | |
| Rasmussen Reports | July 29 | Barack Obama | 44% | John McCain | 52% |
 Utah
Utah
5 electoral votes(Republican in 2000 & 2004)
| Utah Utah Utah is a state in the Western United States. It was the 45th state to join the Union, on January 4, 1896. Approximately 80% of Utah's 2,763,885 people live along the Wasatch Front, centering on Salt Lake City. This leaves vast expanses of the state nearly uninhabited, making the population the... opinion polls |
||||||
|---|---|---|---|---|---|---|
| Poll Source | Date administered (2008) | Democrat | % | Republican | % | Lead Margin |
| Deseret News/KSL-TV Dan Jones & Associates |
Oct 24-30 | Barack Obama | 32% | John McCain | 57% | |
| American Research Group | Sept 10-13 | Barack Obama | 29% | John McCain | 65% | |
| Rasmussen Reports | Sept 10 | Barack Obama | 32% | John McCain | 64% | |
| Deseret News/ Dan Jones & Associates |
Sept 8-11 | Barack Obama | 24% | John McCain | 62% | |
| Mason Dixon | Aug 13-15 | Barack Obama | 23% | John McCain | 62% |
 Vermont
Winner: Barack Obama3 electoral votes
(Democrat in 2000 & 2004)
| Vermont Vermont Vermont is a state in the New England region of the northeastern United States of America. The state ranks 43rd in land area, , and 45th in total area. Its population according to the 2010 census, 630,337, is the second smallest in the country, larger only than Wyoming. It is the only New England... opinion polls |
||||||
|---|---|---|---|---|---|---|
| Poll Source | Date administered (2008) | Democrat | % | Republican | % | Lead Margin |
| Rasmussen Reports | Oct 6 | Barack Obama | 65% | John McCain | 32% | |
| American Research Group | Sept 18-22 | Barack Obama | 56% | John McCain | 38% | |
| Research 2000 | Sept 14 | Barack Obama | 55% | John McCain | 36% | |
| Rasmussen Reports | Sept 13 | Barack Obama | 60% | John McCain | 36% |
 Virginia
13 electoral voteschart
(Republican in 2000 & 2004)
| Virginia Virginia The Commonwealth of Virginia , is a U.S. state on the Atlantic Coast of the Southern United States. Virginia is nicknamed the "Old Dominion" and sometimes the "Mother of Presidents" after the eight U.S. presidents born there... opinion polls |
||||||||
|---|---|---|---|---|---|---|---|---|
| Poll Source | Date administered (2008) | Democrat | % | Republican | % | Lead Margin | Others | % |
| American Research Group | Oct 31-Nov 3 | Barack Obama | 51% | John McCain | 47% | |||
| Reuters/Zogby | Oct 31-Nov 3 | Barack Obama | 51.7% | John McCain | 45.3% | |||
| Rasmussen Reports/ Fox News |
Nov 2 | Barack Obama | 51% | John McCain | 47% | |||
| Public Policy Polling | Oct 31-Nov 2 | Barack Obama | 52% | John McCain | 46% | |||
| Reuters/Zogby | Oct 30-Nov 2 | Barack Obama | 50.7% | John McCain | 44.6% | |||
| SurveyUSA | Oct 30-Nov 1 | Barack Obama | 50% | John McCain | 46% | |||
| Mason-Dixon/ Richmond Times-Dispatch |
Oct 29-30 | Barack Obama | 47% | John McCain | 44% | |||
| CNN/Time Magazine/ Opinion Research |
Oct 23-28 | Barack Obama | 53% | John McCain | 44% | |||
| Marist College | Oct 26-27 | Barack Obama | 51% | John McCain | 47% | |||
| Allstate/National Journal/FD | Oct 23-27 | Barack Obama | 48% | John McCain | 44% | |||
| Rasmussen Reports/ Fox News |
Oct 26 | Barack Obama | 51% | John McCain | 47% | |||
| SurveyUSA | Oct 25-26 | Barack Obama | 52% | John McCain | 43% | |||
| Reuters/Zogby | Oct 23-26 | Barack Obama | 52% | John McCain | 44.8% | |||
| Associated Press/GfK | Oct 22-26 | Barack Obama | 49% | John McCain | 42% | |||
| Roanoke College | Oct 19-26 | Barack Obama | 48% | John McCain | 39% | |||
| News/ Washington Post |
Oct 22-25 | Barack Obama | 52% | John McCain | 44% | |||
| Public Policy Polling | Oct 21-23 | Barack Obama | 51% | John McCain | 43% | |||
| Virginia Commonwealth University |
Oct 20-22 | Barack Obama | 51% | John McCain | 40% | |||
| NBC/Mason-Dixon | Oct 20-21 | Barack Obama | 47% | John McCain | 45% | |||
| CNN/Time Magazine/ Opinion Research |
Oct 19-21 | Barack Obama | 54% | John McCain | 44% | |||
| SurveyUSA | Oct 18-19 | Barack Obama | 51% | John McCain | 45% | |||
| Winthrop University/ETV | Sept 28-Oct 19 | Barack Obama | 44.6% | John McCain | 43.6% | |||
| Rasmussen Reports | Oct 16 | Barack Obama | 54% | John McCain | 44% | |||
| CNN/Time Magazine/ Opinion Research |
Oct 11-14 | Barack Obama | 53% | John McCain | 43% | |||
| Christopher Newport University |
Oct 11-14 | Barack Obama | 49.2% | John McCain | 43.2% | |||
| Rasmussen Reports/ Fox News |
Oct 12 | Barack Obama | 50% | John McCain | 47% | |||
| Public Policy Polling | Oct 6-7 | Barack Obama | 51% | John McCain | 43% | |||
| Rasmussen Reports/ Fox News |
Oct 5 | Barack Obama | 50% | John McCain | 48% | |||
| SurveyUSA | Oct 4-5 | Barack Obama | 53% | John McCain | 43% | |||
| Suffolk University | Oct 3-5 | Barack Obama | 51% | John McCain | 39% | |||
| Mason-Dixon/ Richmond Times-Dispatch |
Sept 28-Oct 1 | Barack Obama | 45% | John McCain | 48% | |||
| CNN/Time Magazine/ Opinion Research |
Sept 28- 30 | Barack Obama | 53% | John McCain | 44% | |||
| Insider Advantage/ Poll Position |
Sept 29 | Barack Obama | 51% | John McCain | 45% | |||
| American Research Group | Sept 27-29 | Barack Obama | 46% | John McCain | 49% | |||
| Rasmussen Reports/ Fox News |
Sept 28 | Barack Obama | 50% | John McCain | 47% | |||
| Rasmussen Reports | Sept 25 | Barack Obama | 50% | John McCain | 45% | |||
| NBC/Mason-Dixon | Sept 17- 22 | Barack Obama | 44% | John McCain | 47% | |||
| Rasmussen Reports/ Fox News |
Sept 21 | Barack Obama | 48% | John McCain | 50% | |||
| SurveyUSA | Sept 19- 21 | Barack Obama | 51% | John McCain | 45% | |||
| ABC News/ Washington Post |
Sept 18- 21 | Barack Obama | 49% | John McCain | 46% | |||
| American Research Group | Sept 17- 20 | Barack Obama | 46% | John McCain | 48% | |||
| Insider Advantage/ Poll Position |
Sept 17 | Barack Obama | 46% | John McCain | 48% | |||
| Allstate/National Journal/FD | Sept 11-15 | Barack Obama | 41% | John McCain | 48% | |||
| Fox News/ Rasmussen Reports |
Sept 14 | Barack Obama | 48% | John McCain | 48% | |||
| Public Policy Polling | Sept 13-14 | Barack Obama | 48% | John McCain | 46% | |||
| SurveyUSA | Sept 12-14 | Barack Obama | 50% | John McCain | 46% | |||
| Christopher Newport University |
Sept 10-14 | Barack Obama | 39% | John McCain | 48% | |||
| CNN/Time Magazine/ Opinion Research |
Sept 9 | Barack Obama | 43% | John McCain | 49% | |||
| Fox News/ Rasmussen Reports |
Sept 7 | Barack Obama | 47% | John McCain | 49% | |||
| SurveyUSA | Sept 5-7 | Barack Obama | 47% | John McCain | 49% | |||
| Public Policy Polling | Aug 20-22 | Barack Obama | 47% | John McCain | 45% | |||
| InsiderAdvantage/ Majority Opinion Research |
Aug 12 | Barack Obama | 42.6% | John McCain | 43.1% | |||
| Rasmussen Reports | Aug 12 | Barack Obama | 47% | John McCain | 48% | |||
| SurveyUSA | Aug 8-10 | Barack Obama | 47% | John McCain | 48% | |||
| Public Policy Polling | July 17–20 | Barack Obama | 46% | John McCain | 44% | |||
| Rasmussen Reports | July 16 | Barack Obama | 47% | John McCain | 48% | |||
 Washington
11 electoral votes(Democrat in 2000 & 2004)
| Washington opinion polls | ||||||
|---|---|---|---|---|---|---|
| Poll Source | Date administered (2008) | Democrat | % | Republican | % | Lead Margin |
| Strategic Vision | Oct 31-Nov 2 | Barack Obama | 55% | John McCain | 40% | |
| SurveyUSA | Oct 30-Nov 2 | Barack Obama | 56% | John McCain | 40% | |
| The Washington Poll/ Pacific Market Research |
Oct 27-31 | Barack Obama | 51% | John McCain | 39% | |
| SurveyUSA | Oct 26-27 | Barack Obama | 56% | John McCain | 39% | |
| Strategic Vision | Oct 25-26 | Barack Obama | 54% | John McCain | 42% | |
| The Washington Poll/ Pacific Market Research |
Oct 18-26 | Barack Obama | 55% | John McCain | 34% | |
| Rasmussen Reports | Oct 22 | Barack Obama | 54% | John McCain | 43% | |
| Elway Poll | Oct 16-19 | Barack Obama | 55% | John McCain | 36% | |
| SurveyUSA | Oct 12-13 | Barack Obama | 56% | John McCain | 40% | |
| Rasmussen Reports | Oct 2 | Barack Obama | 53% | John McCain | 43% | |
| SurveyUSA | Sept 21-22 | Barack Obama | 54% | John McCain | 43% | |
| American Research Group | Sept 16-18 | Barack Obama | 50% | John McCain | 44% | |
| Strategic Vision | Sept 14-16 | Barack Obama | 47% | John McCain | 42% | |
| Rasmussen Reports | Sept 10 | Barack Obama | 49% | John McCain | 47% | |
| Elway Poll | Sept 6-8 | Barack Obama | 46% | John McCain | 37% | |
| SurveyUSA | Sept 5-7 | Barack Obama | 49% | John McCain | 45% | |
| SurveyUSA | Aug 11-12 | Barack Obama | 51% | John McCain | 44% | |
| Rasmussen Reports | Aug 6 | Barack Obama | 54% | John McCain | 42% | |
| Elway Poll | July 27–31 | Barack Obama | 47% | John McCain | 35% | |
| Strategic Vision | July 25–27 | Barack Obama | 48% | John McCain | 37% | |
| SurveyUSA | July 13–15 | Barack Obama | 55% | John McCain | 39% | |
| Moore Information | July 9–10 | Barack Obama | 47% | John McCain | 37% | |
| Rasmussen Reports | July 9 | Barack Obama | 51% | John McCain | 43% |
 West Virginia
5 electoral votes(Republican in 2000 & 2004)
| West Virginia West Virginia West Virginia is a state in the Appalachian and Southeastern regions of the United States, bordered by Virginia to the southeast, Kentucky to the southwest, Ohio to the northwest, Pennsylvania to the northeast and Maryland to the east... opinion polls |
||||||||
|---|---|---|---|---|---|---|---|---|
| Poll Source | Date administered (2008) | Democrat | % | Republican | % | Lead Margin | Other | % |
| American Research Group |
Oct 31-Nov 3 | Barack Obama | 42% | John McCain | 53% | |||
| Public Policy Polling | Oct 29-30 | Barack Obama | 42% | John McCain | 55% | |||
| Reuters/Zogby | Oct 23-26 | Barack Obama | 40.4% | John McCain | 50.3% | |||
| Research 2000/ Daily Kos |
Oct 22-24 | Barack Obama | 43% | John McCain | 49% | |||
| Wesleyan College/ The State Journal |
Oct 20-21 | Barack Obama | 43.5% | John McCain | 49.2% | |||
| CNN/Time Magazine/ Opinion Research |
Oct 19-21 | Barack Obama | 44% | John McCain | 53% | |||
| Rasmussen Reports | Oct 20 | Barack Obama | 43% | John McCain | 52% | |||
| NBC/Mason-Dixon | Oct 16-17 | Barack Obama | 41% | John McCain | 47% | |||
| Public Policy Polling | Oct 16-17 | Barack Obama | 42% | John McCain | 50% | |||
| Rainmaker Media Group | Oct 14-15 | Barack Obama | 41% | John McCain | 42% | |||
| InsiderAdvantage/ Poll Position |
Oct 13 | Barack Obama | 47% | John McCain | 49% | |||
| American Research Group |
Oct 4-8 | Barack Obama | 50% | John McCain | 42% | |||
| Rasmussen Reports | Sept 24 | Barack Obama | 42% | John McCain | 50% | |||
| CNN/Time Magazine/ Opinion Research |
Sept 21-23 | Barack Obama | 44% | John McCain | 49% | |||
| American Research Group |
Sept 14-16 | Barack Obama | 45% | John McCain | 49% | |||
| Mark Blankenship Enterprises |
Sept 6-7 | Barack Obama | 39% | John McCain | 44% | |||
 Wisconsin
10 electoral voteschart
(Democrat in 2000 & 2004)
| Wisconsin Wisconsin Wisconsin is a U.S. state located in the north-central United States and is part of the Midwest. It is bordered by Minnesota to the west, Iowa to the southwest, Illinois to the south, Lake Michigan to the east, Michigan to the northeast, and Lake Superior to the north. Wisconsin's capital is... opinion polls |
||||||
|---|---|---|---|---|---|---|
| Poll Source | Date administered (2008) | Democrat | % | Republican | % | Lead Margin |
| Strategic Vision | Oct 31-Nov 2 | Barack Obama | 53% | John McCain | 40% | |
| SurveyUSA | Oct 28-29 | Barack Obama | 55% | John McCain | 39% | |
| Research 2000/ WISC-TV |
Oct 27-28 | Barack Obama | 53% | John McCain | 42% | |
| UW Badger Poll | Oct 21-28 | Barack Obama | 52% | John McCain | 42% | |
| Strategic Vision | Oct 24-26 | Barack Obama | 50% | John McCain | 41% | |
| Rasmussen Reports | Oct 23 | Barack Obama | 51% | John McCain | 44% | |
| Big Ten Poll | Oct 19-22 | Barack Obama | 53% | John McCain | 40% | |
| Research 2000/ WISC-TV |
Oct 20-21 | Barack Obama | 52% | John McCain | 41% | |
| National Journal/FD | Oct 16-20 | Barack Obama | 53% | John McCain | 40% | |
| SurveyUSA | Oct 18-19 | Barack Obama | 51% | John McCain | 43% | |
| NBC/Mason-Dixon | Oct 16-17 | Barack Obama | 51% | John McCain | 39% | |
| Wisconsin Public Radio/ St Norbert College |
Oct 9-17 | Barack Obama | 51% | John McCain | 38% | |
| University of Wisconsin-Milwaukee |
Oct 8-15 | Barack Obama | 51% | John McCain | 36% | |
| Quinnipiac University/ Wall Street Journal/ Washington Post |
Oct 8-12 | Barack Obama | 54% | John McCain | 37% | |
| Rasmussen Reports | Oct 6 | Barack Obama | 54% | John McCain | 44% | |
| Research 2000 | Oct 5-6 | Barack Obama | 51% | John McCain | 41% | |
| SurveyUSA | Oct 5-6 | Barack Obama | 52% | John McCain | 42% | |
| CNN/Time Magazine/ Opinion Research |
Oct 3-6 | Barack Obama | 51% | John McCain | 46% | |
| Strategic Vision | Sept 22-26 | Barack Obama | 49% | John McCain | 40% | |
| WISC-TV/Research 2000 | Sept 23-24 | Barack Obama | 49% | John McCain | 43% | |
| American Research Group | Sept 18-21 | Barack Obama | 50% | John McCain | 45% | |
| Quinnipiac University/ Wall Street Journal/ Washington Post |
Sept 14-21 | Barack Obama | 49% | John McCain | 42% | |
| Big Ten Poll | Sept 14-17 | Barack Obama | 45% | John McCain | 44% | |
| CNN/Time Magazine/ Opinion Research |
Sept 14-16 | Barack Obama | 50% | John McCain | 47% | |
| Rasmussen Reports | Sept 15 | Barack Obama | 48% | John McCain | 46% | |
| Strategic Vision | Sept 5-7 | Barack Obama | 46% | John McCain | 43% | |
| Strategic Vision | Aug 8-10 | Barack Obama | 47% | John McCain | 42% | |
| Rasmussen Reports | Aug 5 | Barack Obama | 51% | John McCain | 44% | |
| Wisconsin Policy Research Institute |
Aug 3-4 | Barack Obama | 44% | John McCain | 38% | |
| Quinnipiac University/ Wall Street Journal/ Washington Post |
July 14–22 | Barack Obama | 50% | John McCain | 39% | |
| Rasmussen Reports | July 8 | Barack Obama | 52% | John McCain | 42% |
 Wyoming
3 electoral votes(Republican in 2000 & 2004)
| Wyoming Wyoming Wyoming is a state in the mountain region of the Western United States. The western two thirds of the state is covered mostly with the mountain ranges and rangelands in the foothills of the Eastern Rocky Mountains, while the eastern third of the state is high elevation prairie known as the High... opinion polls |
||||||
|---|---|---|---|---|---|---|
| Poll Source | Date administered (2008) | Democrat | % | Republican | % | Lead Margin |
| Research 2000/Daily Kos | Oct 27-29 | Barack Obama | 36% | John McCain | 61% | |
| SurveyUSA/Roll Call | Oct 18-19 | Barack Obama | 37% | John McCain | 58% | |
| Research 2000/Daily Kos | Oct 14-16 | Barack Obama | 35% | John McCain | 58% | |
| Research 2000/Daily Kos | Sept 22-24 | Barack Obama | 36% | John McCain | 57% | |
| American Research Group | Sept 9-11 | Barack Obama | 28% | John McCain | 66% | |
| Rasmussen Reports | Sept 10 | Barack Obama | 39% | John McCain | 58% | |
| Mason Dixon | Aug 13-15 | Barack Obama | 25% | John McCain | 62% |
See also
- Nationwide opinion polling for the Democratic Party 2008 presidential candidatesNationwide opinion polling for the Democratic Party 2008 presidential candidatesFor state-by state numbers see Statewide opinion polling for the Democratic Party presidential primaries, 2008This is a collection of scientific, public nationwide opinion polls that have been conducted relating to the 2008 Democratic presidential candidates.-Broad field: For state-by state numbers...
- Nationwide opinion polling for the Republican Party 2008 presidential candidatesNationwide opinion polling for the Republican Party 2008 presidential candidatesThis article is a collection of nation-wide public opinion polls that have been conducted relating to the 2008 Republican presidential candidates, typically using standard statistical methodology...
- Nationwide opinion polling for the United States presidential election, 2008
- Statewide opinion polling for the Democratic Party presidential primaries, 2008Statewide opinion polling for the Democratic Party presidential primaries, 2008This article is a collection of state-wide public opinion polls that have been conducted relating to the Democratic presidential primaries, 2008. A graphic summary of the data in map form follows...
- Statewide opinion polling for the Republican Party presidential primaries, 2008Statewide opinion polling for the Republican Party presidential primaries, 2008This article is a collection of state-wide public opinion polls that have been conducted relating to the Republican presidential primaries, 2008, typically using standard statistical methodology.-Candidates:...
Latest results (using latest polling when available)
This results section uses only the latest polls for each state. It is for indicative purposes only, and is highly susceptible to polling errors. The numbers in parentheses indicate the number of electoral votes awarded to each state. A total of 538 electoral votes are distributed among the states and DC. Margins of 10% or more are considered "safe"; margins of 5% to 9.9% are considered "likely" and margins of 0.1% to 4.9% are considered "leaning". Margins of multiple polls concluded the same day are averaged out. Because the list is revised after newer polls are released, it is highly volatile and should only be taken as examples.Barack Obama
Barack Obama
Barack Hussein Obama II is the 44th and current President of the United States. He is the first African American to hold the office. Obama previously served as a United States Senator from Illinois, from January 2005 until he resigned following his victory in the 2008 presidential election.Born in...
− Joe Biden
Joe Biden
Joseph Robinette "Joe" Biden, Jr. is the 47th and current Vice President of the United States, serving under President Barack Obama...
- California (55)
- Connecticut (7)
- Delaware (3)
- District of Columbia (3)
- Hawaii (4)
- Illinois (21)
- Iowa (7)
- Maine (4)
- Maryland (10)
- Massachusetts (12)
- Michigan (17)
- Nevada (5)
- New Hampshire (4)
- New Jersey (15)
- New York (31)
- Oregon (7)
- Rhode Island (4)
- Vermont (3)
- Washington (11)
- Wisconsin (10)
- New Mexico (5)
- Pennsylvania (21)
- Virginia (13)
- Colorado (9)
- Florida (27)
- Minnesota (10)
- Montana (3)
- North Carolina (15)
- Ohio (20)
John McCain
John McCain
John Sidney McCain III is the senior United States Senator from Arizona. He was the Republican nominee for president in the 2008 United States election....
− Sarah Palin
Sarah Palin
Sarah Louise Palin is an American politician, commentator and author. As the Republican Party nominee for Vice President in the 2008 presidential election, she was the first Alaskan on the national ticket of a major party and first Republican woman nominated for the vice-presidency.She was...
- Total states (21 states − 171 electoral votes)
- Safe states (13 states − 106 electoral votes)
- Alabama (9)
- Alaska (3)
- Idaho (4)
- Kansas (6)
- Kentucky (8)
- Mississippi (6)
- Nebraska (5)
- Oklahoma (7)
- Tennessee (11)
- Texas (34)
- Utah (5)
- West Virginia (5)
- Wyoming (3)
- Likely states (4 states − 28 electoral votes)
- Arkansas (6)
- Indiana (11)
- South Carolina (8)
- South Dakota (3)
- Leaning states (4 states − 37 electoral votes)
- Arizona (10)
- Georgia (15)
- Louisiana (9)
- North Dakota (3)
Tied
- Total states (1 state − 11 electoral votes)
- Missouri (11)
Maps of recent polling data
Map and totals updated at 11-3-08 11:10AM EST. Maps are based on a weighted average for the previous 10 polling results, and as such may be slow to show changes in countrywide opinion - click on the image to view its history. The second map is altered to convey the proportional amount of electoral votes of each state. The number of electoral votes of a given state is based on its population. Candidates must win at least 270 electoral votes to win the election, and the House of RepresentativesUnited States Congress
The United States Congress is the bicameral legislature of the federal government of the United States, consisting of the Senate and the House of Representatives. The Congress meets in the United States Capitol in Washington, D.C....
votes in the event no one qualifies.
| Safe Obama - over 10% (243) | Likely Obama - over 5% (291) (48) | Leans Obama - over 1% (338) (47) | Tossup - within 1% (29) | Leans McCain - over 1% (171) (39) | Likely McCain - over 5% (132) (14) | Safe McCain - over 10% (118) |
| District of Columbia (3) - 69.0% Hawaii (4) - 38.3% New York (31) - 29.0% Vermont (3) - 27.4% Delaware (3) - 23.8% Illinois (21) - 22.8% California (55) - 22.7% Massachusetts (12) - 20.3% Connecticut (7) - 20.1% Maryland (10) - 18.2% Rhode Island (4) - 17.0% New Jersey (15) - 16.5% Oregon (7) - 15.4% Washington (11) - 14.6% Maine (4) - 14.0% Michigan (17) - 13.8% Iowa (7) - 13.0% New Hampshire (4) - 12.9% Minnesota (10) - 11.9% Wisconsin (10) - 11.3% New Mexico (5) - 10.1% |
Pennsylvania (21) - 7.4% Colorado (9) - 7.2% Nevada (5) - 6.1% Virginia (13) - 5.6% |
Ohio (20) - 4.6% Florida (27) - 3.1% |
North Carolina (15) - 0.9% Obama Missouri (11) - 0.1% McCain North Dakota (3) - 0.5% McCain |
Arizona (10) - 4.7% Georgia (15) - 4.1% Montana (3) - 2.5% Indiana (11) - 1.3% |
Arkansas (6) - 9.7% South Dakota (3) - 9.0% West Virginia (5) - 7.9% |
Oklahoma (7) - 29.3% Utah (5) - 26.2% Idaho (4) - 25.2% Wyoming (3) - 23.6% Alabama (9) - 23.4% Nebraska (5) - 20.7% Kansas (6) - 16.8% Alaska (3) - 16.7% Tennessee (11) - 15.2% Kentucky (8) - 13.7% Texas (34) - 11.9% South Carolina (8) - 11.5% Mississippi (6) - 11.0% Louisiana (9)- 10.2% |
Totals
- Obama leads: 338 electoral votes
- McCain leads: 171 electoral votes
Election Day projection
FINAL UPDATE: 22:32, 4 November 2008 (UTC)
- Data derived from Nate SilverNate SilverNathaniel Read "Nate" Silver is an American statistician, psephologist, and writer. Silver first gained public recognition for developing PECOTA, a system for forecasting the performance and career development of Major League Baseball players, which he sold to and then managed for Baseball...
's FiveThirtyEight.comFiveThirtyEight.comFiveThirtyEight is a polling aggregation website with a blog created by Nate Silver. Sometimes colloquially referred to as 538 dot com or just 538, the website takes its name from the number of electors in the United States electoral college...
weighted averages and statistical polling analysis, which determines what the best guess as to what will happen on Election Day is rather than what would happen if the election were held today. (Methodology) - Each state is colored according to which candidate is currently projected to win, and both the state's total electoral votes and the winning candidate's projected margin of victory are listed.
External links
- FiveThirtyEight.com: Detailed analysis of state-by-state general election polling
- Electoral-Vote.com
- Pollster.com Graphic display of aggregated polls
- Election-Projection.net 2008 state-by-state and Electoral College Vote Projections
- Rasmussen Reports: Balance of Power Calculator
- Real Clear Politics
- Princeton Election Consortium
- Survey USA
- CNN's Electoral Map
- American Research Group's Ballot Lead Calculator