

Demographics of British Columbia
Encyclopedia
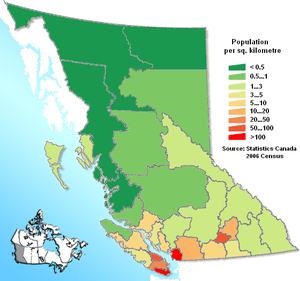
Percentage of National Population: 13.2%
Population Growth Rate: 4.9%
Vital Statistics
Birth rateBirth rate
Crude birth rate is the nativity or childbirths per 1,000 people per year . Another word used interchangeably with "birth rate" is "natality". When the crude birth rate is subtracted from the crude death rate, it reveals the rate of natural increase...
: 9.7 births p/1,000 (Canadian Average = ~11)
Death rate: 2.3 deaths p/1,000
Infant mortality rate: 4.0 deaths p/1,000 live births
Life expectancy
Life expectancy
Life expectancy is the expected number of years of life remaining at a given age. It is denoted by ex, which means the average number of subsequent years of life for someone now aged x, according to a particular mortality experience...
at Birth: 81.12 years
Total fertility rate
Total Fertility Rate
The total fertility rate of a population is the average number of children that would be born to a woman over her lifetime if she were to experience the exact current age-specific fertility rates through her lifetime, and she...
: 1.4 children born p/woman (Canadian Average = 1.61)
Population of British Columbia since 1851
| Year | Population | Five Year % change |
Ten Year % change |
Rank Among Provinces |
|---|---|---|---|---|
| 1851 | 55,000 | n/a | n/a | n/a |
| 1861 | 51,524 | n/a | ||
| n/a | ||||
| 1871 | 36,247 | n/a | ||
| 7 | ||||
| 1881 | 49,459 | n/a | 36.4 | 8 |
| 1891 | 98,173 | n/a | 98.5 | 8 |
| 1901 | 178,657 | n/a | 82.0 | 6 |
| 1911 | 392,480 | n/a | 119.7 | 6 |
| 1921 | 524,582 | n/a | 33.7 | 6 |
| 1931 | 694,263 | n/a | 32.3 | 6 |
| 1941 | 817,861 | n/a | 17.8 | 4 |
| 1951 | 1,165,210 | n/a | 42.5 | 3 |
| 1956 | 1,398,464 | 20.0 | n/a | 3 |
| 1961 | 1,629,082 | 16.5 | 39.8 | 3 |
| 1966 | 1,873,674 | 15.0 | 34.0 | 3 |
| 1971 | 2,184,620 | 16.6 | 34.1 | 3 |
| 1976 | 2,466,610 | 12.9 | 31.6 | 3 |
| 1981 | 2,744,467 | 11.3 | 25.6 | 3 |
| 1986 | 2,883,370 | 5.1 | 16.9 | 3 |
| 1991 | 3,282,061 | 13.8 | 19.6 | 3 |
| 1996 | 3,724,500 | 13.5 | 29.2 | 3 |
| 2001 | 3,907,738 | 4.9 | 19.1 | 3 |
| 2006 | 4,113,487 | 5.4 | 10.4 | 3 |
- Source: Statistics CanadaStatistics CanadaStatistics Canada is the Canadian federal government agency commissioned with producing statistics to help better understand Canada, its population, resources, economy, society, and culture. Its headquarters is in Ottawa....
Age Structure
| Males | Females | |||
| Age Group | Number | Per cent | Number | Per cent |
| 0-4 | 105,808 | 2.4% | 100,116 | 2.2% |
| 5-9 | 117,909 | 2.8% | 111,383 | 2.6% |
| 10-14 | 133,809 | 3.1% | 126,388 | 3.0% |
| 15-19 | 143,449 | 3.4% | 136,227 | 3.2% |
| 20-24 | 155,369 | 3.7% | 147,770 | 3.5% |
| 25-29 | 139,521 | 3.3% | 138,299 | 3.3% |
| 30-34 | 144,788 | 3.4% | 145,869 | 3.4% |
| 35-39 | 155,429 | 3.7% | 158,364 | 3.7% |
| 40-44 | 177,381 | 4.2% | 179,216 | 4.2% |
| 45-49 | 172,786 | 4.1% | 177,082 | 4.2% |
| 50-54 | 157,596 | 3.7% | 159,965 | 3.8% |
| 55-59 | 138,096 | 3.2% | 139,772 | 3.3% |
| 60-64 | 101,610 | 2.4% | 103,764 | 2.4% |
| 65-69 | 80,051 | 1.9% | 82,363 | 1.9% |
| 70-74 | 70,060 | 1.6% | 72,493 | 1.7% |
| 75-79 | 54,572 | 1.3% | 64,344 | 1.5% |
| 80-84 | 36,304 | 0.8% | 53,047 | 1.2% |
| 85+ | 24,544 | 0.6% | 48,978 | 1.1% |
| Totals | 2,109,082 | 49.6% | 2,145,440 | 50.4% |
- Source: BC Stats
Ethnicity
British Columbia has a very diverse ethnic population, with a large number of immigrants having lived in the province for 30 years or less. First-generation immigrants from the British Isles remain a strong component of local society despite limitations on immigration from Britain since the ending of special status for British subjects in the 1960s. Also present in large numbers relative to other cities in Canada (except Toronto), and also present in BC ever since the province was first settled (unlike Toronto), are many European ethnicities of the first and second generation, notably Germans, Ukrainians, Scandinavians, Yugoslavs and Italians; third-generation Europeans are generally of mixed lineage, and traditionally intermarried with other ethnic groups more than in any other Canadian province.The percentages add to more than 100% because of dual responses (e.g. "French-Canadian" generates an entry in both the category "French" and the category "Canadian"). In recent decades, the proportion of those of Chinese ethnicity has risen sharply, though still outnumbered by the historically-strong population of those of German ancestry. Visible minorities have become an important factor in ethnic-based politics, though most visible minorities are less numerous than the long-standing non-British European ethnicities making up BC's "invisible minorities".
- Further information: Statistics Canada. "Population by selected ethnic origins, by province and territory (2006 Census) (British Columbia)"
Note: The following statistics represent both single (e.g., "German") and multiple (e.g., "part Chinese, part English") responses to the 2006 Census, and thus do not add up to 100%.
| Ethnic Origin | Population | Percent |
|---|---|---|
| English English people The English are a nation and ethnic group native to England, who speak English. The English identity is of early mediaeval origin, when they were known in Old English as the Anglecynn. England is now a country of the United Kingdom, and the majority of English people in England are British Citizens... |
1,207,245 | 29.63% |
| Scottish Scottish people The Scottish people , or Scots, are a nation and ethnic group native to Scotland. Historically they emerged from an amalgamation of the Picts and Gaels, incorporating neighbouring Britons to the south as well as invading Germanic peoples such as the Anglo-Saxons and the Norse.In modern use,... |
828,145 | 20.32% |
| Canadian | 720,200 | 17.67% |
| Irish Irish people The Irish people are an ethnic group who originate in Ireland, an island in northwestern Europe. Ireland has been populated for around 9,000 years , with the Irish people's earliest ancestors recorded having legends of being descended from groups such as the Nemedians, Fomorians, Fir Bolg, Tuatha... |
618,120 | 15.17% |
| German Ethnic German Ethnic Germans historically also ), also collectively referred to as the German diaspora, refers to people who are of German ethnicity. Many are not born in Europe or in the modern-day state of Germany or hold German citizenship... |
561,570 | 13.78% |
| Chinese Overseas Chinese Overseas Chinese are people of Chinese birth or descent who live outside the Greater China Area . People of partial Chinese ancestry living outside the Greater China Area may also consider themselves Overseas Chinese.... |
432,435 | 10.60% |
| French French people The French are a nation that share a common French culture and speak the French language as a mother tongue. Historically, the French population are descended from peoples of Celtic, Latin and Germanic origin, and are today a mixture of several ethnic groups... |
361,215 | 8.86% |
| Indian | 232,370 | 5.70% |
| Ukrainian Ukrainians Ukrainians are an East Slavic ethnic group native to Ukraine, which is the sixth-largest nation in Europe. The Constitution of Ukraine applies the term 'Ukrainians' to all its citizens... |
197,265 | 4.84% |
| Dutch (Netherlands) Dutch people The Dutch people are an ethnic group native to the Netherlands. They share a common culture and speak the Dutch language. Dutch people and their descendants are found in migrant communities worldwide, notably in Suriname, Chile, Brazil, Canada, Australia, South Africa, New Zealand, and the United... |
196,420 | 4.82% |
| North American Indian | 193,060 | 4.74% |
| Italian Italian people The Italian people are an ethnic group that share a common Italian culture, ancestry and speak the Italian language as a mother tongue. Within Italy, Italians are defined by citizenship, regardless of ancestry or country of residence , and are distinguished from people... |
143,155 | 3.51% |
| Norwegian | 129,420 | 3.18% |
| Polish Poles thumb|right|180px|The state flag of [[Poland]] as used by Polish government and diplomatic authoritiesThe Polish people, or Poles , are a nation indigenous to Poland. They are united by the Polish language, which belongs to the historical Lechitic subgroup of West Slavic languages of Central Europe... |
128,360 | 3.15% |
| Russian Russians The Russian people are an East Slavic ethnic group native to Russia, speaking the Russian language and primarily living in Russia and neighboring countries.... |
114,105 | 2.80% |
| Welsh Welsh people The Welsh people are an ethnic group and nation associated with Wales and the Welsh language.John Davies argues that the origin of the "Welsh nation" can be traced to the late 4th and early 5th centuries, following the Roman departure from Britain, although Brythonic Celtic languages seem to have... |
104,275 | 2.56% |
| Swedish | 104,025 | 2.55% |
- Source: Statistic Canada
Visible Minorities
Asians are by far the largest visible minority demographic, with many of the Lower MainlandLower Mainland
The Lower Mainland is a name commonly applied to the region surrounding and including Vancouver, British Columbia, Canada. As of 2007, 2,524,113 people live in the region; sixteen of the province's thirty most populous municipalities are located there.While the term Lower Mainland has been...
's large cities having sizeable Chinese
China
Chinese civilization may refer to:* China for more general discussion of the country.* Chinese culture* Greater China, the transnational community of ethnic Chinese.* History of China* Sinosphere, the area historically affected by Chinese culture...
, India
India
India , officially the Republic of India , is a country in South Asia. It is the seventh-largest country by geographical area, the second-most populous country with over 1.2 billion people, and the most populous democracy in the world...
n, Japan
Japan
Japan is an island nation in East Asia. Located in the Pacific Ocean, it lies to the east of the Sea of Japan, China, North Korea, South Korea and Russia, stretching from the Sea of Okhotsk in the north to the East China Sea and Taiwan in the south...
ese, Filipino
Philippines
The Philippines , officially known as the Republic of the Philippines , is a country in Southeast Asia in the western Pacific Ocean. To its north across the Luzon Strait lies Taiwan. West across the South China Sea sits Vietnam...
, and Korea
Korea
Korea ) is an East Asian geographic region that is currently divided into two separate sovereign states — North Korea and South Korea. Located on the Korean Peninsula, Korea is bordered by the People's Republic of China to the northwest, Russia to the northeast, and is separated from Japan to the...
n communities.
- Note: Statistics Canada defines visible minorities as defined in the Employment Equity Act which defines visible minorities as 'persons, other than Aboriginal peoples, who are non-Caucasian in race or non-white in colour.'
| British Columbia 2006 | Population | % of Group | % of Total Population | |
|---|---|---|---|---|
| Visible minority group Source: http://www12.statcan.ca/english/census06/data/highlights/ethnic/pages/Page.cfm?Lang=E&Geo=PR&Code=01&Table=1&Data=Count&StartRec=1&Sort=5&Display=Page |
South Asian | 262,290 | 26.0 | 6.4 |
| Chinese Overseas Chinese Overseas Chinese are people of Chinese birth or descent who live outside the Greater China Area . People of partial Chinese ancestry living outside the Greater China Area may also consider themselves Overseas Chinese.... |
407,225 | 40.4 | 10.0 | |
| Black Black people The term black people is used in systems of racial classification for humans of a dark skinned phenotype, relative to other racial groups.Different societies apply different criteria regarding who is classified as "black", and often social variables such as class, socio-economic status also plays a... |
28,315 | 2.8 | 0.7 | |
| Filipino Filipino Canadian Filipino Canadians are Canadians of Filipino ancestry. Filipino-Canadians are the fourth-largest subgroup of the Overseas Filipinos.Canada only had a small population of Filipinos until the late 20th century. To date, there are currently around 400,000 Filipino Canadians in Canada, most of them... |
88,080 | 8.8 | 2.2 | |
| Latin America Latin America Latin America is a region of the Americas where Romance languages – particularly Spanish and Portuguese, and variably French – are primarily spoken. Latin America has an area of approximately 21,069,500 km² , almost 3.9% of the Earth's surface or 14.1% of its land surface area... |
28,960 | 2.9 | 0.7 | |
| Southeast Asian | 40,690 | 4.0 | 1.0 | |
| Others | 153,295 | 15.2 | 3.8 | |
| Total Visible Minorities | 1,008,855 | 100 | 24.8 | |
| Some Arabs, Latin Americans and other groups may be able to pass for white. All categories may include people of part-Caucasian origin. |
||||
Aboriginal peoples
| British Columbia 2006 | Population | % of Group | % of Total Population | |
|---|---|---|---|---|
| Aboriginal Group Source: http://www12.statcan.ca/english/census06/data/highlights/Aboriginal/pages/Page.cfm?Lang=E&Geo=PR&Code=01&Table=1&Data=Count&Sex=1&Age=1&StartRec=1&Sort=5&Display=Page |
North American Indian | 129,580 | 66.1 | 3.2 |
| Metis | 59,445 | 30.3 | 1.5 | |
| Inuit | 795 | 0.4 | 0.0 | |
| Total Aboriginal Identity Population | 196,075 | 100 | 4.8 | |
Religions
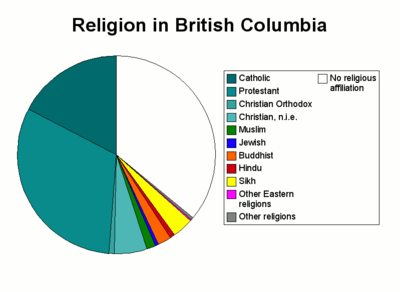
| Population by religion, Canada and BC (2001 Census) |
Canada | B.C. | ||
|---|---|---|---|---|
| number | % | number | % | |
| Total population | 29,639,035 | 3,868,875 | ||
| No religious affiliation | 4,900,090 | 17% | 1,388,300 | 36% |
| Protestant | 8,654,850 | 29% | 1,213,295 | 31% |
| Catholic | 12,936,905 | 44% | 675,320 | 17% |
| Christian not included elsewhere | 780,450 | 3% | 200,345 | 5% |
| Sikh | 278,410 | 1% | 135,310 | 3% |
| Buddhist | 300,345 | 1% | 85,540 | 2% |
| Muslim | 579,640 | 2% | 56,220 | 1% |
| Christian Orthodox | 479,620 | 2% | 35,655 | 1% |
| Hindu | 297,200 | 1% | 31,500 | 1% |
| Jewish | 329,995 | 1% | 21,230 | 1% |
| Eastern religions | 37,550 | 0% | 9,970 | 0% |
| Other religions | 63,975 | 0% | 16,205 | 0% |
| Source: Statistics Canada 2001 Census http://www40.statcan.ca/l01/cst01/demo30c.htm |
||||
Languages
| Language(s) first learned and still understood | Total | % | Male | Female |
|---|---|---|---|---|
| English Only | 2,825,780 | 73.03% | 1,403,230 | 1,422,545 |
| French Only | 54,405 | 1.41% | 27,340 | 27,060 |
| Both English and French | 6,784 | 0.18% | 3,360 | 3,452 |
| Other Languages | 981,910 | 25.38% | 470,145 | 511,765 |
| Source: Statistics Canada 2001 Census | ||||
See also
- Demographics of CanadaDemographics of CanadaThis article about the demographic features of the population of Canada, including population density, ethnicity, education level, health of the populace, economic status, religious affiliations and other aspects of the population, the People of Canada....
- List of Canadian provinces and territories by population
- Demographics of VancouverDemographics of VancouverThe Demographics of Vancouver concern population growth and structure for Vancouver, British Columbia, Canada. Figures given here are for the Greater Vancouver Regional District, however, not for the City of Vancouver proper.-Population growth:...
- Demographics of Abbotsford, British Columbia