

Keeling curve
Encyclopedia
Chart
A chart is a graphical representation of data, in which "the data is represented by symbols, such as bars in a bar chart, lines in a line chart, or slices in a pie chart"...
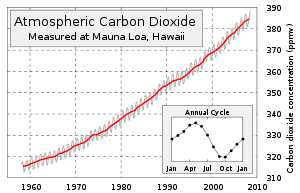
which plots the ongoing change in concentration of carbon dioxide in Earth's atmosphere since 1958. It is based on continuous measurements taken at the Mauna Loa Observatory
Mauna Loa Observatory
The Mauna Loa Observatory is an atmospheric baseline station on Mauna Loa volcano, on the big island of Hawaii.-The observatory:Since 1956 Mauna Loa Observatory has been monitoring and collecting data relating to atmospheric change, and is known especially for the continuous monitoring of...
in Hawaii
Hawaii
Hawaii is the newest of the 50 U.S. states , and is the only U.S. state made up entirely of islands. It is the northernmost island group in Polynesia, occupying most of an archipelago in the central Pacific Ocean, southwest of the continental United States, southeast of Japan, and northeast of...
under the supervision of Charles David Keeling
Charles David Keeling
Charles David Keeling was an American scientist whose recording of carbon dioxide at the Mauna Loa Observatory first alerted the world to the possibility of anthropogenic contribution to the "greenhouse effect" and global warming...
. Keeling's measurements showed the first significant evidence of rapidly increasing carbon dioxide levels in the atmosphere. Many scientists credit Keeling's graph with first bringing the world's attention to the current increase of carbon dioxide in the atmosphere.
Charles David Keeling, of the Scripps Institution of Oceanography
Scripps Institution of Oceanography
Scripps Institution of Oceanography in La Jolla, California, is one of the oldest and largest centers for ocean and earth science research, graduate training, and public service in the world...
at UC San Diego, was the first person to make frequent regular measurements of the atmospheric carbon dioxide (CO2) concentration, taking readings at the South Pole
South Pole
The South Pole, also known as the Geographic South Pole or Terrestrial South Pole, is one of the two points where the Earth's axis of rotation intersects its surface. It is the southernmost point on the surface of the Earth and lies on the opposite side of the Earth from the North Pole...
and in Hawaii from 1958 onwards.
Prior to Keeling, the concentration of carbon dioxide in the atmosphere was thought to be affected by constant variability. Keeling had perfected the measurement techniques and observed "strong diurnal
Diurnal cycle
A diurnal cycle is any pattern that recurs every 24 hours as a result of one full rotation of the Earth.In climatology, the diurnal cycle is one of the most basic forms of climate patterns. The most familiar such pattern is the diurnal temperature variation...
behaviour with steady values of about 310 ppm in the afternoon" at three locations: (Big Sur
Big Sur
Big Sur is a sparsely populated region of the Central Coast of California where the Santa Lucia Mountains rise abruptly from the Pacific Ocean. The name "Big Sur" is derived from the original Spanish-language "el sur grande", meaning "the big south", or from "el país grande del sur", "the big...
near Monterey, the rain forests of Olympic Peninsula
Olympic Peninsula
The Olympic Peninsula is the large arm of land in western Washington state of the USA, that lies across Puget Sound from Seattle. It is bounded on the west by the Pacific Ocean, the north by the Strait of Juan de Fuca, and the east by Puget Sound. Cape Alava, the westernmost point in the contiguous...
and high mountain forests in Arizona
Arizona
Arizona ; is a state located in the southwestern region of the United States. It is also part of the western United States and the mountain west. The capital and largest city is Phoenix...
). By measuring the ratio of two isotopes of carbon, Keeling attributed the diurnal change to respiration from local plants and soils, with afternoon values representative of the "free atmosphere". By 1960, Keeling and his group established the measurement record that was long enough to see not just the diurnal and seasonal variations, but also a year-on-year increase that roughly matched the amount of fossil fuel
Fossil fuel
Fossil fuels are fuels formed by natural processes such as anaerobic decomposition of buried dead organisms. The age of the organisms and their resulting fossil fuels is typically millions of years, and sometimes exceeds 650 million years...
s burned per year. In the article that made him famous, Keeling observed, "at the South Pole the observed rate of increase is nearly that to be expected from the combustion of fossil fuel".
Mauna Loa measurements
Due to funding cuts in the mid-1960s, Keeling was forced to abandon continuous monitoring efforts at the South Pole, but he scraped together enough money to maintain operations at Mauna Loa, which have continued to the present day.The measurements collected at Mauna Loa show a steady increase in mean atmospheric CO2 concentration from about 315 parts per million by volume (ppmv) in 1958 to 392 ppmv as of July 2011. This increase in atmospheric CO2 is considered to be largely due to the combustion
Combustion
Combustion or burning is the sequence of exothermic chemical reactions between a fuel and an oxidant accompanied by the production of heat and conversion of chemical species. The release of heat can result in the production of light in the form of either glowing or a flame...
of fossil fuel
Fossil fuel
Fossil fuels are fuels formed by natural processes such as anaerobic decomposition of buried dead organisms. The age of the organisms and their resulting fossil fuels is typically millions of years, and sometimes exceeds 650 million years...
s, and has been accelerating in recent years. Since carbon dioxide is a greenhouse gas
Greenhouse gas
A greenhouse gas is a gas in an atmosphere that absorbs and emits radiation within the thermal infrared range. This process is the fundamental cause of the greenhouse effect. The primary greenhouse gases in the Earth's atmosphere are water vapor, carbon dioxide, methane, nitrous oxide, and ozone...
, this has significant implications for global warming
Global warming
Global warming refers to the rising average temperature of Earth's atmosphere and oceans and its projected continuation. In the last 100 years, Earth's average surface temperature increased by about with about two thirds of the increase occurring over just the last three decades...
. Measurements of carbon dioxide concentration in ancient air bubbles trapped in polar ice core
Ice core
An ice core is a core sample that is typically removed from an ice sheet, most commonly from the polar ice caps of Antarctica, Greenland or from high mountain glaciers elsewhere. As the ice forms from the incremental build up of annual layers of snow, lower layers are older than upper, and an ice...
s show that mean atmospheric CO2 concentration has historically been between 275 and 285 ppmv during the Holocene
Holocene
The Holocene is a geological epoch which began at the end of the Pleistocene and continues to the present. The Holocene is part of the Quaternary period. Its name comes from the Greek words and , meaning "entirely recent"...
epoch (9,000 BCE onwards), but started rising sharply at the beginning of the nineteenth century. However, analyses of stomatal frequency in tree leaves indicate that mean atmospheric CO2 concentration may have reached 320 ppmv during the Medieval Warm Period
Medieval Warm Period
The Medieval Warm Period , Medieval Climate Optimum, or Medieval Climatic Anomaly was a time of warm climate in the North Atlantic region, that may also have been related to other climate events around the world during that time, including in China, New Zealand, and other countries lasting from...
(800–1300 CE) and 350 ppmv during the early Holocene.
Though Mauna Loa is not an active volcano
Volcano
2. Bedrock3. Conduit 4. Base5. Sill6. Dike7. Layers of ash emitted by the volcano8. Flank| 9. Layers of lava emitted by the volcano10. Throat11. Parasitic cone12. Lava flow13. Vent14. Crater15...
, Keeling and collaborators made measurements on the incoming ocean breeze and above the thermal inversion layer
Inversion (meteorology)
In meteorology, an inversion is a deviation from the normal change of an atmospheric property with altitude. It almost always refers to a temperature inversion, i.e...
to minimize local contamination from volcanic vents. In addition, the data are normalized
Normalization (statistics)
In one usage in statistics, normalization is the process of isolating statistical error in repeated measured data. A normalization is sometimes based on a property...
to negate any influence from local contamination. Measurements at many other isolated sites have confirmed the long-term trend shown by the Keeling Curve, though no sites have a record as long as Mauna Loa.
The Keeling Curve also shows a cyclic variation of about 5 ppmv in each year corresponding to the seasonal change in uptake of CO2 by the world's land vegetation. Most of this vegetation is in the Northern hemisphere
Northern Hemisphere
The Northern Hemisphere is the half of a planet that is north of its equator—the word hemisphere literally means “half sphere”. It is also that half of the celestial sphere north of the celestial equator...
, since this is where most of the land is located. The level decreases from northern spring onwards as new plant
Plant
Plants are living organisms belonging to the kingdom Plantae. Precise definitions of the kingdom vary, but as the term is used here, plants include familiar organisms such as trees, flowers, herbs, bushes, grasses, vines, ferns, mosses, and green algae. The group is also called green plants or...
growth takes carbon dioxide out of the atmosphere through photosynthesis
Photosynthesis
Photosynthesis is a chemical process that converts carbon dioxide into organic compounds, especially sugars, using the energy from sunlight. Photosynthesis occurs in plants, algae, and many species of bacteria, but not in archaea. Photosynthetic organisms are called photoautotrophs, since they can...
and rises again in the northern fall as plants and leaves
Leaf
A leaf is an organ of a vascular plant, as defined in botanical terms, and in particular in plant morphology. Foliage is a mass noun that refers to leaves as a feature of plants....
die off and decay to release the gas back into the atmosphere.
Due in part to the significance of Keeling's findings, the NOAA
National Oceanic and Atmospheric Administration
The National Oceanic and Atmospheric Administration , pronounced , like "noah", is a scientific agency within the United States Department of Commerce focused on the conditions of the oceans and the atmosphere...
began monitoring CO2 levels worldwide in the 1970s. Today, CO2 levels are monitored at about 100 sites around the globe.
Carbon dioxide measurements at the Mauna Loa observatory in Hawaii are made with a type of infrared spectrophotometer called a capnograph
Capnograph
A capnograph is an instrument used to measure the carbon dioxide concentration in an air sample. It does this by measuring the absorption of infrared light, which is absorbed particularly well by carbon dioxide....
by, John Tyndall
John Tyndall
John Tyndall FRS was a prominent Irish 19th century physicist. His initial scientific fame arose in the 1850s from his study of diamagnetism. Later he studied thermal radiation, and produced a number of discoveries about processes in the atmosphere...
, its inventor in 1864, but now known as a nondispersive infrared sensor.
Keeling died in 2005. Supervision of the measuring project was taken over by his son, Ralph Keeling, a climate science professor at the Scripps Institution.
External links
- Climate Change Is Clear Atop Mauna Loa, NPR, Day to Day, May 1, 2007
- Scripps Institution of Oceanography CO2-Program: Home of the Keeling Curve
- Earthguide educational resource
- The Keeling Curve Turns 50 - Scripps Institution of OceanographyScripps Institution of OceanographyScripps Institution of Oceanography in La Jolla, California, is one of the oldest and largest centers for ocean and earth science research, graduate training, and public service in the world...