

Graph drawing
Encyclopedia
Mathematics
Mathematics is the study of quantity, space, structure, and change. Mathematicians seek out patterns and formulate new conjectures. Mathematicians resolve the truth or falsity of conjectures by mathematical proofs, which are arguments sufficient to convince other mathematicians of their validity...
and computer science
Computer science
Computer science or computing science is the study of the theoretical foundations of information and computation and of practical techniques for their implementation and application in computer systems...
combining methods from geometric graph theory
Geometric graph theory
In mathematics, a geometric graph is a graph in which the vertices or edges are associated with geometric objects or configurations. Geometric graph theory is a specialization of graph theory that studies geometric graphs...
and information visualization
Information visualization
Information visualization is the interdisciplinary study of "the visual representation of large-scale collections of non-numerical information, such as files and lines of code in software systems, library and bibliographic databases, networks of relations on the internet, and so forth".- Overview...
to derive two-dimensional depictions of graph
Graph (mathematics)
In mathematics, a graph is an abstract representation of a set of objects where some pairs of the objects are connected by links. The interconnected objects are represented by mathematical abstractions called vertices, and the links that connect some pairs of vertices are called edges...
s arising from applications such as social network
Social network
A social network is a social structure made up of individuals called "nodes", which are tied by one or more specific types of interdependency, such as friendship, kinship, common interest, financial exchange, dislike, sexual relationships, or relationships of beliefs, knowledge or prestige.Social...
analysis, cartography
Cartography
Cartography is the study and practice of making maps. Combining science, aesthetics, and technique, cartography builds on the premise that reality can be modeled in ways that communicate spatial information effectively.The fundamental problems of traditional cartography are to:*Set the map's...
, and bioinformatics
Bioinformatics
Bioinformatics is the application of computer science and information technology to the field of biology and medicine. Bioinformatics deals with algorithms, databases and information systems, web technologies, artificial intelligence and soft computing, information and computation theory, software...
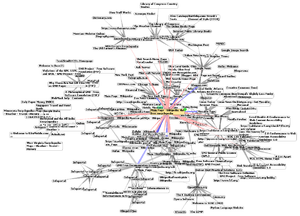
. A drawing of a graph or network diagram is basically a pictorial representation of the vertices
Vertex (graph theory)
In graph theory, a vertex or node is the fundamental unit out of which graphs are formed: an undirected graph consists of a set of vertices and a set of edges , while a directed graph consists of a set of vertices and a set of arcs...
and edges of a graph. This drawing should not be confused with the graph itself: very different layouts can correspond to the same graph. In the abstract, all that matters is which pairs vertices are connected by edges. In the concrete, however, the arrangement of these vertices and edges within a drawing affects its understandability, usability, fabrication cost, and aesthetics
Aesthetics
Aesthetics is a branch of philosophy dealing with the nature of beauty, art, and taste, and with the creation and appreciation of beauty. It is more scientifically defined as the study of sensory or sensori-emotional values, sometimes called judgments of sentiment and taste...
.
Graphical conventions
Line segment
In geometry, a line segment is a part of a line that is bounded by two end points, and contains every point on the line between its end points. Examples of line segments include the sides of a triangle or square. More generally, when the end points are both vertices of a polygon, the line segment...
s, polylines
Polygonal chain
A polygonal chain, polygonal curve, polygonal path, or piecewise linear curve, is a connected series of line segments. More formally, a polygonal chain P is a curve specified by a sequence of points \scriptstyle called its vertices so that the curve consists of the line segments connecting the...
, or curves in the Euclidean plane.
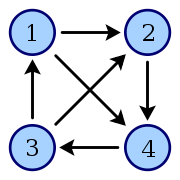
In the case of directed graph
Directed graph
A directed graph or digraph is a pair G= of:* a set V, whose elements are called vertices or nodes,...
s, arrowheads
Arrow (symbol)
An arrow is a graphical symbol such as → or ←, used to point or indicate direction, being in its simplest form a line segment with a triangle affixed to one end, and in more complex forms a representation of an actual arrow...
form a commonly-used graphical convention to show their orientation
Orientability
In mathematics, orientability is a property of surfaces in Euclidean space measuring whether or not it is possible to make a consistent choice of surface normal vector at every point. A choice of surface normal allows one to use the right-hand rule to define a "clockwise" direction of loops in the...
; however, user studies have shown that other conventions such as tapering provide this information more effectively.
Alternative conventions to node-link diagrams include adjacency representations such as circle packings
Circle packing theorem
The circle packing theorem describes the possible tangency relations between circles in the plane whose interiors are disjoint. A circle packing is a connected collection of circles whose interiors are disjoint...
, in which vertices are represented by disjoint regions in the plane and edges are represented by adjacencies between regions; intersection representations
Intersection graph
In the mathematical area of graph theory, an intersection graph is a graph that represents the pattern of intersections of a family of sets. Any graph may be represented as an intersection graph, but some important special classes of graphs may be defined by the types of sets that are used to form...
in which vertices are represented by non-disjoint geometric objects and edges are represented by their intersections; visibility representations in which vertices are represented by regions in the plane and edges are represented by regions that have an unobstructed line of sight to each other; confluent drawings, in which edges are represented as smooth curves within mathematical train track
Train track
In the mathematical area of topology, a train track is a family of curves embedded on a surface, meeting the following conditions:#The curves meet at a finite set of vertices called switches....
s; and visualizations of the adjacency matrix
Adjacency matrix
In mathematics and computer science, an adjacency matrix is a means of representing which vertices of a graph are adjacent to which other vertices...
of the graph.
Quality measures
Many different quality measures have been defined for graph drawings, in an attempt to find objective means of evaluating their aesthetics and usability. In addition to guiding the choice between different layout methods for the same graph, some layout methods attempt to directly optimize these measures.- The crossing numberCrossing number (graph theory)In graph theory, the crossing number cr of a graph G is the lowest number of edge crossings of a planar drawing of the graph G. For instance, a graph is planar if and only if its crossing number is zero.The concept originated in...
of a drawing is the number of pairs of edges that cross each other. If the graph is planarPlanar graphIn graph theory, a planar graph is a graph that can be embedded in the plane, i.e., it can be drawn on the plane in such a way that its edges intersect only at their endpoints...
, then it is often convenient to draw it without any edge intersections; that is, in this case, a graph drawing represents a graph embeddingGraph embeddingIn topological graph theory, an embedding of a graph G on a surface Σ is a representation of G on Σ in which points of Σ are associated to vertices and simple arcs are associated to edges in such a way that:...
. However, nonplanar graphs frequently arise in applications, so graph drawing algorithms must generally allow for edge crossings. - The area of a drawing is the size of its smallest bounding box, relative to the closest distance between any two vertices. Drawings with smaller area are generally preferable to those with larger area, because they allow the features of the drawing to be shown at greater size and therefore more legibly. The aspect ratioAspect ratioThe aspect ratio of a shape is the ratio of its longer dimension to its shorter dimension. It may be applied to two characteristic dimensions of a three-dimensional shape, such as the ratio of the longest and shortest axis, or for symmetrical objects that are described by just two measurements,...
of the bounding box may also be important. - Symmetry display is the problem of finding symmetry groupGraph automorphismIn the mathematical field of graph theory, an automorphism of a graph is a form of symmetry in which the graph is mapped onto itself while preserving the edge–vertex connectivity....
s within a given graph, and finding a drawing that displays as much of the symmetry as possible. Some layout methods automatically lead to symmetric drawings; alternatively, some drawing methods start by finding symmetries in the input graph and using them to construct a drawing. - It is important that edges have shapes that are as simple as possible, to make it easier for the eye to follow them. In polyline drawings, the complexity of an edge may be measured by its number of bends, and many methods aim to provide drawings with few total bends or few bends per edge. Similarly for spline curves the complexity of an edge may be measured by the number of control points on the edge.
- Several commonly used quality measures concern lengths of edges: it is generally desirable to minimize the total length of the edges as well as the maximum length of any edge. Additionally, it may be preferable for the lengths of edges to be uniform rather than highly varied.
- Angular resolutionAngular resolution (graph drawing)In graph drawing, the angular resolution of a drawing of a graph refers to the sharpest angle formed by any two edges that meet at a common vertex of the drawing.Angular resolution was first defined by...
is a measure of the sharpest angles in a graph drawing. If a graph has vertices with high degreeDegree (graph theory)In graph theory, the degree of a vertex of a graph is the number of edges incident to the vertex, with loops counted twice. The degree of a vertex v is denoted \deg. The maximum degree of a graph G, denoted by Δ, and the minimum degree of a graph, denoted by δ, are the maximum and minimum degree...
then it necessarily will have small angular resolution, but the angular resolution can be bounded below by a function of the degree.
Layout methods
There are many different graph layout strategies:- In force-based layout systems, the graph drawing software modifies an initial vertex placement by continuously moving the vertices according to a system of forces based on physical metaphors related to systems of springsSpring (device)A spring is an elastic object used to store mechanical energy. Springs are usually made out of spring steel. Small springs can be wound from pre-hardened stock, while larger ones are made from annealed steel and hardened after fabrication...
or molecular mechanicsMolecular mechanicsMolecular mechanics uses Newtonian mechanics to model molecular systems. The potential energy of all systems in molecular mechanics is calculated using force fields...
. Typically, these systems combine attractive forces between adjacent vertices with repulsive forces between all pairs of vertices, in order to seek a layout in which edge lengths are small while vertices are well-separated. These systems may perform gradient descentGradient descentGradient descent is a first-order optimization algorithm. To find a local minimum of a function using gradient descent, one takes steps proportional to the negative of the gradient of the function at the current point...
based minimization of an energy function, or they may translate the forces directly into velocities or accelerations for the moving vertices. - Spectral layoutSpectral layoutSpectral layout is a class of algorithm for drawing graphs. The layout uses the eigenvectors of a matrix, such as the Laplace matrix of the graph, as Cartesian coordinates of the graph's vertices....
methods use as coordinates the eigenvectors of a matrixMatrix (mathematics)In mathematics, a matrix is a rectangular array of numbers, symbols, or expressions. The individual items in a matrix are called its elements or entries. An example of a matrix with six elements isMatrices of the same size can be added or subtracted element by element...
such as the LaplacianDiscrete Laplace operatorIn mathematics, the discrete Laplace operator is an analog of the continuous Laplace operator, defined so that it has meaning on a graph or a discrete grid...
derived from the adjacency matrixAdjacency matrixIn mathematics and computer science, an adjacency matrix is a means of representing which vertices of a graph are adjacent to which other vertices...
of the graph. - In orthogonal layout methods, the edges of the graph run horizontally or vertically, parallel to the coordinate axes of the layout. These methods were originally designed for VLSI and PCBPrinted circuit boardA printed circuit board, or PCB, is used to mechanically support and electrically connect electronic components using conductive pathways, tracks or signal traces etched from copper sheets laminated onto a non-conductive substrate. It is also referred to as printed wiring board or etched wiring...
layout problems but they have also been adapted for graph drawing. They typically involve a multiphase approach in which an input graph is planarized by replacing crossing points by vertices, a topological embedding of the planarized graph is found, edge orientations are chosen to minimize bends, vertices are placed consistently with these orientations, and finally a layout compaction stage reduces the area of the drawing. - Tree layout algorithms these show a rooted treeTree structureA tree structure is a way of representing the hierarchical nature of a structure in a graphical form. It is named a "tree structure" because the classic representation resembles a tree, even though the chart is generally upside down compared to an actual tree, with the "root" at the top and the...
-like formation, suitable for treesTree (graph theory)In mathematics, more specifically graph theory, a tree is an undirected graph in which any two vertices are connected by exactly one simple path. In other words, any connected graph without cycles is a tree...
. Often, in a technique called "balloon layout", the children of each node in the tree are drawn on a circle surrounding the node, with the radii of these circles diminishing at lower levels in the tree so that these circles do not overlap. - Layered graph drawingLayered graph drawingLayered graph drawing is a type of graph drawing in which the vertices of a directed graph are drawn in horizontal rows or layers with the edges generally directed downwards...
methods (often called Sugiyama-style drawing) are best suited for directed acyclic graphDirected acyclic graphIn mathematics and computer science, a directed acyclic graph , is a directed graph with no directed cycles. That is, it is formed by a collection of vertices and directed edges, each edge connecting one vertex to another, such that there is no way to start at some vertex v and follow a sequence of...
s or graphs that are nearly acyclic, such as the graphs of dependencies between modules or functions in a software system. In these methods, the nodes of the graph are arranged into horizontal layers using methods such as the Coffman–Graham algorithmCoffman–Graham algorithmIn job shop scheduling and graph drawing, the Coffman–Graham algorithm is an algorithm, named after Edward G. Coffman, Jr. and Ronald Graham, for arranging the elements of a partially ordered set into a sequence of levels...
, in such a way that most edges go downwards from one layer to the next; after this step, the nodes within each layer are arranged in order to minimize crossings. - Circular layout methods place the vertices of the graph on a circle, choosing carefully the ordering of the vertices around the circle to reduce crossings and place adjacent vertices close to each other. Edges may be drawn either as chords of the circle or as arcs inside or outside of the circle. In some cases, multiple circles may be used.
Application-specific graph drawings
Graphs and graph drawings arising in other areas of application include- SociogramSociogramA sociogram is a graphic representation of social links that a person has. It is a graph drawing that plots the structure of interpersonal relations in a group situation.- Overview :...
s, drawings of a social networkSocial networkA social network is a social structure made up of individuals called "nodes", which are tied by one or more specific types of interdependency, such as friendship, kinship, common interest, financial exchange, dislike, sexual relationships, or relationships of beliefs, knowledge or prestige.Social...
, as often offered by social network analysis softwareSocial network analysis softwareSocial network analysis software facilitates quantitative or qualitative analysis of social networks, by describing features of a network, either through numerical or visual representation... - Hasse diagramHasse diagramIn order theory, a branch of mathematics, a Hasse diagram is a type of mathematical diagram used to represent a finite partially ordered set, in the form of a drawing of its transitive reduction...
s, a type of graph drawing specialized to partial orders - Dessin d'enfantDessin d'enfantIn mathematics, a dessin d'enfant is a type of graph drawing used to study Riemann surfaces and to provide combinatorial invariants for the action of the absolute Galois group of the rational numbers.Intuitively, a dessin d'enfant is simply a graph, with its vertices colored alternating black and...
s, a type of graph drawing used in algebraic geometryAlgebraic geometryAlgebraic geometry is a branch of mathematics which combines techniques of abstract algebra, especially commutative algebra, with the language and the problems of geometry. It occupies a central place in modern mathematics and has multiple conceptual connections with such diverse fields as complex... - State diagramState diagramA state diagram is a type of diagram used in computer science and related fields to describe the behavior of systems. State diagrams require that the system described is composed of a finite number of states; sometimes, this is indeed the case, while at other times this is a reasonable abstraction...
s, graphical representations of finite state machineFinite state machineA finite-state machine or finite-state automaton , or simply a state machine, is a mathematical model used to design computer programs and digital logic circuits. It is conceived as an abstract machine that can be in one of a finite number of states...
s - Computer network diagrams, depictions of the nodes and connections in a computer networkComputer networkA computer network, often simply referred to as a network, is a collection of hardware components and computers interconnected by communication channels that allow sharing of resources and information....
. - Flow charts, drawings in which the nodes represent the steps of an algorithmAlgorithmIn mathematics and computer science, an algorithm is an effective method expressed as a finite list of well-defined instructions for calculating a function. Algorithms are used for calculation, data processing, and automated reasoning...
and the edges represent control flowControl flowIn computer science, control flow refers to the order in which the individual statements, instructions, or function calls of an imperative or a declarative program are executed or evaluated....
between steps. - Data flow diagramData flow diagramA data flow diagram is a graphical representation of the "flow" of data through an information system, modelling its process aspects. Often they are a preliminary step used to create an overview of the system which can later be elaborated...
s, drawings in which the nodes represent the components of an information systemInformation systemAn information system - or application landscape - is any combination of information technology and people's activities that support operations, management, and decision making. In a very broad sense, the term information system is frequently used to refer to the interaction between people,...
and the edges represent the movement of information from one component to another.
In addition, the placement
Placement (EDA)
Placement is an essential step in electronic design automation - the portion of the physical design flow that assigns exact locations for various circuitcomponents within the chip’s core area...
and routing steps of electronic design automation
Electronic design automation
Electronic design automation is a category of software tools for designing electronic systems such as printed circuit boards and integrated circuits...
are similar in many ways to graph drawing, and the graph drawing literature includes several results borrowed from the EDA literature. However, these problems also differ in several important ways: for instance, in EDA, area minimization and signal length are more important than aesthetics, and the routing problem in EDA may have more than two terminals per net while the analogous problem in graph drawing generally only involves pairs of vertices for each edge.
Software
Software, systems, and providers of systems for drawing graphs include:- GraphvizGraphvizGraphviz is a package of open-source tools initiated by AT&T Labs Research for drawing graphs specified in DOT language scripts. It also provides libraries for software applications to use the tools...
, an open-source graph drawing system from AT&TAT&TAT&T Inc. is an American multinational telecommunications corporation headquartered in Whitacre Tower, Dallas, Texas, United States. It is the largest provider of mobile telephony and fixed telephony in the United States, and is also a provider of broadband and subscription television services... - yEdYEdyEd is a freely available, general-purpose diagramming software with amulti-document interface.It is a cross-platform application written in Java that runs on Windows, Linux, Mac OS, or any platform that supports the JVM....
, a widespread graph editor with graph layout functionality - Microsoft Automatic Graph LayoutMicrosoft Automatic Graph LayoutMicrosoft Automatic Graph Layout is a .NET library for automatic graph layout.It was created by Lev Nachmanson at Microsoft Research.Earlier versions carried the name GLEE .- Contents :...
, a .NET library (formerly called GLEE) for laying out graphs - Tom Sawyer SoftwareTom Sawyer SoftwareTom Sawyer Software is a software company that provides products used to build data visualization and social network analysis applications. Organizations use these applications to better understand relationships, trends, and patterns in their complex data sets to identify emerging opportunities and...
- Tulip (software)Tulip (software)Tulip is an information visualization framework dedicated to the analysis and visualization of relational data. Tulip aims to provide the developer with a complete library, supporting the design of interactive information visualization applications for relational data that can be tailored to the...
External links
- Graph drawing e-print archive: including information on papers from all Graph Drawing symposiaInternational Symposium on Graph DrawingThe International Symposium on Graph Drawing is an annual academic conference in which researchers present peer reviewed papers on graph drawing, information visualization of network information, geometric graph theory, and related topics.-Significance:...
. for many additional links related to graph drawing.