

Statistical graphics
Encyclopedia
Statistical graphics, also known as graphical techniques, are information graphics
in the field of statistics
used to visualize quantitative data
.
and data analysis
procedures generally yield their output in numeric or tabular form, graphical techniques allow such results to be displayed in some sort of pictorial form. They include plots
such as scatter plots, histogram
s, probability plot
s, spaghetti plots, residual plots, box plot
s, block plots and biplot
s.
Exploratory data analysis
(EDA) relies heavily on such techniques. They can also provide insight into a data set to help with testing assumptions, model selection
and regression model validation, estimator selection, relationship identification, factor effect determination, and outlier
detection. In addition, the choice of appropriate statistical graphics can provide a convincing means of communicating the underlying message that is present in the data to others.
Graphical statistical methods have four objectives:
If one is not using statistical graphics, then one is forfeiting insight into one or more aspects of the underlying structure of the data.
, statistical maps
, bar chart
s, and coordinate paper were used in the 18th century. Statistical graphics developed through attention to four problems:
Since the 1970s statistical graphics have been re-emerging as an important analytic tool with the revitalisation of computer graphics
and related technologies.
 Famous graphics were designed by:
A special type of statistical graphic are the so called isotype
s. These are graphical tools designed by Otto Neurath
with the specific purpose of achieving changes in society through visual education of the masses.
Information graphics
Information graphics or infographics are graphic visual representations of information, data or knowledge. These graphics present complex information quickly and clearly, such as in signs, maps, journalism, technical writing, and education...
in the field of statistics
Statistics
Statistics is the study of the collection, organization, analysis, and interpretation of data. It deals with all aspects of this, including the planning of data collection in terms of the design of surveys and experiments....
used to visualize quantitative data
Data
The term data refers to qualitative or quantitative attributes of a variable or set of variables. Data are typically the results of measurements and can be the basis of graphs, images, or observations of a set of variables. Data are often viewed as the lowest level of abstraction from which...
.
Overview
Whereas statisticsStatistics
Statistics is the study of the collection, organization, analysis, and interpretation of data. It deals with all aspects of this, including the planning of data collection in terms of the design of surveys and experiments....
and data analysis
Data analysis
Analysis of data is a process of inspecting, cleaning, transforming, and modeling data with the goal of highlighting useful information, suggesting conclusions, and supporting decision making...
procedures generally yield their output in numeric or tabular form, graphical techniques allow such results to be displayed in some sort of pictorial form. They include plots
Plot (graphics)
A plot is a graphical technique for representing a data set, usually as a graph showing the relationship between two or more variables. The plot can be drawn by hand or by a mechanical or electronic plotter. Graphs are a visual representation of the relationship between variables, very useful for...
such as scatter plots, histogram
Histogram
In statistics, a histogram is a graphical representation showing a visual impression of the distribution of data. It is an estimate of the probability distribution of a continuous variable and was first introduced by Karl Pearson...
s, probability plot
Probability plot
In statistics, a P-P plot is a probability plot for assessing how closely two data sets agree, which plots the two cumulative distribution functions against each other....
s, spaghetti plots, residual plots, box plot
Box plot
In descriptive statistics, a box plot or boxplot is a convenient way of graphically depicting groups of numerical data through their five-number summaries: the smallest observation , lower quartile , median , upper quartile , and largest observation...
s, block plots and biplot
Biplot
Biplots are a type of exploratory graph used in statistics, a generalization of the simple two-variable scatterplot. A biplot allows information on both samples and variables of a data matrix to be displayed graphically. Samples are displayed as points while variables are displayed either as...
s.
Exploratory data analysis
Exploratory data analysis
In statistics, exploratory data analysis is an approach to analysing data sets to summarize their main characteristics in easy-to-understand form, often with visual graphs, without using a statistical model or having formulated a hypothesis...
(EDA) relies heavily on such techniques. They can also provide insight into a data set to help with testing assumptions, model selection
Model selection
Model selection is the task of selecting a statistical model from a set of candidate models, given data. In the simplest cases, a pre-existing set of data is considered...
and regression model validation, estimator selection, relationship identification, factor effect determination, and outlier
Outlier
In statistics, an outlier is an observation that is numerically distant from the rest of the data. Grubbs defined an outlier as: An outlying observation, or outlier, is one that appears to deviate markedly from other members of the sample in which it occurs....
detection. In addition, the choice of appropriate statistical graphics can provide a convincing means of communicating the underlying message that is present in the data to others.
Graphical statistical methods have four objectives:
- The exploration of the content of a data set
- The use to find structure in data
- Checking assumptions in statistical models
- Communicate the results of an analysis.
If one is not using statistical graphics, then one is forfeiting insight into one or more aspects of the underlying structure of the data.
History
Statistical graphics have been central to the development of science and date to the earliest attempts to analyse data. Many familiar forms, including bivariate plotsBivariate map
A bivariate map displays two variables on a single map by combining two different sets of graphic symbols or colors. Bivariate mapping is an important technique in cartography. Given a set of geographic features, a bivariate map displays two variables on a single map by combining two different sets...
, statistical maps
Thematic map
A thematic map is a type of map or chart especially designed to show a particular theme connected with a specific geographic area. These maps "can portray physical, social, political, cultural, economic, sociological, agricultural, or any other aspects of a city, state, region,nation , or...
, bar chart
Bar chart
A bar chart or bar graph is a chart with rectangular bars with lengths proportional to the values that they represent. The bars can be plotted vertically or horizontally....
s, and coordinate paper were used in the 18th century. Statistical graphics developed through attention to four problems:
- Spatial organization in the 17th and 18th century
- Discrete comparison in the 18th and early 19th century
- Continuous distribution in the 19th century and
- Multivariate distribution and correlation in the late 19th and 20th century.
Since the 1970s statistical graphics have been re-emerging as an important analytic tool with the revitalisation of computer graphics
Computer graphics
Computer graphics are graphics created using computers and, more generally, the representation and manipulation of image data by a computer with help from specialized software and hardware....
and related technologies.
Examples
- William PlayfairWilliam PlayfairWilliam Playfair was a Scottish engineer and political economist, the founder of graphical methods of statistics....
who published what could be called the first pie chartPie chartA pie chart is a circular chart divided into sectors, illustrating proportion. In a pie chart, the arc length of each sector , is proportional to the quantity it represents. When angles are measured with 1 turn as unit then a number of percent is identified with the same number of centiturns...
and the well known diagram that depicts the evolution of EnglandEnglandEngland is a country that is part of the United Kingdom. It shares land borders with Scotland to the north and Wales to the west; the Irish Sea is to the north west, the Celtic Sea to the south west, with the North Sea to the east and the English Channel to the south separating it from continental...
's imports and exports. - Florence NightingaleFlorence NightingaleFlorence Nightingale OM, RRC was a celebrated English nurse, writer and statistician. She came to prominence for her pioneering work in nursing during the Crimean War, where she tended to wounded soldiers. She was dubbed "The Lady with the Lamp" after her habit of making rounds at night...
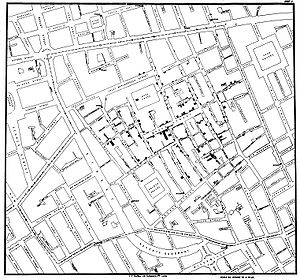
, who used statistical graphics to persuade the British Government to improve army hygiene, - John SnowJohn Snow (physician)John Snow was an English physician and a leader in the adoption of anaesthesia and medical hygiene. He is considered to be one of the fathers of epidemiology, because of his work in tracing the source of a cholera outbreak in Soho, England, in 1854.-Early life and education:Snow was born 15 March...
who plotted deaths from choleraCholeraCholera is an infection of the small intestine that is caused by the bacterium Vibrio cholerae. The main symptoms are profuse watery diarrhea and vomiting. Transmission occurs primarily by drinking or eating water or food that has been contaminated by the diarrhea of an infected person or the feces...
in LondonLondonLondon is the capital city of :England and the :United Kingdom, the largest metropolitan area in the United Kingdom, and the largest urban zone in the European Union by most measures. Located on the River Thames, London has been a major settlement for two millennia, its history going back to its...
in 1854 to detect the source of the disease, and - Charles Joseph MinardCharles Joseph MinardCharles Joseph Minard was a French civil engineer noted for his inventions in the field of information graphics.- Biography :...
who designed a large portfolio of maps of which the one depicting Napoleon's campaign in RussiaRussiaRussia or , officially known as both Russia and the Russian Federation , is a country in northern Eurasia. It is a federal semi-presidential republic, comprising 83 federal subjects...
is the best known.
A special type of statistical graphic are the so called isotype
Isotype (pictograms)
Isotype is a method of showing social, technological, biological and historical connections in pictorial form...
s. These are graphical tools designed by Otto Neurath
Otto Neurath
Otto Neurath was an Austrian philosopher of science, sociologist, and political economist...
with the specific purpose of achieving changes in society through visual education of the masses.
See also
- Data Presentation ArchitectureData Presentation ArchitectureData presentation architecture is a skill-set that seeks to identify, locate, manipulate, format and present data in such a way as to optimally communicate meaning and proffer knowledge.-Origin and context:...
- List of graphical methods
- Visual inspection