
Histogram
Overview
Statistics
Statistics is the study of the collection, organization, analysis, and interpretation of data. It deals with all aspects of this, including the planning of data collection in terms of the design of surveys and experiments....
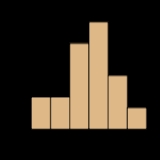
, a histogram is a graphical representation showing a visual impression of the distribution of data. It is an estimate of the probability distribution
Probability distribution
In probability theory, a probability mass, probability density, or probability distribution is a function that describes the probability of a random variable taking certain values....
of a continuous variable and was first introduced by Karl Pearson
Karl Pearson
Karl Pearson FRS was an influential English mathematician who has been credited for establishing the disciplineof mathematical statistics....
. A histogram consists of tabular frequencies
Frequency (statistics)
In statistics the frequency of an event i is the number ni of times the event occurred in the experiment or the study. These frequencies are often graphically represented in histograms....
, shown as adjacent rectangle
Rectangle
In Euclidean plane geometry, a rectangle is any quadrilateral with four right angles. The term "oblong" is occasionally used to refer to a non-square rectangle...
s, erected over discrete intervals (bins), with an area equal to the frequency of the observations in the interval. The height of a rectangle is also equal to the frequency density of the interval, i.e., the frequency divided by the width of the interval.
Discussions