

Statistical geography
Encyclopedia
Statistical geography is the study and practice of collecting, analysing and presenting data that has a geographic or areal dimension, such as census or demographics data. It uses techniques from spatial analysis
, but also encompasses geographical activities such as the defining and naming of geographical regions for statistical purposes. For example, for the purposes of statistical geography, the Australian Bureau of Statistics
uses the Australian Standard Geographical Classification, a hierarchical regionalisation that divides Australia
up into states and territories
, then statistical divisions, statistical subdivisions, statistical local areas, and finally census collection districts.
 Geographers
study how and why elements differ from place to place, as well as how spatial patterns change through time. Geographers begin with the question 'Where?', exploring how features are distributed on a physical or cultural landscape, observing spatial patterns and the variation of phenomena. Contemporary geographical analysis has shifted to 'Why?', determining why a specific spatial pattern exists, what spatial or ecological processes may have affected a pattern, and why such processes operate. Only by approaching the 'why?' questions can social scientists begin to appreciate the mechanisms of change, which are infinite in their complexity.
Geographers use statistics in numerous ways:
In many cases the subdivision of spatial data has already been determined, this is evident in demographic datasets, as the available information will be grouped into their respective counties or municipalities. For this type of data, analysts must use the same county or municipal boundaries delineated in the collected data for their subsequent analysis. When alternate boundaries are possible, an analyst must take into account that any new subdivision model may create different results.
For summarizing point pattern analysis, a set of descriptive spatial statistics has been developed that are areal equivalents to nonspatial measures. Since geographers are particularly concerned with the analysis of locational data, these descriptive spatial statistics (geostatistics) are often applied to summarize point patterns and to describe the degree of spatial variability of some phenomena.
, of which a particular example is the mean center of U.S. population
. Several different ways of defining a center are available:
Just as the standard deviation
indicates how closely the values in a data set are clustered around the mean, so standard distance in a spatial distribution indicates how closely the points are clustered around the mean centre.
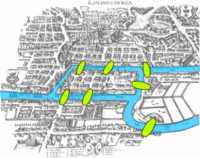 The motivating insight behind topology is that some geometric problems depend not on the exact shape of the objects involved, but rather on the "way they are connected together". One of the first papers in topology was the demonstration, by Leonhard Euler
, that it was impossible to find a route through the town of Königsberg (now Kaliningrad
) that would cross each of its seven bridges exactly once. This result did not depend on the lengths of the bridges, nor on their distance from one another, but only on connectivity properties: which bridges are connected to which islands or riverbanks. This problem, the Seven Bridges of Königsberg
, is now a famous problem in introductory mathematics, and led to the branch of mathematics known as graph theory
.
, line
, and polygon
, each of which implies different spatial characteristics; for instance, the only shape which has a distinguishable inside and outside is the polygon. Principles of connectivity associated with topology lead to applications in hydrology
, urban planning
, and logistics
, as well as other fields; as such, topological analyses offer unique modelling capabilities, defining the vector nature of topological features and correcting spatial data errors from digitizing.
Spatial analysis
Spatial analysis or spatial statistics includes any of the formal techniques which study entities using their topological, geometric, or geographic properties...
, but also encompasses geographical activities such as the defining and naming of geographical regions for statistical purposes. For example, for the purposes of statistical geography, the Australian Bureau of Statistics
Australian Bureau of Statistics
The Australian Bureau of Statistics is Australia's national statistical agency. It was created as the Commonwealth Bureau of Census and Statistics on 8 December 1905, when the Census and Statistics Act 1905 was given Royal assent. It had its beginnings in section 51 of the Constitution of Australia...
uses the Australian Standard Geographical Classification, a hierarchical regionalisation that divides Australia
Australia
Australia , officially the Commonwealth of Australia, is a country in the Southern Hemisphere comprising the mainland of the Australian continent, the island of Tasmania, and numerous smaller islands in the Indian and Pacific Oceans. It is the world's sixth-largest country by total area...
up into states and territories
States and territories of Australia
The Commonwealth of Australia is a union of six states and various territories. The Australian mainland is made up of five states and three territories, with the sixth state of Tasmania being made up of islands. In addition there are six island territories, known as external territories, and a...
, then statistical divisions, statistical subdivisions, statistical local areas, and finally census collection districts.
Background
Geography
Geography is the science that studies the lands, features, inhabitants, and phenomena of Earth. A literal translation would be "to describe or write about the Earth". The first person to use the word "geography" was Eratosthenes...
study how and why elements differ from place to place, as well as how spatial patterns change through time. Geographers begin with the question 'Where?', exploring how features are distributed on a physical or cultural landscape, observing spatial patterns and the variation of phenomena. Contemporary geographical analysis has shifted to 'Why?', determining why a specific spatial pattern exists, what spatial or ecological processes may have affected a pattern, and why such processes operate. Only by approaching the 'why?' questions can social scientists begin to appreciate the mechanisms of change, which are infinite in their complexity.
Role of statistics in geography
Statistical techniques and procedures are applied in all fields of academic research; wherever data are collected and summarized or wherever any numerical information is analyzed or research is conducted, statistics are needed for sound analysis and interpretation of results.Geographers use statistics in numerous ways:
- To describe and summarize spatial data.
- To make generalizations concerning complex spatial patterns.
- To estimate the probability of outcomes for an event at a given location.
- To use samples of geographic data to infer characteristics for a larger set of geographic data (population).
- To determine if the magnitude or frequency of some phenomenon differs from one location to another.
- To learn whether an actual spatial pattern matches some expected pattern.
Spatial data and descriptive statistics
There are several potential difficulties associated with the analysis of spatial data, among these are boundary delineation, modifiable areal units, and the level of spatial aggregation or scale. In each of these cases, the absolute descriptive statistics of an area - the mean, median, mode, standard deviation, and variation - are changed through the manipulation of these spatial problems.Boundary delineation
The location of a study area boundary and the positioning of internal boundaries affect various descriptive statistics. With respect to measures such as the mean or standard deviation, the study area size alone may have large implications; consider a study of per capita income within a city, if confined to the inner city, income levels are likely to be lower because of a less affluent population, if expanded to include the suburbs or surrounding communities, income levels will become greater with the influence of homeowner populations. Because of this problem, absolute descriptive statistics such as the mean, standard deviation, and variance should be evaluated comparatively only in relation to a particular study area. In the determination of internal boundaries this is also true, as these statistics may only have valid interpretations for the area and subarea configuration over which they are calculated.Modifiable areal units
See also: Modifiable areal unit problemModifiable Areal Unit Problem
The modifiable areal unit problem is a source of statistical bias that can radically affect the results of statistical hypothesis tests. It affects results when point-based measures of spatial phenomena are aggregated into districts. The resulting summary values are influenced by the choice of...
In many cases the subdivision of spatial data has already been determined, this is evident in demographic datasets, as the available information will be grouped into their respective counties or municipalities. For this type of data, analysts must use the same county or municipal boundaries delineated in the collected data for their subsequent analysis. When alternate boundaries are possible, an analyst must take into account that any new subdivision model may create different results.
Spatial aggregation/scale problem
Socio-economic data may be available at a variety of scales, for example: municipalities, regional districts, census tracts, enumeration districts, or at the provincial/state level. When this data is aggregated at different scales, the resulting descriptive statistics may exhibit variations, either in a systematic, predictable way, or in a more uncertain fashion. If we are observing economic data, we may notice a distinct reduction in manufacturing productivity for a country (the USA) over a certain period; since this is a general model, individual states may experience these effects differently. The result of this aggregation is that the standard deviation of the data in question is increased due to the variability among states.Descriptive spatial statistics
- See main article Spatial descriptive statisticsSpatial descriptive statisticsSpatial descriptive statistics are used for a variety of purposes in geography, particularly in quantitative data analyses involving Geographic Information Systems .-Types of spatial data:...
For summarizing point pattern analysis, a set of descriptive spatial statistics has been developed that are areal equivalents to nonspatial measures. Since geographers are particularly concerned with the analysis of locational data, these descriptive spatial statistics (geostatistics) are often applied to summarize point patterns and to describe the degree of spatial variability of some phenomena.
Spatial measures of central tendency
An example here is the idea of a center of populationCenter of population
In demographics, the center of population of a region is a geographical point that describes a centerpoint of the region's population...
, of which a particular example is the mean center of U.S. population
Mean center of U.S. population
The mean center of U.S. population is determined by the United States Census Bureau from the results of each census. The Bureau defines it to be:...
. Several different ways of defining a center are available:
- Mean center: The mean is an important measure of central tendency, which when extended to a set of points, located on a Cartesian coordinate systemCartesian coordinate systemA Cartesian coordinate system specifies each point uniquely in a plane by a pair of numerical coordinates, which are the signed distances from the point to two fixed perpendicular directed lines, measured in the same unit of length...
, the average location, centroidCentroidIn geometry, the centroid, geometric center, or barycenter of a plane figure or two-dimensional shape X is the intersection of all straight lines that divide X into two parts of equal moment about the line. Informally, it is the "average" of all points of X...
or mean center, can be determined. - The weighted mean center is analogous to frequencies in the calculation of grouped statistics, such as the weighted mean. A point may represent a retail outlet, while its frequency will represent the volume of sales within the particular store.
- Median center or Euclidean center and in the median center of United States populationMedian center of United States populationThe median center of U.S. population is determined by the United States Census Bureau from the results of each census. The Bureau defines it to be:- See also :* Mean center of United States population* Center of population...
. This is related to the Manhattan distance.
Spatial measures of dispersion
- Standard distance
Just as the standard deviation
Standard deviation
Standard deviation is a widely used measure of variability or diversity used in statistics and probability theory. It shows how much variation or "dispersion" there is from the average...
indicates how closely the values in a data set are clustered around the mean, so standard distance in a spatial distribution indicates how closely the points are clustered around the mean centre.
- Relative distance
Topology
Leonhard Euler
Leonhard Euler was a pioneering Swiss mathematician and physicist. He made important discoveries in fields as diverse as infinitesimal calculus and graph theory. He also introduced much of the modern mathematical terminology and notation, particularly for mathematical analysis, such as the notion...
, that it was impossible to find a route through the town of Königsberg (now Kaliningrad
Kaliningrad
Kaliningrad is a seaport and the administrative center of Kaliningrad Oblast, the Russian exclave between Poland and Lithuania on the Baltic Sea...
) that would cross each of its seven bridges exactly once. This result did not depend on the lengths of the bridges, nor on their distance from one another, but only on connectivity properties: which bridges are connected to which islands or riverbanks. This problem, the Seven Bridges of Königsberg
Seven Bridges of Königsberg
The Seven Bridges of Königsberg is a historically notable problem in mathematics. Its negative resolution by Leonhard Euler in 1735 laid the foundations of graph theory and prefigured the idea of topology....
, is now a famous problem in introductory mathematics, and led to the branch of mathematics known as graph theory
Graph theory
In mathematics and computer science, graph theory is the study of graphs, mathematical structures used to model pairwise relations between objects from a certain collection. A "graph" in this context refers to a collection of vertices or 'nodes' and a collection of edges that connect pairs of...
.
Topology rules
Topology rules are particularly important within GIS, and are used for a variety of correction and analytical procedures. The primary shapes in GIS are the pointPoint (geometry)
In geometry, topology and related branches of mathematics a spatial point is a primitive notion upon which other concepts may be defined. In geometry, points are zero-dimensional; i.e., they do not have volume, area, length, or any other higher-dimensional analogue. In branches of mathematics...
, line
Line (geometry)
The notion of line or straight line was introduced by the ancient mathematicians to represent straight objects with negligible width and depth. Lines are an idealization of such objects...
, and polygon
Polygon
In geometry a polygon is a flat shape consisting of straight lines that are joined to form a closed chain orcircuit.A polygon is traditionally a plane figure that is bounded by a closed path, composed of a finite sequence of straight line segments...
, each of which implies different spatial characteristics; for instance, the only shape which has a distinguishable inside and outside is the polygon. Principles of connectivity associated with topology lead to applications in hydrology
Hydrology
Hydrology is the study of the movement, distribution, and quality of water on Earth and other planets, including the hydrologic cycle, water resources and environmental watershed sustainability...
, urban planning
Urban planning
Urban planning incorporates areas such as economics, design, ecology, sociology, geography, law, political science, and statistics to guide and ensure the orderly development of settlements and communities....
, and logistics
Logistics
Logistics is the management of the flow of goods between the point of origin and the point of destination in order to meet the requirements of customers or corporations. Logistics involves the integration of information, transportation, inventory, warehousing, material handling, and packaging, and...
, as well as other fields; as such, topological analyses offer unique modelling capabilities, defining the vector nature of topological features and correcting spatial data errors from digitizing.