Standard deviation
Encyclopedia
Statistics
Statistics is the study of the collection, organization, analysis, and interpretation of data. It deals with all aspects of this, including the planning of data collection in terms of the design of surveys and experiments....
and probability theory
Probability theory
Probability theory is the branch of mathematics concerned with analysis of random phenomena. The central objects of probability theory are random variables, stochastic processes, and events: mathematical abstractions of non-deterministic events or measured quantities that may either be single...
. It shows how much variation or "dispersion
Statistical dispersion
In statistics, statistical dispersion is variability or spread in a variable or a probability distribution...
" there is from the average (mean
Mean
In statistics, mean has two related meanings:* the arithmetic mean .* the expected value of a random variable, which is also called the population mean....
, or expected value). A low standard deviation indicates that the data points tend to be very close to the mean
Mean
In statistics, mean has two related meanings:* the arithmetic mean .* the expected value of a random variable, which is also called the population mean....
, whereas high standard deviation indicates that the data points are spread out over a large range of values.
The standard deviation of a statistical population
Statistical population
A statistical population is a set of entities concerning which statistical inferences are to be drawn, often based on a random sample taken from the population. For example, if we were interested in generalizations about crows, then we would describe the set of crows that is of interest...
, data set, or probability distribution
Probability distribution
In probability theory, a probability mass, probability density, or probability distribution is a function that describes the probability of a random variable taking certain values....
is the square root
Square root
In mathematics, a square root of a number x is a number r such that r2 = x, or, in other words, a number r whose square is x...
of its variance
Variance
In probability theory and statistics, the variance is a measure of how far a set of numbers is spread out. It is one of several descriptors of a probability distribution, describing how far the numbers lie from the mean . In particular, the variance is one of the moments of a distribution...
. It is algebra
Algebra
Algebra is the branch of mathematics concerning the study of the rules of operations and relations, and the constructions and concepts arising from them, including terms, polynomials, equations and algebraic structures...
ically simpler though practically less robust
Robust statistics
Robust statistics provides an alternative approach to classical statistical methods. The motivation is to produce estimators that are not unduly affected by small departures from model assumptions.- Introduction :...
than the average absolute deviation.
A useful property of standard deviation is that, unlike variance, it is expressed in the same units as the data.
In addition to expressing the variability of a population, standard deviation is commonly used to measure confidence in statistical conclusions. For example, the margin of error
Margin of error
The margin of error is a statistic expressing the amount of random sampling error in a survey's results. The larger the margin of error, the less faith one should have that the poll's reported results are close to the "true" figures; that is, the figures for the whole population...
in polling
Opinion poll
An opinion poll, sometimes simply referred to as a poll is a survey of public opinion from a particular sample. Opinion polls are usually designed to represent the opinions of a population by conducting a series of questions and then extrapolating generalities in ratio or within confidence...
data is determined by calculating the expected standard deviation in the results if the same poll were to be conducted multiple times. The reported margin of error is typically about twice the standard deviation – the radius of a 95 percent confidence interval
Confidence interval
In statistics, a confidence interval is a particular kind of interval estimate of a population parameter and is used to indicate the reliability of an estimate. It is an observed interval , in principle different from sample to sample, that frequently includes the parameter of interest, if the...
. In science
Science
Science is a systematic enterprise that builds and organizes knowledge in the form of testable explanations and predictions about the universe...
, researchers commonly report the standard deviation of experimental data, and only effects that fall far outside the range of standard deviation are considered statistically significant – normal random error or variation in the measurements is in this way distinguished from causal variation. Standard deviation is also important in finance
Finance
"Finance" is often defined simply as the management of money or “funds” management Modern finance, however, is a family of business activity that includes the origination, marketing, and management of cash and money surrogates through a variety of capital accounts, instruments, and markets created...
, where the standard deviation on the rate of return
Rate of return
In finance, rate of return , also known as return on investment , rate of profit or sometimes just return, is the ratio of money gained or lost on an investment relative to the amount of money invested. The amount of money gained or lost may be referred to as interest, profit/loss, gain/loss, or...
on an investment
Investment
Investment has different meanings in finance and economics. Finance investment is putting money into something with the expectation of gain, that upon thorough analysis, has a high degree of security for the principal amount, as well as security of return, within an expected period of time...
is a measure of the volatility
Volatility (finance)
In finance, volatility is a measure for variation of price of a financial instrument over time. Historic volatility is derived from time series of past market prices...
of the investment.
When only a sample of data from a population is available, the population standard deviation can be estimated by a modified quantity called the sample standard deviation, explained below.
Basic examples
Consider a populationStatistical population
A statistical population is a set of entities concerning which statistical inferences are to be drawn, often based on a random sample taken from the population. For example, if we were interested in generalizations about crows, then we would describe the set of crows that is of interest...
consisting of the following eight values:
-

These eight data points have the mean (average) of 5:
To calculate the population standard deviation, first compute the difference of each data point from the mean, and square the result of each:-
Next compute the average of these values, and take the square root:
-

This quantity is the population standard deviation; it is equal to the square root of the variance. The formula is valid only if the eight values we began with form the complete population. If they instead were a random sample, drawn from some larger, "parent" population, then we should have used instead of in the denominator of the last formula, and then the quantity thus obtained would have been called the sample standard deviation. See the section Estimation below for more details.
A slightly more complicated real life example, the average height for adult men in the United StatesUnited StatesThe United States of America is a federal constitutional republic comprising fifty states and a federal district...
is about 70", with a standard deviation of around 3". This means that most men (about 68%, assuming a normal distribution) have a height within 3" of the mean (67"–73") — one standard deviation — and almost all men (about 95%) have a height within 6" of the mean (64"–76") — two standard deviations. If the standard deviation were zero, then all men would be exactly 70" tall. If the standard deviation were 20", then men would have much more variable heights, with a typical range of about 50"–90". Three standard deviations account for 99.7% of the sample population being studied, assuming the distribution is normal (bell-shaped).
Definition of population values
Let X be a random variableRandom variableIn probability and statistics, a random variable or stochastic variable is, roughly speaking, a variable whose value results from a measurement on some type of random process. Formally, it is a function from a probability space, typically to the real numbers, which is measurable functionmeasurable...
with mean value μ:
Here the operator E denotes the average or expected valueExpected valueIn probability theory, the expected value of a random variable is the weighted average of all possible values that this random variable can take on...
of X. Then the standard deviation of X is the quantity
That is, the standard deviation σ (sigmaSigmaSigma is the eighteenth letter of the Greek alphabet, and carries the 'S' sound. In the system of Greek numerals it has a value of 200. When used at the end of a word, and the word is not all upper case, the final form is used, e.g...
) is the square root of the variance of X, i.e., it is the square root of the average value of (X − μ)2.
The standard deviation of a (univariateUnivariateIn mathematics, univariate refers to an expression, equation, function or polynomial of only one variable. Objects of any of these types but involving more than one variable may be called multivariate...
) probability distribution is the same as that of a random variable having that distribution. Not all random variables have a standard deviation, since these expected values need not exist. For example, the standard deviation of a random variable that follows a Cauchy distributionCauchy distributionThe Cauchy–Lorentz distribution, named after Augustin Cauchy and Hendrik Lorentz, is a continuous probability distribution. As a probability distribution, it is known as the Cauchy distribution, while among physicists, it is known as the Lorentz distribution, Lorentz function, or Breit–Wigner...
is undefined because its expected value μ is undefined.
Discrete random variable
In the case where X takes random values from a finite data set x1, x2, …, xN, with each value having the same probability, the standard deviation is

or, using summationSummationSummation is the operation of adding a sequence of numbers; the result is their sum or total. If numbers are added sequentially from left to right, any intermediate result is a partial sum, prefix sum, or running total of the summation. The numbers to be summed may be integers, rational numbers,...
notation,

If, instead of having equal probabilities, the values have different probabilities, let x1 have probability p1, x2 have probability p2, ..., xN have probability pN. In this case, the standard deviation will be
Continuous random variable
The standard deviation of a continuous real-valued random variable X with probability density functionProbability density functionIn probability theory, a probability density function , or density of a continuous random variable is a function that describes the relative likelihood for this random variable to occur at a given point. The probability for the random variable to fall within a particular region is given by the...
p(x) is

and where the integrals are definite integrals taken for x ranging over the set of possible values of the random variable X.
In the case of a parametric family of distributionsParametric modelIn statistics, a parametric model or parametric family or finite-dimensional model is a family of distributions that can be described using a finite number of parameters...
, the standard deviation can be expressed in terms of the parameters. For example, in the case of the log-normal distribution with parameters μ and σ2, the standard deviation is [(exp(σ2) − 1)exp(2μ + σ2)]1/2.
Estimation
One can find the standard deviation of an entire population in cases (such as standardized testing) where every member of a population is sampled. In cases where that cannot be done, the standard deviation σ is estimated by examining a random sample taken from the population. Some estimators are given below:
With standard deviation of the sample
An estimator for σ sometimes used is the standard deviation of the sample, denoted by sN and defined as follows:
This estimator has a uniformly smaller mean squared errorMean squared errorIn statistics, the mean squared error of an estimator is one of many ways to quantify the difference between values implied by a kernel density estimator and the true values of the quantity being estimated. MSE is a risk function, corresponding to the expected value of the squared error loss or...
than the sample standard deviation (see below), and is the maximum-likelihood estimateMaximum likelihoodIn statistics, maximum-likelihood estimation is a method of estimating the parameters of a statistical model. When applied to a data set and given a statistical model, maximum-likelihood estimation provides estimates for the model's parameters....
when the population is normally distributed. But this estimator, when applied to a small or moderately sized sample, tends to be too low: it is a biased estimator.
The standard deviation of the sample is the same as the population standard deviation of a discrete random variable that can assume precisely the values from the data set, where the probability for each value is proportional to its multiplicity in the data set.
With sample standard deviation
The most common estimator for σ used is an adjusted version, the sample standard deviation, denoted by s and defined as follows:
where are the observed values of the sample items and
  is the mean value of these observations. This correction (the use of N − 1 instead of N) is known as Bessel's correctionBessel's correctionIn statistics, Bessel's correction, named after Friedrich Bessel, is the use of n − 1 instead of n in the formula for the sample variance and sample standard deviation, where n is the number of observations in a sample: it corrects the bias in the estimation of the population variance,...
. The reason for this correction is that s2 is an unbiased estimator for the variance σ2 of the underlying population, if that variance exists and the sample values are drawn independently with replacement. However, s is not an unbiased estimator for the standard deviation σ; it tends to overestimate the population standard deviation.
The term standard deviation of the sample is used for the uncorrected estimator (using N) while the term sample standard deviation is used for the corrected estimator (using N − 1). The denominator N − 1 is the number of degrees of freedomDegrees of freedom (statistics)In statistics, the number of degrees of freedom is the number of values in the final calculation of a statistic that are free to vary.Estimates of statistical parameters can be based upon different amounts of information or data. The number of independent pieces of information that go into the...
in the vector of residuals,
 .
.
Other estimators
Although an unbiased estimator for σUnbiased estimation of standard deviationThe question of unbiased estimation of a standard deviation arises in statistics mainly as question in statistical theory. Except in some important situations, outlined later, the task has little relevance to applications of statistics since its need is avoided by standard procedures, such as the...
is known when the random variable is normally distributed, the formula is complicated and amounts to a minor correction. Moreover, unbiasedness (in this sense of the word) is not always desirable.
Confidence interval of a sampled standard deviation
The standard deviation we obtain by sampling a distribution is itself not absolutely accurate. This is especially true if the number of samples is very low. This effect can be described by the confidence intervalConfidence intervalIn statistics, a confidence interval is a particular kind of interval estimate of a population parameter and is used to indicate the reliability of an estimate. It is an observed interval , in principle different from sample to sample, that frequently includes the parameter of interest, if the...
or CI.
For example for N=2 the 95% CI of the SD is from 0.45*SD to 31.9*SD. In other words the standard deviation of the distribution in 95% of the cases can be up to a factor of 31 larger or up to a factor 2 smaller! For N=10 the interval is 0.69*SD to 1.83*SD, the actual SD can still be almost a factor 2 higher than the sampled SD. For N=100 this is down to 0.88*SD to 1.16*SD. So to be sure the sampled SD is close to the actual SD we need to sample a large number of points.
Identities and mathematical properties
The standard deviation is invariant under changes in locationLocation parameterIn statistics, a location family is a class of probability distributions that is parametrized by a scalar- or vector-valued parameter μ, which determines the "location" or shift of the distribution...
, and scales directly with the scaleScale parameterIn probability theory and statistics, a scale parameter is a special kind of numerical parameter of a parametric family of probability distributions...
of the random variable. Thus, for a constant c and random variables X and Y:
The standard deviation of the sum of two random variables can be related to their individual standard deviations and the covariance between them:
where and
and  stand for variance and covarianceCovarianceIn probability theory and statistics, covariance is a measure of how much two variables change together. Variance is a special case of the covariance when the two variables are identical.- Definition :...
, respectively.
The calculation of the sum of squared deviations can be related to momentMoment (mathematics)In mathematics, a moment is, loosely speaking, a quantitative measure of the shape of a set of points. The "second moment", for example, is widely used and measures the "width" of a set of points in one dimension or in higher dimensions measures the shape of a cloud of points as it could be fit by...
s calculated directly from the data. The standard deviation of the sample can be computed as:

The sample standard deviation can be computed as:
For a finite population with equal probabilities at all points, we have
Thus, the standard deviation is equal to the square root of (the average of the squares less the square of the average).
See computational formula for the variance for a proof of this fact, and for an analogous result for the sample standard deviation.
Interpretation and application
A large standard deviation indicates that the data points are far from the mean and a small standard deviation indicates that they are clustered closely around the mean.
For example, each of the three populations {0, 0, 14, 14}, {0, 6, 8, 14} and {6, 6, 8, 8} has a mean of 7. Their standard deviations are 7, 5, and 1, respectively. The third population has a much smaller standard deviation than the other two because its values are all close to 7. In a loose sense, the standard deviation tells us how far from the mean the data points tend to be. It will have the same units as the data points themselves. If, for instance, the data set {0, 6, 8, 14} represents the ages of a population of four siblings in years, the standard deviation is 5 years.
As another example, the population {1000, 1006, 1008, 1014} may represent the distances traveled by four athletes, measured in meters. It has a mean of 1007 meters, and a standard deviation of 5 meters.
Standard deviation may serve as a measure of uncertainty. In physical science, for example, the reported standard deviation of a group of repeated measurementMeasurementMeasurement is the process or the result of determining the ratio of a physical quantity, such as a length, time, temperature etc., to a unit of measurement, such as the metre, second or degree Celsius...
s should give the precisionAccuracy and precisionIn the fields of science, engineering, industry and statistics, the accuracy of a measurement system is the degree of closeness of measurements of a quantity to that quantity's actual value. The precision of a measurement system, also called reproducibility or repeatability, is the degree to which...
of those measurements. When deciding whether measurements agree with a theoretical prediction, the standard deviation of those measurements is of crucial importance: if the mean of the measurements is too far away from the prediction (with the distance measured in standard deviations), then the theory being tested probably needs to be revised. This makes sense since they fall outside the range of values that could reasonably be expected to occur if the prediction were correct and the standard deviation appropriately quantified. See prediction intervalPrediction intervalIn statistical inference, specifically predictive inference, a prediction interval is an estimate of an interval in which future observations will fall, with a certain probability, given what has already been observed...
.
Application examples
The practical value of understanding the standard deviation of a set of values is in appreciating how much variation there is from the "average" (mean).
Climate
As a simple example, consider the average daily maximum temperatures for two cities, one inland and one on the coast. It is helpful to understand that the range of daily maximum temperatures for cities near the coast is smaller than for cities inland. Thus, while these two cities may each have the same average maximum temperature, the standard deviation of the daily maximum temperature for the coastal city will be less than that of the inland city as, on any particular day, the actual maximum temperature is more likely to be farther from the average maximum temperature for the inland city than for the coastal one.
Sports
Another way of seeing it is to consider sports teams. In any set of categories, there will be teams that rate highly at some things and poorly at others. Chances are, the teams that lead in the standings will not show such disparity but will perform well in most categories. The lower the standard deviation of their ratings in each category, the more balanced and consistent they will tend to be. Teams with a higher standard deviation, however, will be more unpredictable. For example, a team that is consistently bad in most categories will have a low standard deviation. A team that is consistently good in most categories will also have a low standard deviation. However, a team with a high standard deviation might be the type of team that scores a lot (strong offense) but also concedes a lot (weak defense), or, vice versa, that might have a poor offense but compensates by being difficult to score on.
Trying to predict which teams, on any given day, will win, may include looking at the standard deviations of the various team "stats" ratings, in which anomalies can match strengths vs. weaknesses to attempt to understand what factors may prevail as stronger indicators of eventual scoring outcomes.
In racingRacingA sport race is a competition of speed, against an objective criterion, usually a clock or to a specific point. The competitors in a race try to complete a given task in the shortest amount of time...
, a driver is timed on successive laps. A driver with a low standard deviation of lap times is more consistent than a driver with a higher standard deviation. This information can be used to help understand where opportunities might be found to reduce lap times.
Finance
In finance, standard deviation is a representation of the risk associated with price-fluctuations of a given asset (stocks, bonds, property, etc.), or the risk of a portfolio of assets (actively managed mutual funds, index mutual funds, or ETFs). Risk is an important factor in determining how to efficiently manage a portfolio of investments because it determines the variation in returns on the asset and/or portfolio and gives investors a mathematical basis for investment decisions (known as mean-variance optimization). The fundamental concept of risk is that as it increases, the expected return on an investment should increase as well, an increase known as the "risk premium." In other words, investors should expect a higher return on an investment when that investment carries a higher level of risk or uncertainty. When evaluating investments, investors should estimate both the expected return and the uncertainty of future returns. Standard deviation provides a quantified estimate of the uncertainty of future returns.
For example, let's assume an investor had to choose between two stocks. Stock A over the past 20 years had an average return of 10 percent, with a standard deviation of 20 percentage pointPercentage pointPercentage points are the unit for the arithmetic difference of two percentages.Consider the following hypothetical example: in 1980, 40 percent of the population smoked, and in 1990 only 30 percent smoked...
s (pp) and Stock B, over the same period, had average returns of 12 percent but a higher standard deviation of 30 pp. On the basis of risk and return, an investor may decide that Stock A is the safer choice, because Stock B's additional two percentage points of return is not worth the additional 10 pp standard deviation (greater risk or uncertainty of the expected return). Stock B is likely to fall short of the initial investment (but also to exceed the initial investment) more often than Stock A under the same circumstances, and is estimated to return only two percent more on average. In this example, Stock A is expected to earn about 10 percent, plus or minus 20 pp (a range of 30 percent to -10 percent), about two-thirds of the future year returns. When considering more extreme possible returns or outcomes in future, an investor should expect results of as much as 10 percent plus or minus 60 pp, or a range from 70 percent to −50 percent, which includes outcomes for three standard deviations from the average return (about 99.7 percent of probable returns).
Calculating the average (or arithmetic mean) of the return of a security over a given period will generate the expected return of the asset. For each period, subtracting the expected return from the actual return results in the difference from the mean. Squaring the difference in each period and taking the average gives the overall variance of the return of the asset. The larger the variance, the greater risk the security carries. Finding the square root of this variance will give the standard deviation of the investment tool in question.
Population standard deviation is used to set the width of Bollinger BandsBollinger bandsBollinger Bands and the related indicators %b and BandWidth are technical analysis tools invented by John Bollinger in the 1980s. Having evolved from the concept of trading bands, Bollinger Bands can be used to measure the highness or lowness of the price relative to previous trades.Bollinger Bands...
, a widely adopted technical analysisTechnical analysisIn finance, technical analysis is security analysis discipline for forecasting the direction of prices through the study of past market data, primarily price and volume. Behavioral economics and quantitative analysis incorporate technical analysis, which being an aspect of active management stands...
tool. For example, the upper Bollinger Band is given as The most commonly used value for n is 2; there is about a five percent chance of going outside, assuming a normal distribution of returns.
Geometric interpretation
To gain some geometric insights and clarification, we will start with a population of three values, x1, x2, x3. This defines a point P = (x1, x2, x3) in R3. Consider the line L = {(r, r, r) : r ∈ R}. This is the "main diagonal" going through the origin. If our three given values were all equal, then the standard deviation would be zero and P would lie on L. So it is not unreasonable to assume that the standard deviation is related to the distance of P to L. And that is indeed the case. To move orthogonally from L to the point P, one begins at the point:

whose coordinates are the mean of the values we started out with. A little algebra shows that the distance between P and M (which is the same as the orthogonal distance between P and the line L) is equal to the standard deviation of the vector x1, x2, x3, multiplied by the square root of the number of dimensions of the vector (3 in this case.)
Chebyshev's inequality
An observation is rarely more than a few standard deviations away from the mean. Chebyshev's inequality ensures that, for all distributions for which the standard deviation is defined, the amount of data within a number of standard deviations of the mean is at least as much as given in the following table.
Minimum population Distance from mean 50% √2 75% 2 89% 3 94% 4 96% 5 97% 6 


Rules for normally distributed data
The central limit theoremCentral limit theoremIn probability theory, the central limit theorem states conditions under which the mean of a sufficiently large number of independent random variables, each with finite mean and variance, will be approximately normally distributed. The central limit theorem has a number of variants. In its common...
says that the distribution of an average of many independent, identically distributed random variables tends toward the famous bell-shaped normal distribution with a probability density functionProbability density functionIn probability theory, a probability density function , or density of a continuous random variable is a function that describes the relative likelihood for this random variable to occur at a given point. The probability for the random variable to fall within a particular region is given by the...
of:
where μ is the expected valueExpected valueIn probability theory, the expected value of a random variable is the weighted average of all possible values that this random variable can take on...
of the random variables, σ equals their distribution's standard deviation divided by n1/2, and n is the number of random variables. The standard deviation therefore is simply a scaling variable that adjusts how broad the curve will be, though it also appears in the normalizing constantNormalizing constantThe concept of a normalizing constant arises in probability theory and a variety of other areas of mathematics.-Definition and examples:In probability theory, a normalizing constant is a constant by which an everywhere non-negative function must be multiplied so the area under its graph is 1, e.g.,...
.
If a data distribution is approximately normal then the proportion of data values within z standard deviations of the mean is defined by:- Proportion =

where is the error functionError functionIn mathematics, the error function is a special function of sigmoid shape which occurs in probability, statistics and partial differential equations...
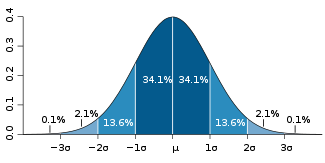
. If a data distribution is approximately normal then about 68 percent of the data values are within one standard deviation of the mean (mathematically, μ ± σ, where μ is the arithmetic mean), about 95 percent are within two standard deviations (μ ± 2σ), and about 99.7 percent lie within three standard deviations (μ ± 3σ). This is known as the 68-95-99.7 rule68-95-99.7 ruleIn statistics, the 68-95-99.7 rule, or three-sigma rule, or empirical rule, states that for a normal distribution, nearly all values lie within 3 standard deviations of the mean....
, or the empirical rule.
For various values of z, the percentage of values expected to lie in and outside the symmetric interval, CI = (−zσ, zσ), are as follows:zσ Percentage within CI Percentage outside CI Fraction outside CI σ % % 1 / σ 68% 32% 1 / 3.125 1σ % % 1 / σ 80% 20% 1 / 5 σ 90% 10% 1 / 10 σ 95% 5% 1 / 20 2σ % % 1 / σ 99% 1% 1 / 100 3σ % % 1 / 370.398 σ 99.9% 0.1% 1 / σ 99.99% 0.01% 1 / 4σ % % 1 / σ 99.999% 0.001% 1 / σ % % 1 / 5σ % % 1 / σ % % 1 / σ % % 1 / 6σ % % 1 / σ % % 1 / σ % % 1 / σ % % 1 / 7σ % 1 /
Relationship between standard deviation and mean
The mean and the standard deviation of a set of data are usually reported together. In a certain sense, the standard deviation is a "natural" measure of statistical dispersionStatistical dispersionIn statistics, statistical dispersion is variability or spread in a variable or a probability distribution...
if the center of the data is measured about the mean. This is because the standard deviation from the mean is smaller than from any other point. The precise statement is the following: suppose x1, ..., xn are real numbers and define the function:
Using calculusCalculusCalculus is a branch of mathematics focused on limits, functions, derivatives, integrals, and infinite series. This subject constitutes a major part of modern mathematics education. It has two major branches, differential calculus and integral calculus, which are related by the fundamental theorem...
or by completing the squareCompleting the squareIn elementary algebra, completing the square is a technique for converting a quadratic polynomial of the formax^2 + bx + c\,\!to the formIn this context, "constant" means not depending on x. The expression inside the parenthesis is of the form ...
, it is possible to show that σ(r) has a unique minimum at the mean:

Variability can also be measured by the coefficient of variationCoefficient of variationIn probability theory and statistics, the coefficient of variation is a normalized measure of dispersion of a probability distribution. It is also known as unitized risk or the variation coefficient. The absolute value of the CV is sometimes known as relative standard deviation , which is...
, which is the ratio of the standard deviation to the mean. It is a dimensionless number.
Often we want some information about the precision of the mean we obtained. We can obtain this by determining the standard deviation of the sampled mean.
The standard deviation of the mean is related to the standard deviation of the distribution by:

where N is the number of observation in the sample used to estimate the mean. This can easily be proven with:
hence
Resulting in:
Rapid calculation methods
The following two formulas can represent a running (continuous) standard deviation. A set of three power sums s0, s1, s2 are each computed over a set of N values of x, denoted as x1, ..., xN:
Note that s0 raises x to the zero power, and since x0 is always 1, s0 evaluates to N.
Given the results of these three running summations, the values s0, s1, s2 can be used at any time to compute the current value of the running standard deviation:

Similarly for sample standard deviation,
In a computer implementation, as the three sj sums become large, we need to consider round-off errorRound-off errorA round-off error, also called rounding error, is the difference between the calculated approximation of a number and its exact mathematical value. Numerical analysis specifically tries to estimate this error when using approximation equations and/or algorithms, especially when using finitely many...
, arithmetic overflowArithmetic overflowThe term arithmetic overflow or simply overflow has the following meanings.# In a computer, the condition that occurs when a calculation produces a result that is greater in magnitude than that which a given register or storage location can store or represent.# In a computer, the amount by which a...
, and arithmetic underflowArithmetic underflowThe term arithmetic underflow is a condition in a computer program that can occur when the true result of afloating point operation is smaller in magnitude...
. The method below calculates the running sums method with reduced rounding errors:
where A is the mean value.
Sample variance:
Standard variance:
Weighted calculation
When the values xi are weighted with unequal weights wi, the power sums s0, s1, s2 are each computed as:
And the standard deviation equations remain unchanged. Note that s0 is now the sum of the weights and not the number of samples N.
The incremental method with reduced rounding errors can also be applied, with some additional complexity.
A running sum of weights must be computed:
and places where 1/i is used above must be replaced by wi/Wi:
In the final division,
and
where n is the total number of elements, and n' is the number of elements with non-zero weights.
The above formulas become equal to the simpler formulas given above if weights are taken as equal to one.
Population-based statistics
The populations of sets, which may overlap, can be calculated simply as follows:
Standard deviations of non-overlapping sub-populations can be aggregated as follows if the size (actual or relative to one another) and means of each are known:-
For example, suppose it is known that the average American man has a mean height of 70 inches with a standard deviation of three inches and that the average American woman has a mean height of 65 inches with a standard deviation of two inches. Also assume that the number of men, N, is equal to the number of women. Then the mean and standard deviation of heights of American adults could be calculated as:-
For the more general case of M non-overlapping populations, X1 through XM, and the aggregate population :
:
-
where-

If the size (actual or relative to one another), mean, and standard deviation of two overlapping populations are known for the populations as well as their intersection, then the standard deviation of the overall population can still be calculated as follows:
If two or more sets of data are being added together datapoint by datapoint, the standard deviation of the result can be calculated if the standard deviation of each data set and the covariance between each pair of data sets is known:
For the special case where no correlation exists between any pair of data sets, then the relation reduces to the root-mean-square:
Sample-based statistics
Standard deviations of non-overlapping sub-samples can be aggregated as follows if the actual size and means of each are known:
For the more general case of M non-overlapping data sets, X1 through XM, and the aggregate data set :
:
where:
If the size, mean, and standard deviation of two overlapping samples are known for the samples as well as their intersection, then the standard deviation of the aggregated sample can still be calculated. In general:
History
The term standard deviation was first used in writing by Karl PearsonKarl PearsonKarl Pearson FRS was an influential English mathematician who has been credited for establishing the disciplineof mathematical statistics....
in 1894, following his use of it in lectures. This was as a replacement for earlier alternative names for the same idea: for example, GaussCarl Friedrich GaussJohann Carl Friedrich Gauss was a German mathematician and scientist who contributed significantly to many fields, including number theory, statistics, analysis, differential geometry, geodesy, geophysics, electrostatics, astronomy and optics.Sometimes referred to as the Princeps mathematicorum...
used mean error.
See also
- Accuracy and precisionAccuracy and precisionIn the fields of science, engineering, industry and statistics, the accuracy of a measurement system is the degree of closeness of measurements of a quantity to that quantity's actual value. The precision of a measurement system, also called reproducibility or repeatability, is the degree to which...
- Chebyshev's inequalityChebyshev's inequalityIn probability theory, Chebyshev’s inequality guarantees that in any data sample or probability distribution,"nearly all" values are close to the mean — the precise statement being that no more than 1/k2 of the distribution’s values can be more than k standard deviations away from the mean...
An inequality on location and scale parameters - CumulantCumulantIn probability theory and statistics, the cumulants κn of a probability distribution are a set of quantities that provide an alternative to the moments of the distribution. The moments determine the cumulants in the sense that any two probability distributions whose moments are identical will have...
- Deviation (statistics)Deviation (statistics)In mathematics and statistics, deviation is a measure of difference for interval and ratio variables between the observed value and the mean. The sign of deviation , reports the direction of that difference...
- Distance correlationDistance correlationIn statistics and in probability theory, distance correlation is a measure of statistical dependence between two random variables or two random vectors of arbitrary, not necessarily equal dimension. Its important property is that this measure of dependence is zero if and only if the random...
Distance standard deviation - Error barError barError bars are a graphical representation of the variability of data and are used on graphs to indicate the error, or uncertainty in a reported measurement. They give a general idea of how accurate a measurement is, or conversely, how far from the reported value the true value might be...
- Geometric standard deviationGeometric standard deviationIn probability theory and statistics, the geometric standard deviation describes how spread out are a set of numbers whose preferred average is the geometric mean...
- Mahalanobis distanceMahalanobis distanceIn statistics, Mahalanobis distance is a distance measure introduced by P. C. Mahalanobis in 1936. It is based on correlations between variables by which different patterns can be identified and analyzed. It gauges similarity of an unknown sample set to a known one. It differs from Euclidean...
generalizing number of standard deviations to the mean - Mean absolute errorMean absolute errorIn statistics, the mean absolute error is a quantity used to measure how close forecasts or predictions are to the eventual outcomes. The mean absolute error is given by...
- Pooled variancePooled varianceIn statistics, many times, data are collected for a dependent variable, y, over a range of values for the independent variable, x. For example, the observation of fuel consumption might be studied as a function of engine speed while the engine load is held constant...
pooled standard deviation - Raw scoreRaw scoreIn statistics and data analysis, a raw score is an original datum that has not been transformed. This may include, for example, the original result obtained by a student on a test as opposed to that score after transformation to a standard score or percentile rank or the like.Often the conversion...
- Root mean squareRoot mean squareIn mathematics, the root mean square , also known as the quadratic mean, is a statistical measure of the magnitude of a varying quantity. It is especially useful when variates are positive and negative, e.g., sinusoids...
- Sample sizeSample sizeSample size determination is the act of choosing the number of observations to include in a statistical sample. The sample size is an important feature of any empirical study in which the goal is to make inferences about a population from a sample...
- Samuelson's inequalitySamuelson's inequalityIn statistics, Samuelson's inequality, named after the economist Paul Samuelson, also called the Laguerre–Samuelson inequality, after the mathematician Edmond Laguerre, states that every one of any collection x1, ..., xn, is within √ standard deviations of their mean...
- Standard errorStandard error (statistics)The standard error is the standard deviation of the sampling distribution of a statistic. The term may also be used to refer to an estimate of that standard deviation, derived from a particular sample used to compute the estimate....
- Volatility (finance)Volatility (finance)In finance, volatility is a measure for variation of price of a financial instrument over time. Historic volatility is derived from time series of past market prices...
- Yamartino methodYamartino methodThe Yamartino method is an algorithm for calculating an approximation to the standard deviation σθ of wind direction θ during a single pass through the incoming data...
for calculating standard deviation of wind direction
External links
- A simple way to understand Standard Deviation
- Standard Deviation – an explanation without maths
- Standard Deviation, an elementary introduction
- Standard Deviation while Financial Modeling in Excel
- Standard Deviation, a simpler explanation for writers and journalists
- The concept of Standard Deviation is shown in this 8 feet (2.4 m) Probability Machine (named Sir Francis) comparing stock market returns to the randomness of the beans dropping through the quincunx pattern. from Index Funds Advisors IFA.com
- Accuracy and precision
-
-
-
-
-
-