

Spectrum analyzer
Encyclopedia
A spectrum analyzer measures the magnitude of an input signal versus frequency within the full frequency range of the instrument. The primary use is to measure the power of the spectrum of known and unknown signals. The input signal a spectrum analyzer measures is electrical
, however, spectral
compositions of other signals, such as acoustic
pressure waves and optical
light waves, can be considered through the use of an appropriate transducer
.
By analyzing the spectra
of electrical
signals, dominant frequency
, power
, distortion
, harmonics, bandwidth, and other spectral
components of a signal can be observed that are not easily detectable in time domain
waveform
s. These parameters are useful in the characterization of electronic devices, such as wireless transmitters
.
The display of a spectrum analyzer has frequency on the horizontal axis and the amplitude displayed on the vertical axis. To the casual observer, a spectrum analyzer looks like an oscilloscope and, in fact, some lab instruments can function either as an oscilloscope or a spectrum analyzer.
based spectrum analyzers:
Some spectrum analyzers, such as real-time spectrum analyzers, use a hybrid technique where the incoming signal is first down-converted to a lower frequency using superheterodyne techniques and then analyzed using fast fourier transformation (FFT) techniques.
. Due to their architecture, bench top spectrum analyzers typically weigh more than 30 lbs. Some bench top spectrum analyzers offer optional battery pack
s, allowing them to be used away from AC power
. This type of analyzer is often referred to as a "portable" spectrum analyzer.
by sweeping the voltage-controlled oscillator
through a range of frequencies, enabling the consideration of the full frequency range of the instrument.
The bandwidth of the band-pass filter
dictates the resolution bandwidth, which is related to the minimum bandwidth detectable by the instrument. As demonstrated by the animation to the right, the smaller the bandwidth, the more spectral resolution. However, there is a trade-off between how quickly the display can update the full frequency span under consideration and the frequency resolution, which is relevant for distinguishing frequency components that are close together. For a swept-tuned architecture, this relation for sweep time is useful:

Where ST is sweep time in seconds, k is proportionality constant, Span is the frequency range under consideration in Hertz, and RBW is the resolution bandwidth in Hertz.
Sweeping too fast, however, causes a drop in displayed amplitude and a shift in the displayed frequency.
Also, notice that the animation contains both up and down converted spectra, which is a due to frequency mixer
producing both sum and difference frequencies. The LO
feedthrough is due to the imperfect isolation of the LO
signal path to the IF
signal path in the mixer
.
For very weak signals, a pre-amplifier is used, although harmonic
and intermodulation
distortion may lead to the creation of new frequency components that were not present in the original signal.
 , the inverse of the time T over which the waveform is measured and Fourier transformed.
With Fourier transform analysis in a digital spectrum analyzer, it is necessary to sample the input signal with a sampling frequency that is at least twice the bandwidth of the signal, due to the Nyquist limit
. A Fourier transform will then produce a spectrum containing all frequencies from zero to . This can place considerable demands on the required analog-to-digital converter
and processing power for the Fourier transform, making FFT based spectrum analyzers limited in frequency range.
This method is made possible by first down converting the signal, then digitizing the intermediary frequency
and using superheterdyne or FFT techniques to acquire the spectrum.
One benefit of digitizing the intermediary frequency is the ability to use digital filter
s, which have a range of advantages over analog filters such as near perfect shape factors and improved filter settling time. Also, for consideration of narrow spans, the FFT can be used to increase sweep time without distorting the displayed spectrum.
An alternate method, which doesn't use a high local oscillator
(LO) (that usually produces a high-frequency signal close to the signal) is used on the latest analyzer generation like Aaronia
´s Spectran series. The advantage of this new method is a very low noise floor
near the physical thermal noise limit of -174 dBm (1 Hz) .
A Realtime Spectrum Analyser does not have any such blind time. The analyser is able to sample the incoming RF spectrum in the time domain and convert the information to the frequency domain using the FFT process. FFT's are processed in parallel, gap-less and overlapped so there are no gaps in the calculated RF spectrum and no information is missed.
capability is a realtime analyzer. It samples data fast enough to satisfy Nyquist Sampling theorem and stores the data in memory for later processing. This kind of analyser is only realtime for the amount of data / capture time it can store in memory and still produces gaps in the spectrum and results during processing time.
Example: For an analyser with 40 MHz of Realtime bandwidth (the maximum RF span that can be processed in realtime) approximately 50Msample/second (complex) are needed. If the spectrum analyzer produces 250,000 FFT/s an FFT calculation is produced every 4us. For a 1024 point FFT a full spectrum is produced 1024 x (1/50x10^6), approximately every 20us. This also gives us our overlap rate of 80% (20us - 4us)/20us = 80%.
Realtime spectrum analyzers are able to produce much more information for users to examine the frequency spectrum in more detail. A normal swept spectrum analyzer would produce max peak, min peak displays for example but a realtime spectrum analyzer is able to plot all calculated FFT's over a given period of time with the added colour coding which represents how often a signal appears. For example, this image shows the difference between how a spectrum is displayed in a normal swept spectrum view and using a "Persistence" view on a realtime spectrum analyzer.
Realtime spectrum analyzers are able to see signals hidden behind other signals. This is possible because no information is missed and the display to the user is the output of FFT calculations. Here is an example of a Bluetooth signal behind a Wireless LAN signal.
path. Adjusting the bandwidth of this filter allows for the discrimination of signals with closely spaced frequency components, while also changing the measured noise floor. Decreasing the bandwidth of RBW filter decreases the measured noise floor and vice-versa. This is due to higher RBW filters passing more frequency components through to the envelope detector
than lower bandwidth RBW filters, therefore a higher RBW causes a higher measured noise floor.
directly after the envelope detector
. This filter is used to “smooth” the display by removing noise from the envelope. Similar to the RBW, the VBW affects the sweep time of the display if the VBW is less than the RBW. If VBW is less than RBW, this relation for sweep time is useful:

Where ST is sweep time in seconds, k is proportionality constant, Span is the frequency range under consideration in Hertz, RBW is the resolution bandwidth in Hertz, and VBW is the video bandwidth in Hertz.
s to sample spectrum amplitude after the VBW filter. Since displays have a discrete number of points, the frequency span measured is also discretized. Detectors are used in an attempt to adequately map the correct signal power to the appropriate frequency point on the display. There are in general three types of detectors: sample, peak, and average
, noise
and distortion
characteristics of all kinds of RF circuitry, by comparing the input and output spectra.
In telecommunications, spectrum analyzers are used to determine occupied bandwidth and track interference sources. For example, cell planners use this equipment to determine interference sources in the GSM frequency bands and UMTS frequency bands
.
In EMC testing
, a spectrum analyzer is used for basic precompliance testing; however, it can not be used for full testing and certification, an EMI Receiver like the Rohde & Schwarz
ESU EMI Receiver or Agilent Technologies
N9038A MXE EMI is used.
A spectrum analyzer is used to determine whether a wireless transmitter is working according to federally-defined standards for purity of emissions. Output signals at frequencies other than the intended communications frequency appear as vertical lines (pips) on the display. A spectrum analyzer is also used to determine, by direct observation, the bandwidth of a digital or analog signal.
A spectrum analyzer interface is a device that connects to a wireless receiver or a personal computer to allow visual detection and analysis of electromagnetic signals over a defined band of frequencies. This is called panoramic reception and it is used to determine the frequencies of sources of interference to wireless networking equipment, such as Wi-Fi and wireless routers.
Electricity
Electricity is a general term encompassing a variety of phenomena resulting from the presence and flow of electric charge. These include many easily recognizable phenomena, such as lightning, static electricity, and the flow of electrical current in an electrical wire...
, however, spectral
Frequency spectrum
The frequency spectrum of a time-domain signal is a representation of that signal in the frequency domain. The frequency spectrum can be generated via a Fourier transform of the signal, and the resulting values are usually presented as amplitude and phase, both plotted versus frequency.Any signal...
compositions of other signals, such as acoustic
Acoustics
Acoustics is the interdisciplinary science that deals with the study of all mechanical waves in gases, liquids, and solids including vibration, sound, ultrasound and infrasound. A scientist who works in the field of acoustics is an acoustician while someone working in the field of acoustics...
pressure waves and optical
Optics
Optics is the branch of physics which involves the behavior and properties of light, including its interactions with matter and the construction of instruments that use or detect it. Optics usually describes the behavior of visible, ultraviolet, and infrared light...
light waves, can be considered through the use of an appropriate transducer
Transducer
A transducer is a device that converts one type of energy to another. Energy types include electrical, mechanical, electromagnetic , chemical, acoustic or thermal energy. While the term transducer commonly implies the use of a sensor/detector, any device which converts energy can be considered a...
.
By analyzing the spectra
Frequency spectrum
The frequency spectrum of a time-domain signal is a representation of that signal in the frequency domain. The frequency spectrum can be generated via a Fourier transform of the signal, and the resulting values are usually presented as amplitude and phase, both plotted versus frequency.Any signal...
of electrical
Electricity
Electricity is a general term encompassing a variety of phenomena resulting from the presence and flow of electric charge. These include many easily recognizable phenomena, such as lightning, static electricity, and the flow of electrical current in an electrical wire...
signals, dominant frequency
Frequency
Frequency is the number of occurrences of a repeating event per unit time. It is also referred to as temporal frequency.The period is the duration of one cycle in a repeating event, so the period is the reciprocal of the frequency...
, power
Electric power
Electric power is the rate at which electric energy is transferred by an electric circuit. The SI unit of power is the watt.-Circuits:Electric power, like mechanical power, is represented by the letter P in electrical equations...
, distortion
Distortion
A distortion is the alteration of the original shape of an object, image, sound, waveform or other form of information or representation. Distortion is usually unwanted, and often many methods are employed to minimize it in practice...
, harmonics, bandwidth, and other spectral
Frequency spectrum
The frequency spectrum of a time-domain signal is a representation of that signal in the frequency domain. The frequency spectrum can be generated via a Fourier transform of the signal, and the resulting values are usually presented as amplitude and phase, both plotted versus frequency.Any signal...
components of a signal can be observed that are not easily detectable in time domain
Time domain
Time domain is a term used to describe the analysis of mathematical functions, physical signals or time series of economic or environmental data, with respect to time. In the time domain, the signal or function's value is known for all real numbers, for the case of continuous time, or at various...
waveform
Waveform
Waveform means the shape and form of a signal such as a wave moving in a physical medium or an abstract representation.In many cases the medium in which the wave is being propagated does not permit a direct visual image of the form. In these cases, the term 'waveform' refers to the shape of a graph...
s. These parameters are useful in the characterization of electronic devices, such as wireless transmitters
Wireless
Wireless telecommunications is the transfer of information between two or more points that are not physically connected. Distances can be short, such as a few meters for television remote control, or as far as thousands or even millions of kilometers for deep-space radio communications...
.
The display of a spectrum analyzer has frequency on the horizontal axis and the amplitude displayed on the vertical axis. To the casual observer, a spectrum analyzer looks like an oscilloscope and, in fact, some lab instruments can function either as an oscilloscope or a spectrum analyzer.
Types
Spectrum analyzer types are dictated by the methods used to obtain the spectrum of a signal. There are swept-tuned and FFTFast Fourier transform
A fast Fourier transform is an efficient algorithm to compute the discrete Fourier transform and its inverse. "The FFT has been called the most important numerical algorithm of our lifetime ." There are many distinct FFT algorithms involving a wide range of mathematics, from simple...
based spectrum analyzers:
- A swept-tuned spectrum analyzer uses a superheterodyne receiverSuperheterodyne receiverIn electronics, a superheterodyne receiver uses frequency mixing or heterodyning to convert a received signal to a fixed intermediate frequency, which can be more conveniently processed than the original radio carrier frequency...
to down-convert a portion of the input signal spectrum (using a voltage-controlled oscillatorVoltage-controlled oscillatorA voltage-controlled oscillator or VCO is an electronic oscillator designed to be controlled in oscillation frequency by a voltage input. The frequency of oscillation is varied by the applied DC voltage, while modulating signals may also be fed into the VCO to cause frequency modulation or phase...
and a mixerFrequency mixerIn electronics a mixer or frequency mixer is a nonlinear electrical circuit that creates new frequencies from two signals applied to it. In its most common application, two signals at frequencies f1 and f2 are applied to a mixer, and it produces new signals at the sum f1 + f2 and difference f1 -...
) to the center frequency of a band-pass filterBand-pass filterA band-pass filter is a device that passes frequencies within a certain range and rejects frequencies outside that range.Optical band-pass filters are of common usage....
. With a superheterodyne architecture, the voltage-controlled oscillatorVoltage-controlled oscillatorA voltage-controlled oscillator or VCO is an electronic oscillator designed to be controlled in oscillation frequency by a voltage input. The frequency of oscillation is varied by the applied DC voltage, while modulating signals may also be fed into the VCO to cause frequency modulation or phase...
is swept through a range of frequencies, enabling the consideration of the full frequency range of the instrument. - A FFTFast Fourier transformA fast Fourier transform is an efficient algorithm to compute the discrete Fourier transform and its inverse. "The FFT has been called the most important numerical algorithm of our lifetime ." There are many distinct FFT algorithms involving a wide range of mathematics, from simple...
spectrum analyzer computes the discrete Fourier transformDiscrete Fourier transformIn mathematics, the discrete Fourier transform is a specific kind of discrete transform, used in Fourier analysis. It transforms one function into another, which is called the frequency domain representation, or simply the DFT, of the original function...
(DFT), a mathematical process that transforms a waveform into the components of its frequency spectrumFrequency spectrumThe frequency spectrum of a time-domain signal is a representation of that signal in the frequency domain. The frequency spectrum can be generated via a Fourier transform of the signal, and the resulting values are usually presented as amplitude and phase, both plotted versus frequency.Any signal...
, of the input signal.
Some spectrum analyzers, such as real-time spectrum analyzers, use a hybrid technique where the incoming signal is first down-converted to a lower frequency using superheterodyne techniques and then analyzed using fast fourier transformation (FFT) techniques.
Form Factor
Spectrum analyzers tend to fall into three form factors: bench top, portable and handheld.Bench top
This form factor is useful for applications where the spectrum analyzer can be plugged into AC power, which generally means in a lab environment or production/manufacturing area. Bench top spectrum analyzers have historically offered better performance and specifications than the portable or handheld form factor. Bench top spectrum analyzers normally have multiple fans (with associated vents) to dissipate heat produced by the processorCentral processing unit
The central processing unit is the portion of a computer system that carries out the instructions of a computer program, to perform the basic arithmetical, logical, and input/output operations of the system. The CPU plays a role somewhat analogous to the brain in the computer. The term has been in...
. Due to their architecture, bench top spectrum analyzers typically weigh more than 30 lbs. Some bench top spectrum analyzers offer optional battery pack
Battery pack
A battery pack is a set of any number of identical batteries or individual battery cells. They may be configured in a series, parallel or a mixture of both to deliver the desired voltage, capacity, or power density...
s, allowing them to be used away from AC power
AC power
Power in an electric circuit is the rate of flow of energy past a given point of the circuit. In alternating current circuits, energy storage elements such as inductance and capacitance may result in periodic reversals of the direction of energy flow...
. This type of analyzer is often referred to as a "portable" spectrum analyzer.
Portable
This form factor is useful for any applications where the spectrum analyzer needs to be taken outside to make measurements or simply carried while in use. Attributes that contribute to a useful portable spectrum analyzer include:- Optional battery-powered operation to allow the user to move freely outside.
- Clearly-viewable display to allow the screen to be read in bright sunlight, darkness or dusty conditions.
- Light weight (usually less than 15 lbs).
Handheld
This form factor is useful for any application where the spectrum analyzer needs to be very light and small. Handheld analyzers offer a limited capability relative to larger systems. Attributes that contribute to a useful handheld spectrum analyzer include:- Very low power consumption.
- Battery-powered operation while in the field to allow the user to move freely outside.
- Very small size
- Light weight (usually less than 2 lbs).
Theory of Operation
Swept-Tuned
As discussed above in types, a swept-tuned spectrum analyzer down-converts a portion of the input signal spectrum to the center frequency of a band-pass filterBand-pass filter
A band-pass filter is a device that passes frequencies within a certain range and rejects frequencies outside that range.Optical band-pass filters are of common usage....
by sweeping the voltage-controlled oscillator
Voltage-controlled oscillator
A voltage-controlled oscillator or VCO is an electronic oscillator designed to be controlled in oscillation frequency by a voltage input. The frequency of oscillation is varied by the applied DC voltage, while modulating signals may also be fed into the VCO to cause frequency modulation or phase...
through a range of frequencies, enabling the consideration of the full frequency range of the instrument.
The bandwidth of the band-pass filter
Band-pass filter
A band-pass filter is a device that passes frequencies within a certain range and rejects frequencies outside that range.Optical band-pass filters are of common usage....
dictates the resolution bandwidth, which is related to the minimum bandwidth detectable by the instrument. As demonstrated by the animation to the right, the smaller the bandwidth, the more spectral resolution. However, there is a trade-off between how quickly the display can update the full frequency span under consideration and the frequency resolution, which is relevant for distinguishing frequency components that are close together. For a swept-tuned architecture, this relation for sweep time is useful:
Where ST is sweep time in seconds, k is proportionality constant, Span is the frequency range under consideration in Hertz, and RBW is the resolution bandwidth in Hertz.
Sweeping too fast, however, causes a drop in displayed amplitude and a shift in the displayed frequency.
Also, notice that the animation contains both up and down converted spectra, which is a due to frequency mixer
Frequency mixer
In electronics a mixer or frequency mixer is a nonlinear electrical circuit that creates new frequencies from two signals applied to it. In its most common application, two signals at frequencies f1 and f2 are applied to a mixer, and it produces new signals at the sum f1 + f2 and difference f1 -...
producing both sum and difference frequencies. The LO
Voltage-controlled oscillator
A voltage-controlled oscillator or VCO is an electronic oscillator designed to be controlled in oscillation frequency by a voltage input. The frequency of oscillation is varied by the applied DC voltage, while modulating signals may also be fed into the VCO to cause frequency modulation or phase...
feedthrough is due to the imperfect isolation of the LO
Voltage-controlled oscillator
A voltage-controlled oscillator or VCO is an electronic oscillator designed to be controlled in oscillation frequency by a voltage input. The frequency of oscillation is varied by the applied DC voltage, while modulating signals may also be fed into the VCO to cause frequency modulation or phase...
signal path to the IF
Intermediate frequency
In communications and electronic engineering, an intermediate frequency is a frequency to which a carrier frequency is shifted as an intermediate step in transmission or reception. The intermediate frequency is created by mixing the carrier signal with a local oscillator signal in a process called...
signal path in the mixer
Frequency mixer
In electronics a mixer or frequency mixer is a nonlinear electrical circuit that creates new frequencies from two signals applied to it. In its most common application, two signals at frequencies f1 and f2 are applied to a mixer, and it produces new signals at the sum f1 + f2 and difference f1 -...
.
For very weak signals, a pre-amplifier is used, although harmonic
Total harmonic distortion
The total harmonic distortion, or THD, of a signal is a measurement of the harmonic distortion present and is defined as the ratio of the sum of the powers of all harmonic components to the power of the fundamental frequency...
and intermodulation
Intermodulation
Intermodulation or intermodulation distortion is the amplitude modulation of signals containing two or more different frequencies in a system with nonlinearities...
distortion may lead to the creation of new frequency components that were not present in the original signal.
FFT Based
With a FFT based spectrum analyzer, the frequency resolution is, the inverse of the time T over which the waveform is measured and Fourier transformed.With Fourier transform analysis in a digital spectrum analyzer, it is necessary to sample the input signal with a sampling frequency
that is at least twice the bandwidth of the signal, due to the Nyquist limitNyquist rate
In signal processing, the Nyquist rate, named after Harry Nyquist, is two times the bandwidth of a bandlimited signal or a bandlimited channel...
. A Fourier transform will then produce a spectrum containing all frequencies from zero to
. This can place considerable demands on the required analog-to-digital converterAnalog-to-digital converter
An analog-to-digital converter is a device that converts a continuous quantity to a discrete time digital representation. An ADC may also provide an isolated measurement...
and processing power for the Fourier transform, making FFT based spectrum analyzers limited in frequency range.
Hybrid Superheterodyne-FFT
Since FFT based analyzers are only capable of considering narrow bands, one technique is to combine swept and FFT analysis for consideration of wide and narrow spans. This technique allows for faster sweep time.This method is made possible by first down converting the signal, then digitizing the intermediary frequency
Intermediate frequency
In communications and electronic engineering, an intermediate frequency is a frequency to which a carrier frequency is shifted as an intermediate step in transmission or reception. The intermediate frequency is created by mixing the carrier signal with a local oscillator signal in a process called...
and using superheterdyne or FFT techniques to acquire the spectrum.
One benefit of digitizing the intermediary frequency is the ability to use digital filter
Digital filter
In electronics, computer science and mathematics, a digital filter is a system that performs mathematical operations on a sampled, discrete-time signal to reduce or enhance certain aspects of that signal. This is in contrast to the other major type of electronic filter, the analog filter, which is...
s, which have a range of advantages over analog filters such as near perfect shape factors and improved filter settling time. Also, for consideration of narrow spans, the FFT can be used to increase sweep time without distorting the displayed spectrum.
An alternate method, which doesn't use a high local oscillator
Local oscillator
A local oscillator is an electronic device used to generate a signal normally for the purpose of converting a signal of interest to a different frequency using a mixer. This process of frequency conversion, also referred to as heterodyning, produces the sum and difference frequencies of the...
(LO) (that usually produces a high-frequency signal close to the signal) is used on the latest analyzer generation like Aaronia
Aaronia
Aaronia is a startup company based in Euscheid, Germany. Aaronia was founded in 2003 by Thorsten Chmielus and mainly produce spectrum analyzers which base on a patented spectrum analyzer process.In 2004 Aaronia shipped its first spectrum analyzer....
´s Spectran series. The advantage of this new method is a very low noise floor
Noise floor
In signal theory, the noise floor is the measure of the signal created from the sum of all the noise sources and unwanted signals within a measurement system, where the noise is defined as any signal other than the one being monitored....
near the physical thermal noise limit of -174 dBm (1 Hz) .
Realtime FFT
Most modern spectrum analyzers are now almost exclusively Hybrid Superheterodyne-FFT based giving a significant improvement in sweep time. However, even in such cases there is still processing time required to sample the spectrum and calculate the FFT. For this reason, both swept-tuned and FFT based analyser produce "blind time" meaning that while calculation of the spectrum is being performed, the instrument has gaps and misses information of the RF spectrum being applied to the RF front end.A Realtime Spectrum Analyser does not have any such blind time. The analyser is able to sample the incoming RF spectrum in the time domain and convert the information to the frequency domain using the FFT process. FFT's are processed in parallel, gap-less and overlapped so there are no gaps in the calculated RF spectrum and no information is missed.
Online Realtime and Offline realtime
In a sense, any spectrum analyzer that has vector signal analyzerVector signal analyzer
A vector signal analyzer is an instrument that measures the magnitude and phase of the input signal at a single frequency within the IF bandwidth of the instrument...
capability is a realtime analyzer. It samples data fast enough to satisfy Nyquist Sampling theorem and stores the data in memory for later processing. This kind of analyser is only realtime for the amount of data / capture time it can store in memory and still produces gaps in the spectrum and results during processing time.
FFT Overlapping
In all spectrum analyzers we want to have information with the least distortion possible. The FFT process applies windowing techniques to improve the output spectrum due to producing less side lobes. The effect of windowing may also reduce the level of a signal where it is captured on the boundary between one FFT and the next. For this reason FFT's in a Realtime spectrum analyzer are overlapped. Overlapping rate is approximately 80%. An analyzer that utilises a 1024 point FFT process will re-use approximately 819 samples from the previous FFT process.Minimum Signal Detection Time
This is related to the sampling rate of the analyser and the FFT rate. It is also important for the realtime spectrum analyzer to give good level accuracy.Example: For an analyser with 40 MHz of Realtime bandwidth (the maximum RF span that can be processed in realtime) approximately 50Msample/second (complex) are needed. If the spectrum analyzer produces 250,000 FFT/s an FFT calculation is produced every 4us. For a 1024 point FFT a full spectrum is produced 1024 x (1/50x10^6), approximately every 20us. This also gives us our overlap rate of 80% (20us - 4us)/20us = 80%.
Persistence
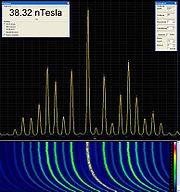
Realtime spectrum analyzers are able to produce much more information for users to examine the frequency spectrum in more detail. A normal swept spectrum analyzer would produce max peak, min peak displays for example but a realtime spectrum analyzer is able to plot all calculated FFT's over a given period of time with the added colour coding which represents how often a signal appears. For example, this image shows the difference between how a spectrum is displayed in a normal swept spectrum view and using a "Persistence" view on a realtime spectrum analyzer.
Hidden Signals
Realtime spectrum analyzers are able to see signals hidden behind other signals. This is possible because no information is missed and the display to the user is the output of FFT calculations. Here is an example of a Bluetooth signal behind a Wireless LAN signal.
Center Frequency and Span
In a typical spectrum analyzer there are options to set the start, stop, and center frequency. The frequency between the stop and start frequencies on a spectrum analyzer display is known as the center frequency. This is the frequency that is in the middle of the display’s frequency axis. Span specifies the range between the start and stop frequencies. These two parameters allow for adjustment of the display within the frequency range of the instrument to enhance visibility of the spectrum measured.Resolution Bandwidth
As discussed in the operation section, the resolution bandwidth filter or RBW filter is the bandpass filter in the IFIntermediate frequency
In communications and electronic engineering, an intermediate frequency is a frequency to which a carrier frequency is shifted as an intermediate step in transmission or reception. The intermediate frequency is created by mixing the carrier signal with a local oscillator signal in a process called...
path. Adjusting the bandwidth of this filter allows for the discrimination of signals with closely spaced frequency components, while also changing the measured noise floor. Decreasing the bandwidth of RBW filter decreases the measured noise floor and vice-versa. This is due to higher RBW filters passing more frequency components through to the envelope detector
Envelope detector
An envelope detector is an electronic circuit that takes a high-frequency signal as input and provides an output which is the "envelope" of the original signal. The capacitor in the circuit stores up charge on the rising edge, and releases it slowly through the resistor when the signal falls...
than lower bandwidth RBW filters, therefore a higher RBW causes a higher measured noise floor.
Video bandwidth
The video bandwidth filter or VBW filter is the low-pass filterLow-pass filter
A low-pass filter is an electronic filter that passes low-frequency signals but attenuates signals with frequencies higher than the cutoff frequency. The actual amount of attenuation for each frequency varies from filter to filter. It is sometimes called a high-cut filter, or treble cut filter...
directly after the envelope detector
Envelope detector
An envelope detector is an electronic circuit that takes a high-frequency signal as input and provides an output which is the "envelope" of the original signal. The capacitor in the circuit stores up charge on the rising edge, and releases it slowly through the resistor when the signal falls...
. This filter is used to “smooth” the display by removing noise from the envelope. Similar to the RBW, the VBW affects the sweep time of the display if the VBW is less than the RBW. If VBW is less than RBW, this relation for sweep time is useful:
Where ST is sweep time in seconds, k is proportionality constant, Span is the frequency range under consideration in Hertz, RBW is the resolution bandwidth in Hertz, and VBW is the video bandwidth in Hertz.
Detector
With the advent of digitally based displays, some modern spectrum analyzers use analog-to-digital converterAnalog-to-digital converter
An analog-to-digital converter is a device that converts a continuous quantity to a discrete time digital representation. An ADC may also provide an isolated measurement...
s to sample spectrum amplitude after the VBW filter. Since displays have a discrete number of points, the frequency span measured is also discretized. Detectors are used in an attempt to adequately map the correct signal power to the appropriate frequency point on the display. There are in general three types of detectors: sample, peak, and average
- Sample detection – sample detection simply uses the midpoint of a given interval as the display point value. While this method does represent random noise well, it does not always capture all sinusoidal signals.
- Peak detection – peak detection uses the maximum measured point within a given interval as the display point value. This insures that the maximum sinusoid is measured within the interval; however, smaller sinusoids within the interval may not be measured. Also, peak detection does not give a good representation of random noise.
- Average detection – average detection uses all of the data points within the interval to consider the display point value. This is done by power (rmsRoot mean squareIn mathematics, the root mean square , also known as the quadratic mean, is a statistical measure of the magnitude of a varying quantity. It is especially useful when variates are positive and negative, e.g., sinusoids...
) averaging, voltage averaging, or log-power averaging.
Displayed average noise level
The Displayed Average Noise Level (DANL) is directly associated with amplitude specifications in a given electronic signal, and the signal's Noise-to-Noise ratio.RF uses
Spectrum analyzers are widely used to measure the frequency responseFrequency response
Frequency response is the quantitative measure of the output spectrum of a system or device in response to a stimulus, and is used to characterize the dynamics of the system. It is a measure of magnitude and phase of the output as a function of frequency, in comparison to the input...
, noise
Electronic noise
Electronic noise is a random fluctuation in an electrical signal, a characteristic of all electronic circuits. Noise generated by electronic devices varies greatly, as it can be produced by several different effects...
and distortion
Distortion
A distortion is the alteration of the original shape of an object, image, sound, waveform or other form of information or representation. Distortion is usually unwanted, and often many methods are employed to minimize it in practice...
characteristics of all kinds of RF circuitry, by comparing the input and output spectra.
In telecommunications, spectrum analyzers are used to determine occupied bandwidth and track interference sources. For example, cell planners use this equipment to determine interference sources in the GSM frequency bands and UMTS frequency bands
UMTS frequency bands
The UMTS frequency bands are radio frequencies used by third generation wireless Universal Mobile Telecommunications System networks.They were allocated by delegates to the World Administrative Radio Conference held in Málaga-Torremolinos, Spain between February 3, 1992 and March 3, 1992...
.
In EMC testing
Electromagnetic compatibility
Electromagnetic compatibility is the branch of electrical sciences which studies the unintentional generation, propagation and reception of electromagnetic energy with reference to the unwanted effects that such energy may induce...
, a spectrum analyzer is used for basic precompliance testing; however, it can not be used for full testing and certification, an EMI Receiver like the Rohde & Schwarz
Rohde & Schwarz
Rohde & Schwarz is an independent group of companies specializing in electronics. Well known as a manufacturer of electronic test equipment, they also manufacture equipment used for broadcasting, radiolocation, and radio communications...
ESU EMI Receiver or Agilent Technologies
Agilent Technologies
Agilent Technologies , or Agilent, is a company that designs and manufactures electronic and bio-analytical measurement instruments and equipment for measurement and evaluation...
N9038A MXE EMI is used.
A spectrum analyzer is used to determine whether a wireless transmitter is working according to federally-defined standards for purity of emissions. Output signals at frequencies other than the intended communications frequency appear as vertical lines (pips) on the display. A spectrum analyzer is also used to determine, by direct observation, the bandwidth of a digital or analog signal.
A spectrum analyzer interface is a device that connects to a wireless receiver or a personal computer to allow visual detection and analysis of electromagnetic signals over a defined band of frequencies. This is called panoramic reception and it is used to determine the frequencies of sources of interference to wireless networking equipment, such as Wi-Fi and wireless routers.
See also
- Electrical measurementsElectrical measurementsElectrical measurements are the methods, devices and calculations used to measure electrical quantities. Measurement of electrical quantities may be done to measure electrical parameters of a system...
- Electromagnetic spectrumElectromagnetic spectrumThe electromagnetic spectrum is the range of all possible frequencies of electromagnetic radiation. The "electromagnetic spectrum" of an object is the characteristic distribution of electromagnetic radiation emitted or absorbed by that particular object....
- Measuring receiverMeasuring ReceiverIn telecommunication, a measuring receiver or measurement receiver is a calibrated laboratory-grade radio receiver designed to measure the characteristics of radio signals. The parameters of such receivers can usually be adjusted over a much wider range of values than is the case with other radio...
- Spectral leakageSpectral leakageSpectral leakage is an effect in the frequency analysis of finite-length signals or finite-length segments of infinite signals where it appears as if some energy has "leaked" out of the original signal spectrum into other frequencies....
- Spectral musicSpectral musicSpectral music is a musical composition practice where compositional decisions are often informed by the analysis of sound spectra. Computer-based sound spectrum analysis using tools like DFT, FFT, and spectrograms...
- SpectrogramSpectrogramA spectrogram is a time-varying spectral representation that shows how the spectral density of a signal varies with time. Also known as spectral waterfalls, sonograms, voiceprints, or voicegrams, spectrograms are used to identify phonetic sounds, to analyse the cries of animals; they were also...
- SpectrometerSpectrometerA spectrometer is an instrument used to measure properties of light over a specific portion of the electromagnetic spectrum, typically used in spectroscopic analysis to identify materials. The variable measured is most often the light's intensity but could also, for instance, be the polarization...
External links
- Fundamentals of Modern Spectral Analysis
- Swept Spectrum Analyzer Tutorial and Basics
- Sri Welaratna, "30 years of FFT Analyzers", Sound and Vibration (January 1997, 30th anniversary issue). A historical review of hardware spectrum-analyzer devices.