

Scientific visualization
Encyclopedia
Scientific visualization (also spelled scientific visualisation) is an interdisciplinary branch of science according to Friendly (2008) "primarily concerned with the visualization of three-dimensional
phenomena (architectural, meteorological, medical, biological
, etc.), where the emphasis is on realistic renderings of volumes, surfaces, illumination sources, and so forth, perhaps with a dynamic (time) component".
 One of the earliest examples of three-dimensional scientific visualisation was Maxwell's thermodynamic surface
, sculpted in clay in 1874 by James Clerk Maxwell
. This prefigured modern scientific visualization techniques that use computer graphics
.
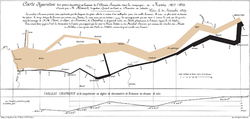
Notable early two-dimensional examples include the flow map
of Napoleon’s March on Moscow
produced by Charles Joseph Minard
in 1869; the “coxcombs” used by Florence Nightingale
in 1857 as part of a campaign to improve sanitary conditions in the British army; and the dot map
used by John Snow
in 1855 to visualise the Broad Street cholera outbreak
.

is the art, technique, and science of creating moving images via the use of computer
s. It is becoming more common to be created by means of 3D computer graphics
, though 2D computer graphics
are still widely used for stylistic, low bandwidth, and faster real-time rendering needs. Sometimes the target of the animation is the computer itself, but sometimes the target is another medium, such as film
. It is also referred to as CGI (Computer-generated imagery
or computer-generated imaging), especially when used in films.
is a computer program, or network of computers, that attempts to simulate
an abstract model of a particular system. Computer simulations have become a useful part of mathematical model
ling of many natural systems in physics, and computational physics, chemistry and biology; human systems in economics, psychology, and social science; and in the process of engineering and new technology, to gain insight into the operation of those systems, or to observe their behavior. The simultaneous visualization and simulation of a system is called visulation
.
Computer simulations vary from computer programs that run a few minutes, to network-based groups of computers running for hours, to ongoing simulations that run for months. The scale of events being simulated by computer simulations has far exceeded anything possible (or perhaps even imaginable) using the traditional paper-and-pencil mathematical modeling: over 10 years ago, a desert-battle simulation, of one force invading another, involved the modeling of 66,239 tanks, trucks and other vehicles on simulated terrain around Kuwait
, using multiple supercomputers in the DoD
High Performance Computer Modernization Program.
is the study of "the visual
representation
of large-scale collections of non-numerical information, such as files and lines of code in software system
s, library
and bibliographic database
s, networks of relations on the internet
, and so forth".
Information visualization focused on the creation of approaches for conveying abstract information in intuitive ways. Visual representations and interaction techniques take advantage of the human eye’s broad bandwidth pathway into the mind to allow users to see, explore, and understand large amounts of information at once.
shows how new interfaces and a better understanding of underlying perceptual issues create new opportunities for the scientific visualization community.
is the process of generating an image from a model, by means of computer programs. The model is a description of three dimensional objects in a strictly defined language or data structure. It would contain geometry, viewpoint, texture
, lighting
, and shading
information. The image is a digital image
or raster graphics
image
. The term may be by analogy with an "artist's rendering" of a scene. 'Rendering' is also used to describe the process of calculating effects in a video editing file to produce final video output. Important rendering techniques are:
Scanline rendering
and rasterisation
Ray casting
Radiosity
Ray tracing
is a technique used to display a 2D projection of a 3D discretely sampled
data set
. A typical 3D data set is a group of 2D slice images acquired by a CT or MRI
scanner. Usually these are acquired in a regular pattern (e.g., one slice every millimeter) and usually have a regular number of image pixel
s in a regular pattern. This is an example of a regular volumetric grid, with each volume element, or voxel
represented by a single value that is obtained by sampling the immediate area surrounding the voxel.
(1994) "volume visualization examines a set of techniques that allows viewing an object without mathematical representing the other surface. Initially used in medical imaging
, volume visualization has become an essential technique for many sciences, portraying phenomena become an essential technique such as clouds, water flows, and molecular and biological structure. Many volume visualization algorithms are computationally expensive and demand large data storage. Advances in hardware and software are generalizing volume visualization as well as real time performances".
Gravity waves: Researchers used the Globus Toolkit to harness the power of multiple supercomputers to simulate the gravitational effects of black-hole collisions.
Massive Star Supernovae Explosions: In the image, three-Dimensional Radiation Hydrodynamics Calculations of Massive Star Supernovae Explosions The DJEHUTY stellar evolution code was used to calculate the explosion of SN 1987A model in three dimensions.
Molecular rendering: VisIt
's general plotting capabilities were used to create the molecular rendering shown in the featured visualization. The original data was taken from the Protein Data Bank and turned into a VTK file before rendering.
can read several file formats common in the field of Geographic Information Systems (GIS), allowing one to plot raster data such as terrain data in visualizations. The featured image shows a plot of a DEM dataset containing mountainous areas near Dunsmuir, CA. Elevation lines are added to the plot to help delineate changes in elevation.
Tornado Simulation: This image was created from data generated by a tornado simulation calculated on NCSA's IBM p690 computing cluster. High-definition television animations of the storm produced at NCSA were included in an episode of the PBS television series NOVA called "Hunt for the Supertwister." The tornado is shown by spheres that are colored according to pressure; orange and blue tubes represent the rising and falling airflow around the tornado.
Climate visualization: This visualization depicts the carbon dioxide from various sources that are advected individually as tracers in the atmosphere model. Carbon dioxide from the ocean is shown as plumes during February 1900.
Atmospheric Anomaly in Times Square In the image the results from the SAMRAI simulation framework of an atmospheric anomaly in and around Times Square are visualized.
Curve plots: VisIt can plot curves from data read from files and it can be used to extract and plot curve data from higher-dimensional datasets using lineout operators or queries. The curves in the featured image correspond to elevation data along lines drawn on DEM data and were created with the feature lineout capability. Lineout allows you to interactively draw a line, which specifies a path for data extraction. The resulting data was then plotted as curves.
Image annotations: The featured plot shows Leaf Area Index (LAI), a measure of global vegetative matter, from a NetCDF dataset. The primary plot is the large plot at the bottom, which shows the LAI for the whole world. The plots on top are actually annotations that contain images generated earlier. Image annotations can be used to include material that enhances a visualization such as auxiliary plots, images of experimental data, project logos, etc.
Scatter plot: VisIt's Scatter plot allows to visualize multivariate data of up to four dimensions. The Scatter plot takes multiple scalar variables and uses them for different axes in phase space. The different variables are combined to form coordinates in the phase space and they are displayed using glyphs and colored using another scalar variable.
YF-17 aircraft Plot: The featured image displays plots of a CGNS dataset representing a YF-17 jet aircraft. The dataset consists of an unstructured grid with solution. The image was created by using a pseudocolor plot of the dataset's Mach variable, a Mesh plot of the grid, and Vector plot of a slice through the Velocity field.
City rendering: An ESRI shapefile containing a polygonal description of the building footprints was read in and then the polygons were resampled onto a rectilinear grid, which was extruded into the featured cityscape.
Inbound traffic measured: This image is a visualization study of inbound traffic measured in billions of bytes on the NSFNET T1 backbone for the month of September 1991. The traffic volume range is depicted from purple (zero bytes) to white (100 billion bytes). It represents data collected by Merit Network, Inc.
Thomas A. DeFanti
Maxine D. Brown
Clifford A. Pickover
Lawrence Jay Rosenblum:Lawrence J. Rosenblum
(born 1949) is an American mathematician
, and Program Director for Graphics and Visualization at the National Science Foundation
. Rosenblum's research interests include mobile augmented reality (AR), scientific and uncertainty visualization, VR displays, and applications of VR/AR systems. His research group has produced advances in mobile augmented reality (AR), scientific and uncertainty visualization, VR displays, applications of VR/AR systems, and understanding human performance in graphics systems.
Other visualisation experts in this field:
See further: :Category:Computer graphics researchers
Conferences in this field, ranked by significance in scientific visualization research, are:
See further: :Category:Computer graphics organizations
People
Software
:Category:Free data visualization software
Three-dimensional space
Three-dimensional space is a geometric 3-parameters model of the physical universe in which we live. These three dimensions are commonly called length, width, and depth , although any three directions can be chosen, provided that they do not lie in the same plane.In physics and mathematics, a...
phenomena (architectural, meteorological, medical, biological
Biological data visualization
Biology Data Visualization is a branch of bioinformatics concerned with the application of computer graphics, scientific visualization, and information visualization to different areas of the life sciences. This includes visualization of sequences, genomes, alignments, phylogenies, macromolecular...
, etc.), where the emphasis is on realistic renderings of volumes, surfaces, illumination sources, and so forth, perhaps with a dynamic (time) component".
History
Maxwell's thermodynamic surface
Maxwell’s thermodynamic surface is an 1874 sculpture made by Scottish physicist James Clerk Maxwell . This model provides a three-dimensional plot of the various states of a fictitious substance with water-like properties. This plot has coordinates volume , entropy , and energy...
, sculpted in clay in 1874 by James Clerk Maxwell
James Clerk Maxwell
James Clerk Maxwell of Glenlair was a Scottish physicist and mathematician. His most prominent achievement was formulating classical electromagnetic theory. This united all previously unrelated observations, experiments and equations of electricity, magnetism and optics into a consistent theory...
. This prefigured modern scientific visualization techniques that use computer graphics
Computer graphics
Computer graphics are graphics created using computers and, more generally, the representation and manipulation of image data by a computer with help from specialized software and hardware....
.
Notable early two-dimensional examples include the flow map
Flow map
Flow maps in cartography are by definition of Phan "a mix of maps and flow charts, that show the movement of objects from one location to another, such as the number of people in a migration, the amount of goods being traded, or the number of packets in a network".- Overview :Flow maps according...
of Napoleon’s March on Moscow
French invasion of Russia
The French invasion of Russia of 1812 was a turning point in the Napoleonic Wars. It reduced the French and allied invasion forces to a tiny fraction of their initial strength and triggered a major shift in European politics as it dramatically weakened French hegemony in Europe...
produced by Charles Joseph Minard
Charles Joseph Minard
Charles Joseph Minard was a French civil engineer noted for his inventions in the field of information graphics.- Biography :...
in 1869; the “coxcombs” used by Florence Nightingale
Florence Nightingale
Florence Nightingale OM, RRC was a celebrated English nurse, writer and statistician. She came to prominence for her pioneering work in nursing during the Crimean War, where she tended to wounded soldiers. She was dubbed "The Lady with the Lamp" after her habit of making rounds at night...
in 1857 as part of a campaign to improve sanitary conditions in the British army; and the dot map
Dot Distribution Maps
A dot density map is as a map type that uses a dot symbol to show the presence of a feature or phenomenon. Dot maps rely on a visual scatter to show spatial pattern.-One-to-One:In a one-to-one dot map, each dot represents one single recording of a phenomenon...
used by John Snow
John Snow (physician)
John Snow was an English physician and a leader in the adoption of anaesthesia and medical hygiene. He is considered to be one of the fathers of epidemiology, because of his work in tracing the source of a cholera outbreak in Soho, England, in 1854.-Early life and education:Snow was born 15 March...
in 1855 to visualise the Broad Street cholera outbreak
1854 Broad Street cholera outbreak
The Broad Street cholera outbreak was a severe outbreak of cholera that occurred near Broad Street in Soho district of London, England in 1854...
.
Scientific visualization topics
Computer animation
Computer animationComputer animation
Computer animation is the process used for generating animated images by using computer graphics. The more general term computer generated imagery encompasses both static scenes and dynamic images, while computer animation only refers to moving images....
is the art, technique, and science of creating moving images via the use of computer
Computer
A computer is a programmable machine designed to sequentially and automatically carry out a sequence of arithmetic or logical operations. The particular sequence of operations can be changed readily, allowing the computer to solve more than one kind of problem...
s. It is becoming more common to be created by means of 3D computer graphics
3D computer graphics
3D computer graphics are graphics that use a three-dimensional representation of geometric data that is stored in the computer for the purposes of performing calculations and rendering 2D images...
, though 2D computer graphics
2D computer graphics
2D computer graphics is the computer-based generation of digital images—mostly from two-dimensional models and by techniques specific to them...
are still widely used for stylistic, low bandwidth, and faster real-time rendering needs. Sometimes the target of the animation is the computer itself, but sometimes the target is another medium, such as film
Film
A film, also called a movie or motion picture, is a series of still or moving images. It is produced by recording photographic images with cameras, or by creating images using animation techniques or visual effects...
. It is also referred to as CGI (Computer-generated imagery
Computer-generated imagery
Computer-generated imagery is the application of the field of computer graphics or, more specifically, 3D computer graphics to special effects in art, video games, films, television programs, commercials, simulators and simulation generally, and printed media...
or computer-generated imaging), especially when used in films.
Computer simulation
Computer simulationComputer simulation
A computer simulation, a computer model, or a computational model is a computer program, or network of computers, that attempts to simulate an abstract model of a particular system...
is a computer program, or network of computers, that attempts to simulate
Simulation
Simulation is the imitation of some real thing available, state of affairs, or process. The act of simulating something generally entails representing certain key characteristics or behaviours of a selected physical or abstract system....
an abstract model of a particular system. Computer simulations have become a useful part of mathematical model
Mathematical model
A mathematical model is a description of a system using mathematical concepts and language. The process of developing a mathematical model is termed mathematical modeling. Mathematical models are used not only in the natural sciences and engineering disciplines A mathematical model is a...
ling of many natural systems in physics, and computational physics, chemistry and biology; human systems in economics, psychology, and social science; and in the process of engineering and new technology, to gain insight into the operation of those systems, or to observe their behavior. The simultaneous visualization and simulation of a system is called visulation
Visulation
Visulation is a portmanteau describing a coupled system where graphic visualization and computer simulation occur simultaneously. Visulation is conducted in many GPGPU applications and commonly employs interactive visualization techniques....
.
Computer simulations vary from computer programs that run a few minutes, to network-based groups of computers running for hours, to ongoing simulations that run for months. The scale of events being simulated by computer simulations has far exceeded anything possible (or perhaps even imaginable) using the traditional paper-and-pencil mathematical modeling: over 10 years ago, a desert-battle simulation, of one force invading another, involved the modeling of 66,239 tanks, trucks and other vehicles on simulated terrain around Kuwait
Kuwait
The State of Kuwait is a sovereign Arab state situated in the north-east of the Arabian Peninsula in Western Asia. It is bordered by Saudi Arabia to the south at Khafji, and Iraq to the north at Basra. It lies on the north-western shore of the Persian Gulf. The name Kuwait is derived from the...
, using multiple supercomputers in the DoD
United States Department of Defense
The United States Department of Defense is the U.S...
High Performance Computer Modernization Program.
Information visualization
Information visualizationInformation visualization
Information visualization is the interdisciplinary study of "the visual representation of large-scale collections of non-numerical information, such as files and lines of code in software systems, library and bibliographic databases, networks of relations on the internet, and so forth".- Overview...
is the study of "the visual
Visual system
The visual system is the part of the central nervous system which enables organisms to process visual detail, as well as enabling several non-image forming photoresponse functions. It interprets information from visible light to build a representation of the surrounding world...
representation
Representation (arts)
Representation is the use of signs that stand in for and take the place of something else. It is through representation that people organize the world and reality through the act of naming its elements...
of large-scale collections of non-numerical information, such as files and lines of code in software system
Software system
A software system is a system based on software forming part of a computer system . The term "software system" is often used as a synonym of computer program or software; is related to the application of systems theory approaches in software engineering context and are used to study large and...
s, library
Library
In a traditional sense, a library is a large collection of books, and can refer to the place in which the collection is housed. Today, the term can refer to any collection, including digital sources, resources, and services...
and bibliographic database
Database
A database is an organized collection of data for one or more purposes, usually in digital form. The data are typically organized to model relevant aspects of reality , in a way that supports processes requiring this information...
s, networks of relations on the internet
Internet
The Internet is a global system of interconnected computer networks that use the standard Internet protocol suite to serve billions of users worldwide...
, and so forth".
Information visualization focused on the creation of approaches for conveying abstract information in intuitive ways. Visual representations and interaction techniques take advantage of the human eye’s broad bandwidth pathway into the mind to allow users to see, explore, and understand large amounts of information at once.
Interface technology and perception
Interface technology and perceptionPerception
Perception is the process of attaining awareness or understanding of the environment by organizing and interpreting sensory information. All perception involves signals in the nervous system, which in turn result from physical stimulation of the sense organs...
shows how new interfaces and a better understanding of underlying perceptual issues create new opportunities for the scientific visualization community.
Surface rendering
RenderingRendering (computer graphics)
Rendering is the process of generating an image from a model , by means of computer programs. A scene file contains objects in a strictly defined language or data structure; it would contain geometry, viewpoint, texture, lighting, and shading information as a description of the virtual scene...
is the process of generating an image from a model, by means of computer programs. The model is a description of three dimensional objects in a strictly defined language or data structure. It would contain geometry, viewpoint, texture
Texture mapping
Texture mapping is a method for adding detail, surface texture , or color to a computer-generated graphic or 3D model. Its application to 3D graphics was pioneered by Dr Edwin Catmull in his Ph.D. thesis of 1974.-Texture mapping:...
, lighting
Lighting
Lighting or illumination is the deliberate application of light to achieve some practical or aesthetic effect. Lighting includes the use of both artificial light sources such as lamps and light fixtures, as well as natural illumination by capturing daylight...
, and shading
Shading
Shading refers to depicting depth perception in 3D models or illustrations by varying levels of darkness.-Drawing:Shading is a process used in drawing for depicting levels of darkness on paper by applying media more densely or with a darker shade for darker areas, and less densely or with a lighter...
information. The image is a digital image
Digital image
A digital image is a numeric representation of a two-dimensional image. Depending on whether or not the image resolution is fixed, it may be of vector or raster type...
or raster graphics
Raster graphics
In computer graphics, a raster graphics image, or bitmap, is a data structure representing a generally rectangular grid of pixels, or points of color, viewable via a monitor, paper, or other display medium...
image
Image
An image is an artifact, for example a two-dimensional picture, that has a similar appearance to some subject—usually a physical object or a person.-Characteristics:...
. The term may be by analogy with an "artist's rendering" of a scene. 'Rendering' is also used to describe the process of calculating effects in a video editing file to produce final video output. Important rendering techniques are:
Scanline rendering
Scanline rendering
Scanline rendering is an algorithm for visible surface determination, in 3D computer graphics,that works on a row-by-row basis rather than a polygon-by-polygon or pixel-by-pixel basis...
and rasterisation
- A high-level representation of an image necessarily contains elements in a different domain from pixels. These elements are referred to as primitives. In a schematic drawing, for instance, line segments and curves might be primitives. In a graphical user interface, windows and buttons might be the primitives. In 3D rendering, triangles and polygons in space might be primitives.
Ray casting
- Ray castingRay castingRay casting is the use of ray-surface intersection tests to solve a variety of problems in computer graphics. It enables spatial selections of objects in ascene by providing users a virtual beam as a visual cue extending...
is primarily used for realtime simulations, such as those used in 3D computer games and cartoon animations, where detail is not important, or where it is more efficient to manually fake the details in order to obtain better performance in the computational stage. This is usually the case when a large number of frames need to be animated. The resulting surfaces have a characteristic 'flat' appearance when no additional tricks are used, as if objects in the scene were all painted with matte finish.
Radiosity
- RadiosityRadiosityRadiosity is a global illumination algorithm used in 3D computer graphics rendering. Radiosity is an application of the finite element method to solving the rendering equation for scenes with purely diffuse surfaces...
, also known as Global Illumination, is a method that attempts to simulate the way in which directly illuminated surfaces act as indirect light sources that illuminate other surfaces. This produces more realistic shading and seems to better capture the 'ambience' of an indoor scene. A classic example is the way that shadows 'hug' the corners of rooms.
Ray tracing
- Ray tracing is an extension of the same technique developed in scanline rendering and ray casting. Like those, it handles complicated objects well, and the objects may be described mathematically. Unlike scanline and casting, ray tracing is almost always a Monte Carlo technique, that is one based on averaging a number of randomly generated samples from a model.
Volume rendering
Volume renderingVolume rendering
In scientific visualization and computer graphics, volume rendering is a set of techniques used to display a 2D projection of a 3D discretely sampled data set.A typical 3D data set is a group of 2D slice images acquired by aCT, MRI, or MicroCT scanner....
is a technique used to display a 2D projection of a 3D discretely sampled
Sampling (signal processing)
In signal processing, sampling is the reduction of a continuous signal to a discrete signal. A common example is the conversion of a sound wave to a sequence of samples ....
data set
Data set
A data set is a collection of data, usually presented in tabular form. Each column represents a particular variable. Each row corresponds to a given member of the data set in question. Its values for each of the variables, such as height and weight of an object or values of random numbers. Each...
. A typical 3D data set is a group of 2D slice images acquired by a CT or MRI
Magnetic resonance imaging
Magnetic resonance imaging , nuclear magnetic resonance imaging , or magnetic resonance tomography is a medical imaging technique used in radiology to visualize detailed internal structures...
scanner. Usually these are acquired in a regular pattern (e.g., one slice every millimeter) and usually have a regular number of image pixel
Pixel
In digital imaging, a pixel, or pel, is a single point in a raster image, or the smallest addressable screen element in a display device; it is the smallest unit of picture that can be represented or controlled....
s in a regular pattern. This is an example of a regular volumetric grid, with each volume element, or voxel
Voxel
A voxel is a volume element, representing a value on a regular grid in three dimensional space. This is analogous to a pixel, which represents 2D image data in a bitmap...
represented by a single value that is obtained by sampling the immediate area surrounding the voxel.
Volume visualization
According to RosenblumLawrence J. Rosenblum
Lawrence Jay Rosenblum is an American mathematician, and Program Director for Graphics and Visualization at the National Science Foundation.- Work :...
(1994) "volume visualization examines a set of techniques that allows viewing an object without mathematical representing the other surface. Initially used in medical imaging
Medical imaging
Medical imaging is the technique and process used to create images of the human body for clinical purposes or medical science...
, volume visualization has become an essential technique for many sciences, portraying phenomena become an essential technique such as clouds, water flows, and molecular and biological structure. Many volume visualization algorithms are computationally expensive and demand large data storage. Advances in hardware and software are generalizing volume visualization as well as real time performances".
Scientific visualization applications
This section will give a series of examples how scientific visualization can be applied today.In the natural sciences
Star formation: The featured plot is a Volume plot of the logarithm of gas/dust density in an Enzo star and galaxy simulation. Regions of high density are white while less dense regions are more blue and also more transparent.Gravity waves: Researchers used the Globus Toolkit to harness the power of multiple supercomputers to simulate the gravitational effects of black-hole collisions.
Massive Star Supernovae Explosions: In the image, three-Dimensional Radiation Hydrodynamics Calculations of Massive Star Supernovae Explosions The DJEHUTY stellar evolution code was used to calculate the explosion of SN 1987A model in three dimensions.
Molecular rendering: VisIt
VisIt
VisIt is an open source interactive parallel visualization and graphical analysis tool for viewing scientific data. It can be used to visualize scalar and vector fields defined on 2D and 3D structured and unstructured meshes...
's general plotting capabilities were used to create the molecular rendering shown in the featured visualization. The original data was taken from the Protein Data Bank and turned into a VTK file before rendering.
In geography and ecology
Terrain rendering: VisItVisIt
VisIt is an open source interactive parallel visualization and graphical analysis tool for viewing scientific data. It can be used to visualize scalar and vector fields defined on 2D and 3D structured and unstructured meshes...
can read several file formats common in the field of Geographic Information Systems (GIS), allowing one to plot raster data such as terrain data in visualizations. The featured image shows a plot of a DEM dataset containing mountainous areas near Dunsmuir, CA. Elevation lines are added to the plot to help delineate changes in elevation.
Tornado Simulation: This image was created from data generated by a tornado simulation calculated on NCSA's IBM p690 computing cluster. High-definition television animations of the storm produced at NCSA were included in an episode of the PBS television series NOVA called "Hunt for the Supertwister." The tornado is shown by spheres that are colored according to pressure; orange and blue tubes represent the rising and falling airflow around the tornado.
Climate visualization: This visualization depicts the carbon dioxide from various sources that are advected individually as tracers in the atmosphere model. Carbon dioxide from the ocean is shown as plumes during February 1900.
Atmospheric Anomaly in Times Square In the image the results from the SAMRAI simulation framework of an atmospheric anomaly in and around Times Square are visualized.
In the formal sciences
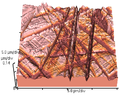
Computer mapping of topographical surfaces: Through computer mapping of topographical surfaces, mathematicians can test theories of how materials will change when stressed. The imaging is part of the work on the NSF-funded Electronic Visualization Laboratory at the University of Illinois at Chicago.Curve plots: VisIt can plot curves from data read from files and it can be used to extract and plot curve data from higher-dimensional datasets using lineout operators or queries. The curves in the featured image correspond to elevation data along lines drawn on DEM data and were created with the feature lineout capability. Lineout allows you to interactively draw a line, which specifies a path for data extraction. The resulting data was then plotted as curves.
Image annotations: The featured plot shows Leaf Area Index (LAI), a measure of global vegetative matter, from a NetCDF dataset. The primary plot is the large plot at the bottom, which shows the LAI for the whole world. The plots on top are actually annotations that contain images generated earlier. Image annotations can be used to include material that enhances a visualization such as auxiliary plots, images of experimental data, project logos, etc.
Scatter plot: VisIt's Scatter plot allows to visualize multivariate data of up to four dimensions. The Scatter plot takes multiple scalar variables and uses them for different axes in phase space. The different variables are combined to form coordinates in the phase space and they are displayed using glyphs and colored using another scalar variable.
In the applied sciences
Porsche 911 model (NASTRAN model): The featured plot contains a Mesh plot of a Porsche 911 model imported from a NASTRAN bulk data file. VisIt can read a limited subset of NASTRAN bulk data files, in general enough to import model geometry for visualization.YF-17 aircraft Plot: The featured image displays plots of a CGNS dataset representing a YF-17 jet aircraft. The dataset consists of an unstructured grid with solution. The image was created by using a pseudocolor plot of the dataset's Mach variable, a Mesh plot of the grid, and Vector plot of a slice through the Velocity field.
City rendering: An ESRI shapefile containing a polygonal description of the building footprints was read in and then the polygons were resampled onto a rectilinear grid, which was extruded into the featured cityscape.
Inbound traffic measured: This image is a visualization study of inbound traffic measured in billions of bytes on the NSFNET T1 backbone for the month of September 1991. The traffic volume range is depicted from purple (zero bytes) to white (100 billion bytes). It represents data collected by Merit Network, Inc.
Scientific visualization experts
Bruce H. McCormick- Bruce H. McCormickBruce H. McCormickBruce Howard McCormick was an American computer scientist, Emeritus Professor at the Department of Computer Science, and founding director of the Brain Networks Lab at Texas A&M University.- Biography :...
(1930 - 2007) was an American computer scientistComputer scientistA computer scientist is a scientist who has acquired knowledge of computer science, the study of the theoretical foundations of information and computation and their application in computer systems....
, who studied Physics from MIT, Cambridge University and Harvard University in the 1950s. In the 1960s, he initiated and directed the ILLIAC IIIILLIAC IIIThe ILLIAC III was a fine-grained SIMD pattern recognition computer built by the University of Illinois in 1966.This ILLIAC's initial task was image processing of bubble chamber experiments used to detect nuclear particles. Later it was used on biological images.The machine was destroyed in a fire,...
Image Processing Computer project and developed the first imaging of blood flow and macular degeneracy in the human retina. In the 1980s, he organized and chaired the first Brain Mapping Machine Design Workshop in 1985. Two years later in 1987, he developed and promoted the concept of "scientific visualization" at the National Science FoundationNational Science FoundationThe National Science Foundation is a United States government agency that supports fundamental research and education in all the non-medical fields of science and engineering. Its medical counterpart is the National Institutes of Health...
Advisory Panel on Graphics, Image Processing, and Workstations.
Thomas A. DeFanti
- Thomas A. DeFantiThomas A. DeFantiTom DeFanti is a computer graphics researcher and pioneer. His work has ranged from early computer animation, to scientific visualization, virtual reality, and grid computing...
(born 1948) is an American computer graphics researcher and Director of the Electronic Visualization LaboratoryElectronic Visualization LaboratoryThe Electronic Visualization Laboratory is a cross-disciplinary research lab at the University of Illinois at Chicago. It brings together faculty and students from the Art and Computer Science departments of UIC...
(EVL), who studied mathematics and computer information science, with a PhD in Computer Graphics Research received in 1973. He joined the faculty of the University of Illinois at Chicago, and next he amassed a number of credits. He cofounded the Electronic Visualization Laboratory (EVL), used the EVL hardware and software for the computer animation produced for the Star WarsStar WarsStar Wars is an American epic space opera film series created by George Lucas. The first film in the series was originally released on May 25, 1977, under the title Star Wars, by 20th Century Fox, and became a worldwide pop culture phenomenon, followed by two sequels, released at three-year...
movie. DeFanti contributed greatly to the growth of the SIGGRAPHSIGGRAPHSIGGRAPH is the name of the annual conference on computer graphics convened by the ACM SIGGRAPH organization. The first SIGGRAPH conference was in 1974. The conference is attended by tens of thousands of computer professionals...
organization and conference.
Maxine D. Brown
- Maxine D. BrownMaxine D. BrownMaxine D. Brown is an American computer scientist and associate director of the Electronic Visualization Laboratory at the University of Illinois at Chicago . Along with Tom DeFanti and Bruce McCormick, she co-edited the 1987 NSF report, Visualization in Scientific Computing, which defined the...
is an American computer scientistComputer scientistA computer scientist is a scientist who has acquired knowledge of computer science, the study of the theoretical foundations of information and computation and their application in computer systems....
, and associate director of the Electronic Visualization LaboratoryElectronic Visualization LaboratoryThe Electronic Visualization Laboratory is a cross-disciplinary research lab at the University of Illinois at Chicago. It brings together faculty and students from the Art and Computer Science departments of UIC...
(EVL). She also studied mathematicsMathematicsMathematics is the study of quantity, space, structure, and change. Mathematicians seek out patterns and formulate new conjectures. Mathematicians resolve the truth or falsity of conjectures by mathematical proofs, which are arguments sufficient to convince other mathematicians of their validity...
and later computer scienceComputer scienceComputer science or computing science is the study of the theoretical foundations of information and computation and of practical techniques for their implementation and application in computer systems...
in the 1970s. She has a long history of service to the computer graphicsComputer graphicsComputer graphics are graphics created using computers and, more generally, the representation and manipulation of image data by a computer with help from specialized software and hardware....
and supercomputing communities, and has contributed to many facets of SIGGRAPH.
Clifford A. Pickover
- Clifford A. PickoverClifford A. PickoverClifford A. Pickover is an American author, editor, and columnist in the fields of science, mathematics, and science fiction, and is employed at the IBM Thomas J. Watson Research Center in Yorktown, New York.- Biography :He received his Ph.D...
is an American author, editor, and columnist in the fields of science, mathematics, and science fiction, primary interested in finding new ways to expand creativity by melding art, science, mathematics, and other seemingly disparate areas of human endeavor. In the 1990s he has edited several books, like "Frontiers of Scientific Visualization" (1994) and "Visualizing Biological Information" (1995).
Lawrence Jay Rosenblum:Lawrence J. Rosenblum
Lawrence J. Rosenblum
Lawrence Jay Rosenblum is an American mathematician, and Program Director for Graphics and Visualization at the National Science Foundation.- Work :...
(born 1949) is an American mathematician
Mathematician
A mathematician is a person whose primary area of study is the field of mathematics. Mathematicians are concerned with quantity, structure, space, and change....
, and Program Director for Graphics and Visualization at the National Science Foundation
National Science Foundation
The National Science Foundation is a United States government agency that supports fundamental research and education in all the non-medical fields of science and engineering. Its medical counterpart is the National Institutes of Health...
. Rosenblum's research interests include mobile augmented reality (AR), scientific and uncertainty visualization, VR displays, and applications of VR/AR systems. His research group has produced advances in mobile augmented reality (AR), scientific and uncertainty visualization, VR displays, applications of VR/AR systems, and understanding human performance in graphics systems.
Other visualisation experts in this field:
- Donna CoxDonna CoxDonna J. Cox is an American artist and scientist, Professor of Art + Design; Director, Advanced Scientific Visualization Laboratory at the University of Illinois at Urbana-Champaign ; Director, Visualization and Experimental Technologies at National Center for Supercomputing Applications ; and...
- Pat HanrahanPat HanrahanPat Hanrahan is a computer graphics researcher, the Canon USA Professor of Computer Science and Electrical Engineering in the Computer Graphics Laboratory at Stanford University....
- Bill HibbardBill HibbardBill Hibbard is a scientist at the University of Wisconsin–Madison Space Science and Engineering Center working on visualization and machine intelligence. He is principal author of the Vis5D, Cave5D and VisAD open source visualization systems. Vis5D was the first open source 3-D visualization...
- Jim HoffmanJim HoffmanJim Hoffman is a website engineer in Oakland, California, who created several web sites about the September 11, 2001 attacks that analyze and suggest alternative accounts for the events of that day, often described as 9/11 conspiracy theories. His primary website, , serves as an archive of...
- Chris Lilley (W3C)Chris Lilley (W3C)Chris Lilley was educated at Broxburn Academy in West Lothian, Scotland. He obtained a Bachelors degree in Biochemistry at the University of Stirling, Scotland and then worked in Haematology and Blood transfusion at the hospital laboratories of Stirling and Falkirk.He obtained a Masters degree in...
- Julian LombardiJulian LombardiJulian Lombardi is an American inventor, author, educator, and computer scientist known for his work with socio-computational systems, scalable virtual world technologies, and in the design and deployment of deeply collaborative virtual learning environments.- Biography :Lombardi was born to a...
- Dietmar SaupeDietmar SaupeDietmar Saupe is a fractal researcher and professor of computer science, Department of Computer and Information Science, University of Konstanz, Germany....
See further: :Category:Computer graphics researchers
Scientific visualization organizations
Important laboratory in the field are:- Electronic Visualization LaboratoryElectronic Visualization LaboratoryThe Electronic Visualization Laboratory is a cross-disciplinary research lab at the University of Illinois at Chicago. It brings together faculty and students from the Art and Computer Science departments of UIC...
- NASA Goddard Scientific Visualization Studio.
Conferences in this field, ranked by significance in scientific visualization research, are:
- IEEE Visualization
- EuroVis
- SIGGRAPHSIGGRAPHSIGGRAPH is the name of the annual conference on computer graphics convened by the ACM SIGGRAPH organization. The first SIGGRAPH conference was in 1974. The conference is attended by tens of thousands of computer professionals...
- EurographicsEurographicsEurographics is a Europe-wide professional Computer Graphics association. The association supports its members in advancing the state of the art in Computer Graphics and related fields such as Multimedia, Scientific Visualization and Human-Computer Interaction....
- GraphiconGraphiConGraphiCon is the largest International conference on computer graphics and computer vision in the countries of the former Soviet Union.The conference is hosted by Moscow State University in association with Keldysh Institute of Applied Mathematics, Russian Center of Computing for Physics and...
See further: :Category:Computer graphics organizations
See also
General- ACM Transactions on GraphicsACM Transactions on GraphicsACM Transactions on Graphics is a peer-reviewed scientific journal that aims to disseminate the latest findings of note in the field of computer graphics. It has been published since 1982 by the Association for Computing Machinery...
- Data Presentation ArchitectureData Presentation ArchitectureData presentation architecture is a skill-set that seeks to identify, locate, manipulate, format and present data in such a way as to optimally communicate meaning and proffer knowledge.-Origin and context:...
- Data visualizationData visualizationData visualization is the study of the visual representation of data, meaning "information that has been abstracted in some schematic form, including attributes or variables for the units of information"....
- Mathematical visualizationMathematical visualizationMathematical visualization is an aspect of geometry which allows one to understand and explore mathematical phenomena via visualization. Classically this consisted of two-dimensional drawings or building three-dimensional models , while today it most frequently consists of using computers to make...
- Molecular graphicsMolecular graphicsMolecular graphics is the discipline and philosophy of studying molecules and their properties through graphical representation. IUPAC limits the definition to representations on a "graphical display device"...
- VisulationVisulationVisulation is a portmanteau describing a coupled system where graphic visualization and computer simulation occur simultaneously. Visulation is conducted in many GPGPU applications and commonly employs interactive visualization techniques....
- Visual analyticsVisual analyticsVisual analytics is an outgrowth of the fields information visualization and scientific visualization, that focuses on analytical reasoning facilitated by interactive visual interfaces...
People
- Tristan NeedhamTristan NeedhamTristan Needham is a mathematician and author of thebook Visual Complex Analysis in which he uses a geometric approach to develop complex analysis ....
Software
- BaudlineBaudlineThe baudline time-frequency browser is a signal analysis tool designed for scientific visualization. It runs on several Unix operating systems under the X Window System...
- NCAR Command LanguageNCAR Command LanguageThe NCAR Command Language is a free interpreted language designed by the National Center for Atmospheric Research for scientific visualization and data processing. NCL has robust file input and output...
- Sirius visualization softwareSirius visualization softwareSirius is a molecular modeling and analysis system developed at San Diego Supercomputer Center. Sirius is designed to support advanced user requirements that go beyond simple display of small molecules and proteins...
- DataplotDataplotDataplot is a public-domain software system for scientific visualization and statistical analysis. It was developed at the National Institute of Standards and Technology.-External links:*...
- ParaViewParaViewParaView is an open source, freely available program for parallel, interactive, scientific visualization. It has a client–server architecture to facilitate remote visualization of datasets, and generates level of detail models to maintain interactive framerates for large datasets. It is an...
- VisItVisItVisIt is an open source interactive parallel visualization and graphical analysis tool for viewing scientific data. It can be used to visualize scalar and vector fields defined on 2D and 3D structured and unstructured meshes...
- AvizoAvizo (software)Avizo is a general-purpose commercial software application for scientific and industrial data visualization and analysis....
- MeVisLabMeVisLabMeVisLab is a cross-platform application framework for medical image processing and scientific visualization. It includes advanced algorithms for image registration, segmentation, and quantitative morphological and functional image analysis...
:Category:Free data visualization software
- VTKVTKThe Visualization Toolkit is an open-source, freely available software system for 3D computer graphics, image processing and visualization. VTK consists of a C++ class library and several interpreted interface layers including Tcl/Tk, Java, and Python. Kitware, whose team created and continues to...
- BitplaneBitplaneBitplane is a provider of software for 3D and 4D image analysis for the life sciences. Founded in December 1992, Bitplane operates out of two offices in Zürich, Switzerland and one in South Windor, CT, USA.- Company history :...
- Mapjects
- JHepWorkJHepWorkjHepWork is an interactive framework for scientific computation, data analysis and data visualization designed for scientists, engineers and students...
Further reading
- Bruce H. McCormickBruce H. McCormickBruce Howard McCormick was an American computer scientist, Emeritus Professor at the Department of Computer Science, and founding director of the Brain Networks Lab at Texas A&M University.- Biography :...
, Thomas A. DeFantiThomas A. DeFantiTom DeFanti is a computer graphics researcher and pioneer. His work has ranged from early computer animation, to scientific visualization, virtual reality, and grid computing...
and Maxine D. BrownMaxine D. BrownMaxine D. Brown is an American computer scientist and associate director of the Electronic Visualization Laboratory at the University of Illinois at Chicago . Along with Tom DeFanti and Bruce McCormick, she co-edited the 1987 NSF report, Visualization in Scientific Computing, which defined the...
(eds.) (1987). Visualization in Scientific Computing. ACM Press. - Gregory M. Nielson, Hans Hagen and Heinrich Müller (1997). Scientific Visualization: Overviews, Methodologies, and Techniques. IEEE Computer Society.
- Clifford A. PickoverClifford A. PickoverClifford A. Pickover is an American author, editor, and columnist in the fields of science, mathematics, and science fiction, and is employed at the IBM Thomas J. Watson Research Center in Yorktown, New York.- Biography :He received his Ph.D...
(ed.) (1994). Frontiers of Scientific Visualization. New York: John Willey Inc. - Lawrence J. RosenblumLawrence J. RosenblumLawrence Jay Rosenblum is an American mathematician, and Program Director for Graphics and Visualization at the National Science Foundation.- Work :...
(ed.) (1994). Scientific Visualization: Advances and challenges. Academic Press. - Will Schroeder, Ken Martin, Bill Lorensen (2003). The Visualization Toolkit. Kitware, Inc.
- Leland Wilkinson (2005). The Grammar of Graphics, Springer.
External links
- National Institute of Standards and Technology Scientific Visualizations, with an overview of applications.
- Scientific Visualization Tutorials, Georgia Tech
- NASA Scientific Visualization Studio. They facilitate scientific inquiry and outreach within NASA programs through visualization.
- NovoSpark Visualizer - an advanced visualization tool that enables qualitative analysis of multidimensional data through the exploration of a graphical image.
- Project Cosmology - a "genome project" for scientific visualization.
- Visualization Toolkit
- nicefigure.org A roundup of the nicest figures recently published in scientific journals