
Molecular graphics
Encyclopedia
Molecular graphics is the discipline and philosophy of studying molecule
s and their properties through graphical representation. IUPAC limits the definition to representations on a "graphical display device". Ever since Dalton
's atoms and Kekulé's benzene
, there has been a rich history of hand-drawn atoms and molecules, and these representations have had an important influence on modern molecular graphics. This article concentrates on the use of computers to create molecular graphics. Note, however, that many molecular graphics programs and systems have close coupling between the graphics and editing commands or calculations such as in molecular modelling
.
 There has been a long tradition of creating molecular model
s from physical materials. Perhaps the best known is Crick
and Watson's
model of DNA built from rods and planar sheets, but the most widely used approach is to represent all atoms and bonds explicitly using the "ball and stick
" approach. This can demonstrate a wide range of properties, such as shape, relative size, and flexibility. Many chemistry courses expect that students will have access to ball and stick models. One goal of mainstream molecular graphics has been to represent the "ball and stick" model as realistically as possible and to couple this with calculations of molecular properties.
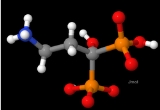
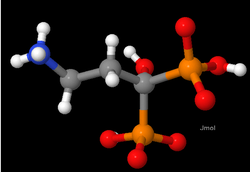
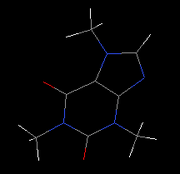
Figure 1 shows a small molecule (NH3CH2CH2C(OH)(PO3H)(PO3H)-), as drawn by the Jmol
program. It is important to realize that the colors and shapes are purely a convention, as individual atoms are not colored, nor do they have hard surfaces. Bond
s between atoms are also not rod-shaped.
of cyclohexane
is a good example of the value of mechanical models.
However, it is difficult to build large physical molecules, and all-atom physical models of even simple proteins could take weeks or months to build. Moreover, physical models are not robust and they decay over time. Molecular graphics is particularly valuable for representing global and local properties of molecules, such as electrostatic potential. Graphics can also be animated to represent molecular processes and chemical reactions, a feat that is not easy to reproduce physically.
screens or through plotter
s drawing on paper. Molecular structures have always been an attractive choice for developing new computer graphics
tools, since the input data are easy to create and the results are usually highly appealing. The first example of MG was a display of a protein
molecule (Project MAC, 1966) by Cyrus Levinthal
and Robert Langridge. Among the milestones in high-performance MG was the work of Nelson Max in "realistic" rendering of macromolecule
s using reflecting sphere
s.
By about 1980 many laboratories both in academia and industry had recognized the power of the computer to analyse and predict the properties of molecules, especially in materials science
and the pharmaceutical industry. The discipline was often called "molecular graphics" and in 1982 a group of academics and industrialists in the UK set up the Molecular Graphics Society (MGS). Initially much of the technology concentrated either on high-performance 3D graphics, including interactive rotation or 3D rendering of atoms as spheres (sometimes with radiosity
). During the 1980s a number of programs for calculating molecular properties (such as molecular dynamics
and quantum mechanics
) became available and the term "molecular graphics" often included these. As a result the MGS has now changed its name to the Molecular Graphics and Modelling Society (MGMS).
The requirements of macromolecular crystallography
also drove MG because the traditional techniques of physical model-building could not scale. Alwyn Jones' FRODO program (and later "O") were developed to overlay the molecular electron density
determined from X-ray crystallography and the hypothetical molecular structure.
 Both computer technology and graphic arts have contributed to molecular graphics. The development of structural biology
in the 1950s led to a requirement to display molecules with thousands of atom
s. The existing computer technology was limited in power, and in any case a naive depiction of all atoms left viewers overwhelmed. Most systems therefore used conventions where information was implicit or stylistic. Two vectors
meeting at a point implied an atom or (in macromolecules) a complete residue
(10-20 atoms).
The macromolecular approach was popularized by Dickerson and Geis' presentation of proteins and the graphic work of Jane Richardson
through high-quality hand-drawn diagrams such as the "ribbon"
representation. In this they strove to capture the intrinsic 'meaning' of the molecule. This search for the "messages in the molecule" has always accompanied the increasing power of computer graphics processing. Typically the depiction would concentrate on specific areas of the molecule (such as the active site
) and this might have different colors or more detail in the number of explicit atoms or the type of depiction (e.g., spheres for atoms).
In some cases the limitations of technology have led to serendipitous methods for rendering. Most early graphics devices used vector graphics
, which meant that rendering spheres and surfaces was impossible. Michael Connolly's program "MS" calculated points on the surface-accessible surface of a molecule, and the points were rendered as dots with good visibility using the new vector graphics technology, such as the Evans and Sutherland PS300 series. Thin sections ("slabs") through the structural display showed very clearly the complementarity
of the surfaces for molecules binding to active sites, and the "Connolly surface" became a universal metaphor.
The relationship between the art and science of molecular graphics is shown in the exhibitions sponsored by the Molecular Graphics Society. Some exhibits are created with molecular graphics programs alone, while others are collage
s, or involve physical materials. An example from Mike Hann (1994), inspired by Magritte's painting Ceci n'est pas une pipe, uses an image of a salmeterol
molecule.
"Ceci n'est pas une molecule," writes Mike Hann, "serves to remind us that all of the graphics images presented here are not molecules, not even pictures of molecules, but pictures of icons which we believe represent some aspects of the molecule's properties."
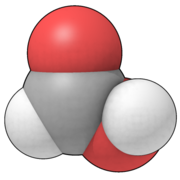 Fig. 4 is a "space-filling" representation of formic acid
, where atoms are drawn to suggest the amount of space they occupy. This is necessarily an icon: in the quantum mechanical representation of molecules, there are only (positively charged) nuclei and a "cloud" of negative electron
s. The electron cloud defines an approximate size for the molecule, though there can be no single precise definition of size. For many years the size of atoms has been approximated by mechanical models (CPK
), where the atoms have been represented by plastic spheres whose radius (van der Waals radius
) describes a sphere within which "most" of the electron density can be found. These spheres could be clicked together to show the steric aspects of the molecule rather than the positions of the nuclei. Fig. 4 shows the intricacy required to make sure that all spheres intersect correctly, and also demonstrates a reflective model.
 Since the atomic radii (e.g. in Fig. 4) are only slightly less than the distance between bonded atoms, the iconic spheres intersect, and in the CPK models, this was achieved by planar truncations along the bonding directions, the section being circular. When raster graphics
became affordable, one of the common approaches was to replicate CPK models in silico
. It is relatively straightforward to calculate the circles of intersection, but more complex to represent a model with hidden surface removal. A useful side product is that a conventional value for the molecular volume can be calculated.
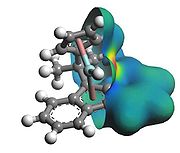
The use of spheres is often for convenience, being limited both by graphics libraries and the additional effort required to compute complete electronic density or other space-filling quantities. It is now relatively common to see images of surfaces that have been colored to show quantities such as electrostatic potential. Common surfaces in molecular visualization include solvent-accessible ("Lee-Richards") surfaces, solvent-excluded ("Connolly") surfaces, and isosurface
s. The isosurface in Fig. 5 appears to show the electrostatic potential, with blue colors being negative and red/yellow (near the metal) positive (there is no absolute convention of coloring, and red/positive, blue/negative are often reversed). Opaque isosurfaces do not allow the atoms to be seen and identified and it is not easy to deduce them. Because of this, isosurfaces are often drawn with a degree of transparency.
machines, which used stroke-writing vector monitor
s, sometimes even oscilloscopes. The electron beam does not sweep left-and-right as in a raster display. The display hardware followed a sequential list of digital drawing instructions (the display list), directly drawing at an angle one stroke for each molecular bond. When the list was complete, drawing would begin again from the top of the list, so if the list was long (a large number of molecular bonds), the display would flicker heavily. Later vector displays could rotate complex structures with smooth motion, since the orientation of all of the coordinates in the display list could be changed by loading just a few numbers into rotation registers in the display unit, and the display unit would multiply all coordinates in the display list by the contents of these registers as the picture was drawn.
The early black-and white vector displays could somewhat distinguish for example a molecular structure from its surrounding electron density map for crystallographic structure solution work by drawing the molecule brighter than the map. Color display makes them easier to tell apart. During the 1970s two-color stroke-writing Penetron
tubes were available, but not used in molecular computer graphics systems. In about 1980 Evans & Sutherland
made the first practical full-color vector displays for molecular graphics, typically attached to an E&S PS-300 display. This early color tube was expensive, because its was originally engineered to withstand the shaking of a flight-simulator motion base.
Color raster graphics display of molecular models began around 1978 as seen in this paper by Porter on spherical shading of atomic models. Early raster molecular graphics systems displayed static images that could take around a minute to generate. Dynamically rotating color raster molecular display phased in during 1982-1985 with the introduction of the Ikonas programmable raster display.
Molecular graphics has always pushed the limits of display technology, and has seen a number of cycles of integration and separation of compute-host and display. Early systems like Project MAC were bespoke
and unique, but in the 1970s the MMS-X and similar systems used (relatively) low-cost terminals, such as the Tektronix 4014
series, often over dial-up lines to multi-user hosts. The devices could only display static pictures but were able to evangelize MG. In the late 1970s, it was possible for departments (such as crystallography) to afford their own hosts (e.g., PDP-11
) and to attach a display (such as Evans & Sutherland
's MPS) directly to the bus
. The display list
was kept on the host, and interactivity was good since updates were rapidly reflected in the display—at the cost of reducing most machines to a single-user system.
In the early 1980s, Evans & Sutherland (E&S) decoupled their PS300 display, which contained its own display information transformable through a dataflow
architecture. Complex graphical objects could be downloaded over a serial line (e.g. 9600 baud
) and then manipulated without impact on the host. The architecture was excellent for high performance display but very inconvenient for domain-specific calculations, such as electron-density fitting and energy calculations. Many crystallographers and modellers spent arduous months trying to fit such activities into this architecture.
The benefits for MG were considerable, but by the later 1980s, UNIX
workstations such as Sun-3
with raster graphics
(initially at a resolution
of 256 by 256) had started to appear. Computer-assisted drug design
in particular required raster graphics for the display of computed properties such as atomic charge
and electrostatic potential. Although E&S had a high-end range of raster graphics (primarily aimed at the aerospace
industry) they failed to respond to the low-end market challenge where single users, rather than engineering departments, bought workstations. As a result the market for MG displays passed to Silicon Graphics
, coupled with the development of minisupercomputer
s (e.g., CONVEX
and Alliant
) which were affordable for well-supported MG laboratories. Silicon Graphics provided a graphics language, IrisGL, which was easier to use and more productive than the PS300 architecture. Commercial companies (e.g., Biosym, Polygen/MSI) ported their code to Silicon Graphics, and by the early 1990s, this was the "industry standard". Dial box
es were often used as control devices.
Stereoscopic displays
were developed based on liquid crystal
polarized spectacles, and while this had been very expensive on the PS300, it now became a commodity item. A common alternative was to add a polarizable screen to the front of the display and to provide viewers with extremely cheap spectacles with orthogonal polarization for separate eyes. With projectors such as Barco
, it was possible to project stereoscopic display onto special silvered screens and supply an audience of hundreds with spectacles. In this way molecular graphics became universally known within large sectors of chemical and biochemical science, especially in the pharmaceutical industry. Because the backgrounds of many displays were black by default, it was common for modelling sessions and lectures to be held with almost all lighting turned off.
In the last decade almost all of this technology has become commoditized. IrisGL evolved to OpenGL
so that molecular graphics can be run on any machine. In 1992, Roger Sayle released his RasMol
program into the public domain. RasMol contained a very high-performance molecular renderer that ran on Unix/X Window, and Sayle later ported this to the Windows
and Macintosh platforms. The Richardsons developed kinemage
s and the Mage software, which was also multi-platform. By specifying the chemical MIME type, molecular models could be served over the Internet, so that for the first time MG could be distributed at zero cost regardless of platform. In 1995, Birkbeck College
's crystallography department used this to run "Principles of Protein Structure", the first multimedia course on the Internet, which reached 100 to 200 scientists.
MG continues to see innovation that balances technology and art, and currently zero-cost or open source
programs such as PyMOL
and Jmol
have very wide use and acceptance.
Recently the wide spread diffusion of advanced graphics hardware
, has improved the rendering capabilities of the visualization tools. The capabilities of current shading languages
allow the inclusion of advanced graphic effects (like ambient occlusion
, cast shadows
and non-photorealistic rendering
techniques) in the interactive visualization
of molecules. These graphic effects, beside being eye candy
, can improve the comprehension of the three dimensional shapes of the molecules. An example of the effects that can be achieved exploiting recent graphics hardware can be seen in the simple open source visualization system QuteMol
.
units) and the screen. Because many molecules are chiral
it is essential that the handedness of the system (almost always right-handed) is preserved. In molecular graphics the origin (0, 0) is usually at the lower left, while in many computer systems the origin is at top left. If the z-coordinate is out of the screen (towards the viewer) the molecule will be referred to right-handed axes, while the screen display will be left-handed.
Molecular transformations normally require:
Conformational changes (e.g. rotations about bonds) require rotation of one part of the molecule relative to another. The programmer must decide whether a transformation on the screen reflects a change of view or a change in the molecule or its reference frame.
In early displays only vectors could be drawn e.g. (Fig. 7) which are easy to draw because no rendering or hidden surface removal is required.
On vector machines the lines would be smooth but on raster devices Bresenham's
algorithm is used (note the "jaggies" on some of the bonds, which can be largely removed with antialiasing software.)
Atoms can be drawn as circles, but these should be sorted so that those with the largest z-coordinates (nearest the screen) are drawn last. Although imperfect, this often gives a reasonably attractive display. Other simple tricks which do not include hidden surface algorithms are:
Typical pseudocode
for creating Fig. 7 (to fit the molecule exactly to the screen):
// assume:
// atoms with x, y, z coordinates (Angstrom) and elementSymbol
// bonds with pointers/references to atoms at ends
// table of colors for elementTypes
// find limits of molecule in molecule coordinates as xMin, yMin, xMax, yMax
scale = min(xScreenMax/(xMax-xMin), yScreenMax/(yMax-yMin))
xOffset = -xMin * scale; yOffset = -yMin * scale
for (bond in $bonds) {
atom0 = bond.getAtom(0)
atom1 = bond.getAtom(1)
x0 = xOffset+atom0.getX*scale; y0 = yOffset+atom0.getY*scale // (1)
x1 = xOffset+atom1.getX*scale; y1 = yOffset+atom1.getY*scale // (2)
x1 = atom1.getX; y1 = atom1.getY
xMid = (x0 + x1) /2; yMid = (y0 + y1) /2;
color0 = ColorTable.getColor(atom0.getSymbol)
drawLine (color0, x0, y0, xMid, yMid)
color1 = ColorTable.getColor(atom1.getSymbol)
drawLine (color1, x1, y1, xMid, yMid)
}
Note that this assumes the origin is in the bottom left corner of the screen, with Y up the screen. Many graphics systems have the origin at the top left, with Y down the screen. In this case the lines (1) and (2) should have the y coordinate generation as:
y0 = yScreenMax -(yOffset+atom0.getY*scale) // (1)
y1 = yScreenMax -(yOffset+atom1.getY*scale) // (2)
Changes of this sort change the handedness of the axes so it is easy to reverse the chirality of the displayed molecule unless care is taken.
algorithms can be used. For many years molecular graphics has stressed the capabilities of graphics hardware and has required hardware-specific approaches. With the increasing power of machines on the desktop, portability is more important and programs such as Jmol
have advanced algorithms that do not rely on hardware. On the other hand recent graphics hardware is able to interactively render very complex molecule shapes with a quality that would not be possible with standard software techniques.
crystal of a substance were bombarded with x-rays, and the diffracted beams that came off were assembled by computer using a Fourier transform
into a usually blurry 3-D image of the molecule, made visible by drawing contour circles around high electron density to produce a contoured electron density map.
In the earliest days contoured electron density maps were hand drawn on large plastic sheets. Sometimes bingo chips were placed on the plastic sheets where atoms were interpreted to be.
This was superseded by the Richards Box (see picture here) http://www.proteopedia.org/wiki/index.php/Frederic_M._Richards in which an adjustable brass Kendrew molecular model was placed front of a 2-way mirror, behind which were plastic sheets of the electron density map. This optically superimposed the molecular model and the electron density map. The model was moved to within the contour lines of the superimposed map. Then, atomic coordinates were recorded using a plumb bob and a meter stick.
Computer graphics held out the hope of vastly speeding up this process, as well as giving a clearer view in many ways.
A noteworthy attempt to overcome the low speed of graphics displays of the time took place at Washington University in St. Louis. Dave Barry's group attempted to leapfrog the state of the art in graphics displays by making custom display hardware to display images complex enough for large-molecule crystallographic structure solution, fitting molecules to their electron-density maps. The MMS-4 (table above) display modules were slow and expensive, so a second generation of modules was produced for the MMS-X (table above) system.
The first large molecule whose atomic structure was partly determined on a molecular computer graphics system was Transfer RNA by Sung-Hou Kim
's team in 1976. after initial fitting on a mechanical Richards Box. The first large molecule whose atomic structure was entirely determined on a molecular computer graphics system is said to be neurotoxin A from venom of the Philippines sea snake, by Tsernoglou, Petsko
, and Tu, with a statement of being first in 1977. The Richardson
group published partial atomic structure results of the protein superoxide dismutase the same year, in 1977. All of these were done using the GRIP-75 system.
Other structure fitting systems, FRODO, RING, Builder, MMS-X, etc. (table above) succeeded as well within three years and became dominant.
The reason that most of these systems succeeded in just those years, not earlier or later, and within a short timespan had to do with the arrival of commercial hardware that was up to the job. Two things were needed and arrived at about the same time. First, electron density maps are large and require either a computer with at least a 24-bit address space or a combination of a computer with a lesser 16-bit address space plus several years to overcome the difficulties of an address space that is smaller than the data. The second arrival was that of interactive computer graphics displays that were fast enough to display electron-density maps, whose contour circles require the display of numerous short vectors. The first such displays were the Vector General Series 3 and the Evans and Sutherland Picture System 2, MultiPicture System, and PS-300.
For further reading about early computer graphics systems for large-molecule crystallographic structure solutions see Duncan McRee.
Nowadays fitting of the molecular structure to the electron density map is largely automated by algorithms with computer graphics a guide to the process. An example is the XtalView XFit program.
Molecule
A molecule is an electrically neutral group of at least two atoms held together by covalent chemical bonds. Molecules are distinguished from ions by their electrical charge...
s and their properties through graphical representation. IUPAC limits the definition to representations on a "graphical display device". Ever since Dalton
John Dalton
John Dalton FRS was an English chemist, meteorologist and physicist. He is best known for his pioneering work in the development of modern atomic theory, and his research into colour blindness .-Early life:John Dalton was born into a Quaker family at Eaglesfield, near Cockermouth, Cumberland,...
's atoms and Kekulé's benzene
Benzene
Benzene is an organic chemical compound. It is composed of 6 carbon atoms in a ring, with 1 hydrogen atom attached to each carbon atom, with the molecular formula C6H6....
, there has been a rich history of hand-drawn atoms and molecules, and these representations have had an important influence on modern molecular graphics. This article concentrates on the use of computers to create molecular graphics. Note, however, that many molecular graphics programs and systems have close coupling between the graphics and editing commands or calculations such as in molecular modelling
Molecular modelling
Molecular modelling encompasses all theoretical methods and computational techniques used to model or mimic the behaviour of molecules. The techniques are used in the fields of computational chemistry, computational biology and materials science for studying molecular systems ranging from small...
.
Relation to molecular models
Molecular model
A molecular model, in this article, is a physical model that represents molecules and their processes. The creation of mathematical models of molecular properties and behaviour is molecular modelling, and their graphical depiction is molecular graphics, but these topics are closely linked and each...
s from physical materials. Perhaps the best known is Crick
Francis Crick
Francis Harry Compton Crick OM FRS was an English molecular biologist, biophysicist, and neuroscientist, and most noted for being one of two co-discoverers of the structure of the DNA molecule in 1953, together with James D. Watson...
and Watson's
James D. Watson
James Dewey Watson is an American molecular biologist, geneticist, and zoologist, best known as one of the co-discoverers of the structure of DNA in 1953 with Francis Crick...
model of DNA built from rods and planar sheets, but the most widely used approach is to represent all atoms and bonds explicitly using the "ball and stick
Ball-and-stick model
In chemistry, the ball-and-stick model is a molecular model of a chemical substance which is to display both the three-dimensional position of the atoms and the bonds between them...
" approach. This can demonstrate a wide range of properties, such as shape, relative size, and flexibility. Many chemistry courses expect that students will have access to ball and stick models. One goal of mainstream molecular graphics has been to represent the "ball and stick" model as realistically as possible and to couple this with calculations of molecular properties.
Figure 1 shows a small molecule (NH3CH2CH2C(OH)(PO3H)(PO3H)-), as drawn by the Jmol
Jmol
Jmol is an open-source Java viewer for chemical structures in 3D,that does not require 3D acceleration plugins.Jmol returns a 3D representation of a molecule that may be used as a teaching tool, or for research e.g...
program. It is important to realize that the colors and shapes are purely a convention, as individual atoms are not colored, nor do they have hard surfaces. Bond
Chemical bond
A chemical bond is an attraction between atoms that allows the formation of chemical substances that contain two or more atoms. The bond is caused by the electromagnetic force attraction between opposite charges, either between electrons and nuclei, or as the result of a dipole attraction...
s between atoms are also not rod-shaped.
Comparison of physical models with molecular graphics
Physical models and computer models have partially complementary strengths and weaknesses. Physical models can be used by those without access to a computer and now can be made cheaply out of plastic materials. Their tactile and visual aspects cannot be easily reproduced by computers (although haptic devices have occasionally been built). On a computer screen, the flexibility of molecules is also difficult to appreciate; illustrating the pseudorotationPseudorotation
The IUPAC defines pseudorotation as "a conformational change resulting in a structure that appears to have been produced by rotation of the entire initial molecule and is superimposable on the initial one, unless different positions are distinguished by substitution or isotopic labeling...
of cyclohexane
Cyclohexane
Cyclohexane is a cycloalkane with the molecular formula C6H12. Cyclohexane is used as a nonpolar solvent for the chemical industry, and also as a raw material for the industrial production of adipic acid and caprolactam, both of which being intermediates used in the production of nylon...
is a good example of the value of mechanical models.
However, it is difficult to build large physical molecules, and all-atom physical models of even simple proteins could take weeks or months to build. Moreover, physical models are not robust and they decay over time. Molecular graphics is particularly valuable for representing global and local properties of molecules, such as electrostatic potential. Graphics can also be animated to represent molecular processes and chemical reactions, a feat that is not easy to reproduce physically.
History
Initially the rendering was on early Cathode ray tubeCathode ray tube
The cathode ray tube is a vacuum tube containing an electron gun and a fluorescent screen used to view images. It has a means to accelerate and deflect the electron beam onto the fluorescent screen to create the images. The image may represent electrical waveforms , pictures , radar targets and...
screens or through plotter
Plotter
A plotter is a computer printing device for printing vector graphics. In the past, plotters were widely used in applications such as computer-aided design, though they have generally been replaced with wide-format conventional printers...
s drawing on paper. Molecular structures have always been an attractive choice for developing new computer graphics
Computer graphics
Computer graphics are graphics created using computers and, more generally, the representation and manipulation of image data by a computer with help from specialized software and hardware....
tools, since the input data are easy to create and the results are usually highly appealing. The first example of MG was a display of a protein
Protein
Proteins are biochemical compounds consisting of one or more polypeptides typically folded into a globular or fibrous form, facilitating a biological function. A polypeptide is a single linear polymer chain of amino acids bonded together by peptide bonds between the carboxyl and amino groups of...
molecule (Project MAC, 1966) by Cyrus Levinthal
Cyrus Levinthal
Cyrus Levinthal was an American molecular biologist.-Biography:Levinthal graduated with a Ph.D. in physics from University of California, Berkeley and taught physics at the University of Michigan for seven years before moving to the Massachusetts Institute of Technology in 1957...
and Robert Langridge. Among the milestones in high-performance MG was the work of Nelson Max in "realistic" rendering of macromolecule
Macromolecule
A macromolecule is a very large molecule commonly created by some form of polymerization. In biochemistry, the term is applied to the four conventional biopolymers , as well as non-polymeric molecules with large molecular mass such as macrocycles...
s using reflecting sphere
Sphere
A sphere is a perfectly round geometrical object in three-dimensional space, such as the shape of a round ball. Like a circle in two dimensions, a perfect sphere is completely symmetrical around its center, with all points on the surface lying the same distance r from the center point...
s.
By about 1980 many laboratories both in academia and industry had recognized the power of the computer to analyse and predict the properties of molecules, especially in materials science
Materials science
Materials science is an interdisciplinary field applying the properties of matter to various areas of science and engineering. This scientific field investigates the relationship between the structure of materials at atomic or molecular scales and their macroscopic properties. It incorporates...
and the pharmaceutical industry. The discipline was often called "molecular graphics" and in 1982 a group of academics and industrialists in the UK set up the Molecular Graphics Society (MGS). Initially much of the technology concentrated either on high-performance 3D graphics, including interactive rotation or 3D rendering of atoms as spheres (sometimes with radiosity
Radiosity
Radiosity is a global illumination algorithm used in 3D computer graphics rendering. Radiosity is an application of the finite element method to solving the rendering equation for scenes with purely diffuse surfaces...
). During the 1980s a number of programs for calculating molecular properties (such as molecular dynamics
Molecular dynamics
Molecular dynamics is a computer simulation of physical movements of atoms and molecules. The atoms and molecules are allowed to interact for a period of time, giving a view of the motion of the atoms...
and quantum mechanics
Quantum mechanics
Quantum mechanics, also known as quantum physics or quantum theory, is a branch of physics providing a mathematical description of much of the dual particle-like and wave-like behavior and interactions of energy and matter. It departs from classical mechanics primarily at the atomic and subatomic...
) became available and the term "molecular graphics" often included these. As a result the MGS has now changed its name to the Molecular Graphics and Modelling Society (MGMS).
The requirements of macromolecular crystallography
X-ray crystallography
X-ray crystallography is a method of determining the arrangement of atoms within a crystal, in which a beam of X-rays strikes a crystal and causes the beam of light to spread into many specific directions. From the angles and intensities of these diffracted beams, a crystallographer can produce a...
also drove MG because the traditional techniques of physical model-building could not scale. Alwyn Jones' FRODO program (and later "O") were developed to overlay the molecular electron density
Electron density
Electron density is the measure of the probability of an electron being present at a specific location.In molecules, regions of electron density are usually found around the atom, and its bonds...
determined from X-ray crystallography and the hypothetical molecular structure.
Art, science and technology in molecular graphics
Structural biology
Structural biology is a branch of molecular biology, biochemistry, and biophysics concerned with the molecular structure of biological macromolecules, especially proteins and nucleic acids, how they acquire the structures they have, and how alterations in their structures affect their function...
in the 1950s led to a requirement to display molecules with thousands of atom
Atom
The atom is a basic unit of matter that consists of a dense central nucleus surrounded by a cloud of negatively charged electrons. The atomic nucleus contains a mix of positively charged protons and electrically neutral neutrons...
s. The existing computer technology was limited in power, and in any case a naive depiction of all atoms left viewers overwhelmed. Most systems therefore used conventions where information was implicit or stylistic. Two vectors
Vector graphics
Vector graphics is the use of geometrical primitives such as points, lines, curves, and shapes or polygon, which are all based on mathematical expressions, to represent images in computer graphics...
meeting at a point implied an atom or (in macromolecules) a complete residue
Residue (chemistry)
In chemistry, residue is the material remaining after a distillation or an evaporation, or to a portion of a larger molecule, such as a methyl group. It may also refer to the undesired byproducts of a reaction....
(10-20 atoms).
The macromolecular approach was popularized by Dickerson and Geis' presentation of proteins and the graphic work of Jane Richardson
Jane S. Richardson
Jane Shelby Richardson is an American biochemist who developed the Richardson diagram, or ribbon diagram, method of representing proteins...
through high-quality hand-drawn diagrams such as the "ribbon"
Ribbon diagram
Proteins are biological macromolecules made up of a long polypeptide chain of amino acids linked by peptide bonds...
representation. In this they strove to capture the intrinsic 'meaning' of the molecule. This search for the "messages in the molecule" has always accompanied the increasing power of computer graphics processing. Typically the depiction would concentrate on specific areas of the molecule (such as the active site
Active site
In biology the active site is part of an enzyme where substrates bind and undergo a chemical reaction. The majority of enzymes are proteins but RNA enzymes called ribozymes also exist. The active site of an enzyme is usually found in a cleft or pocket that is lined by amino acid residues that...
) and this might have different colors or more detail in the number of explicit atoms or the type of depiction (e.g., spheres for atoms).
In some cases the limitations of technology have led to serendipitous methods for rendering. Most early graphics devices used vector graphics
Vector graphics
Vector graphics is the use of geometrical primitives such as points, lines, curves, and shapes or polygon, which are all based on mathematical expressions, to represent images in computer graphics...
, which meant that rendering spheres and surfaces was impossible. Michael Connolly's program "MS" calculated points on the surface-accessible surface of a molecule, and the points were rendered as dots with good visibility using the new vector graphics technology, such as the Evans and Sutherland PS300 series. Thin sections ("slabs") through the structural display showed very clearly the complementarity
Complementarity (molecular biology)
In molecular biology, complementarity is a property of double-stranded nucleic acids such as DNA, as well as DNA:RNA duplexes. Each strand is complementary to the other in that the base pairs between them are non-covalently connected via two or three hydrogen bonds...
of the surfaces for molecules binding to active sites, and the "Connolly surface" became a universal metaphor.
The relationship between the art and science of molecular graphics is shown in the exhibitions sponsored by the Molecular Graphics Society. Some exhibits are created with molecular graphics programs alone, while others are collage
Collage
A collage is a work of formal art, primarily in the visual arts, made from an assemblage of different forms, thus creating a new whole....
s, or involve physical materials. An example from Mike Hann (1994), inspired by Magritte's painting Ceci n'est pas une pipe, uses an image of a salmeterol
Salmeterol
Salmeterol is a long-acting beta2-adrenergic receptor agonist drug that is currently prescribed for the treatment of asthma and chronic obstructive pulmonary disease. It is currently available as a dry powder inhaler that releases a powdered form of the drug...
molecule.
"Ceci n'est pas une molecule," writes Mike Hann, "serves to remind us that all of the graphics images presented here are not molecules, not even pictures of molecules, but pictures of icons which we believe represent some aspects of the molecule's properties."
Space-filling models
Formic acid
Formic acid is the simplest carboxylic acid. Its chemical formula is HCOOH or HCO2H. It is an important intermediate in chemical synthesis and occurs naturally, most notably in the venom of bee and ant stings. In fact, its name comes from the Latin word for ant, formica, referring to its early...
, where atoms are drawn to suggest the amount of space they occupy. This is necessarily an icon: in the quantum mechanical representation of molecules, there are only (positively charged) nuclei and a "cloud" of negative electron
Electron
The electron is a subatomic particle with a negative elementary electric charge. It has no known components or substructure; in other words, it is generally thought to be an elementary particle. An electron has a mass that is approximately 1/1836 that of the proton...
s. The electron cloud defines an approximate size for the molecule, though there can be no single precise definition of size. For many years the size of atoms has been approximated by mechanical models (CPK
CPK coloring
In chemistry, the CPK coloring is a popular color convention for distinguishing atoms of different chemical elements in molecular models. The scheme is named after the CPK molecular models designed by chemists Robert Corey and Linus Pauling, and improved by Walter Koltun.-History:In 1952, Corey...
), where the atoms have been represented by plastic spheres whose radius (van der Waals radius
Van der Waals radius
The van der Waals radius, r, of an atom is the radius of an imaginary hard sphere which can be used to model the atom for many purposes. It is named after Johannes Diderik van der Waals, winner of the 1910 Nobel Prize in Physics, as he was the first to recognise that atoms had a finite size and to...
) describes a sphere within which "most" of the electron density can be found. These spheres could be clicked together to show the steric aspects of the molecule rather than the positions of the nuclei. Fig. 4 shows the intricacy required to make sure that all spheres intersect correctly, and also demonstrates a reflective model.
Raster graphics
In computer graphics, a raster graphics image, or bitmap, is a data structure representing a generally rectangular grid of pixels, or points of color, viewable via a monitor, paper, or other display medium...
became affordable, one of the common approaches was to replicate CPK models in silico
In silico
In silico is an expression used to mean "performed on computer or via computer simulation." The phrase was coined in 1989 as an analogy to the Latin phrases in vivo and in vitro which are commonly used in biology and refer to experiments done in living organisms and outside of living organisms,...
. It is relatively straightforward to calculate the circles of intersection, but more complex to represent a model with hidden surface removal. A useful side product is that a conventional value for the molecular volume can be calculated.
The use of spheres is often for convenience, being limited both by graphics libraries and the additional effort required to compute complete electronic density or other space-filling quantities. It is now relatively common to see images of surfaces that have been colored to show quantities such as electrostatic potential. Common surfaces in molecular visualization include solvent-accessible ("Lee-Richards") surfaces, solvent-excluded ("Connolly") surfaces, and isosurface
Isosurface
An isosurface is a three-dimensional analog of an isoline. It is a surface that represents points of a constant value within a volume of space; in other words, it is a level set of a continuous function whose domain is 3D-space.Isosurfaces are normally displayed using computer graphics, and are...
s. The isosurface in Fig. 5 appears to show the electrostatic potential, with blue colors being negative and red/yellow (near the metal) positive (there is no absolute convention of coloring, and red/positive, blue/negative are often reversed). Opaque isosurfaces do not allow the atoms to be seen and identified and it is not easy to deduce them. Because of this, isosurfaces are often drawn with a degree of transparency.
Technology
Early interactive molecular computer graphics systems were vector graphicsVector graphics
Vector graphics is the use of geometrical primitives such as points, lines, curves, and shapes or polygon, which are all based on mathematical expressions, to represent images in computer graphics...
machines, which used stroke-writing vector monitor
Vector monitor
A vector monitor or vector display is a display device used for early computers. It is a type of CRT, similar to the oscilloscope, but typically uses magnetic, rather than electrostatic, deflection...
s, sometimes even oscilloscopes. The electron beam does not sweep left-and-right as in a raster display. The display hardware followed a sequential list of digital drawing instructions (the display list), directly drawing at an angle one stroke for each molecular bond. When the list was complete, drawing would begin again from the top of the list, so if the list was long (a large number of molecular bonds), the display would flicker heavily. Later vector displays could rotate complex structures with smooth motion, since the orientation of all of the coordinates in the display list could be changed by loading just a few numbers into rotation registers in the display unit, and the display unit would multiply all coordinates in the display list by the contents of these registers as the picture was drawn.
The early black-and white vector displays could somewhat distinguish for example a molecular structure from its surrounding electron density map for crystallographic structure solution work by drawing the molecule brighter than the map. Color display makes them easier to tell apart. During the 1970s two-color stroke-writing Penetron
Penetron
The penetron, short for penetration tube, is a type of limited-color television used in some military applications. Unlike a conventional color television, the penetron produces a limited color gamut, typically two colors and their combination...
tubes were available, but not used in molecular computer graphics systems. In about 1980 Evans & Sutherland
Evans & Sutherland
Evans & Sutherland is a computer firm involved in the computer graphics field. Their products are used primarily by the military and large industrial firms for training and simulation, and in digital projection environments like planetariums.-History:...
made the first practical full-color vector displays for molecular graphics, typically attached to an E&S PS-300 display. This early color tube was expensive, because its was originally engineered to withstand the shaking of a flight-simulator motion base.
Color raster graphics display of molecular models began around 1978 as seen in this paper by Porter on spherical shading of atomic models. Early raster molecular graphics systems displayed static images that could take around a minute to generate. Dynamically rotating color raster molecular display phased in during 1982-1985 with the introduction of the Ikonas programmable raster display.
Molecular graphics has always pushed the limits of display technology, and has seen a number of cycles of integration and separation of compute-host and display. Early systems like Project MAC were bespoke
Bespoke
Bespoke is a term employed in a variety of applications to mean an item custom-made to the buyer's specification...
and unique, but in the 1970s the MMS-X and similar systems used (relatively) low-cost terminals, such as the Tektronix 4014
Tektronix 4014
The Tektronix 4000 series was a family of text and graphics computer terminals based on the company's storage tube technology. No additional electronics were needed to maintain the display, so the 4000 series were less expensive than earlier graphics terminals and became widely used in the CAD...
series, often over dial-up lines to multi-user hosts. The devices could only display static pictures but were able to evangelize MG. In the late 1970s, it was possible for departments (such as crystallography) to afford their own hosts (e.g., PDP-11
PDP-11
The PDP-11 was a series of 16-bit minicomputers sold by Digital Equipment Corporation from 1970 into the 1990s, one of a succession of products in the PDP series. The PDP-11 replaced the PDP-8 in many real-time applications, although both product lines lived in parallel for more than 10 years...
) and to attach a display (such as Evans & Sutherland
Evans & Sutherland
Evans & Sutherland is a computer firm involved in the computer graphics field. Their products are used primarily by the military and large industrial firms for training and simulation, and in digital projection environments like planetariums.-History:...
's MPS) directly to the bus
Computer bus
In computer architecture, a bus is a subsystem that transfers data between components inside a computer, or between computers.Early computer buses were literally parallel electrical wires with multiple connections, but the term is now used for any physical arrangement that provides the same...
. The display list
Display list
A display list is a series of graphics commands that define an output image. The image is created by executing the commands....
was kept on the host, and interactivity was good since updates were rapidly reflected in the display—at the cost of reducing most machines to a single-user system.
In the early 1980s, Evans & Sutherland (E&S) decoupled their PS300 display, which contained its own display information transformable through a dataflow
Dataflow
Dataflow is a term used in computing, and may have various shades of meaning. It is closely related to message passing.-Software architecture:...
architecture. Complex graphical objects could be downloaded over a serial line (e.g. 9600 baud
Baud
In telecommunications and electronics, baud is synonymous to symbols per second or pulses per second. It is the unit of symbol rate, also known as baud rate or modulation rate; the number of distinct symbol changes made to the transmission medium per second in a digitally modulated signal or a...
) and then manipulated without impact on the host. The architecture was excellent for high performance display but very inconvenient for domain-specific calculations, such as electron-density fitting and energy calculations. Many crystallographers and modellers spent arduous months trying to fit such activities into this architecture.
The benefits for MG were considerable, but by the later 1980s, UNIX
Unix
Unix is a multitasking, multi-user computer operating system originally developed in 1969 by a group of AT&T employees at Bell Labs, including Ken Thompson, Dennis Ritchie, Brian Kernighan, Douglas McIlroy, and Joe Ossanna...
workstations such as Sun-3
Sun-3
Sun-3 was the name given to a series of UNIX computer workstations and servers produced by Sun Microsystems, launched on September 9th, 1985. The Sun-3 series were VMEbus-based systems similar to some of the earlier Sun-2 series, but using the Motorola 68020 microprocessor, in combination with the...
with raster graphics
Raster graphics
In computer graphics, a raster graphics image, or bitmap, is a data structure representing a generally rectangular grid of pixels, or points of color, viewable via a monitor, paper, or other display medium...
(initially at a resolution
Image resolution
Image resolution is an umbrella term that describes the detail an image holds. The term applies to raster digital images, film images, and other types of images. Higher resolution means more image detail....
of 256 by 256) had started to appear. Computer-assisted drug design
Drug design
Drug design, also sometimes referred to as rational drug design or structure-based drug design, is the inventive process of finding new medications based on the knowledge of the biological target...
in particular required raster graphics for the display of computed properties such as atomic charge
Electric charge
Electric charge is a physical property of matter that causes it to experience a force when near other electrically charged matter. Electric charge comes in two types, called positive and negative. Two positively charged substances, or objects, experience a mutual repulsive force, as do two...
and electrostatic potential. Although E&S had a high-end range of raster graphics (primarily aimed at the aerospace
Aerospace
Aerospace comprises the atmosphere of Earth and surrounding space. Typically the term is used to refer to the industry that researches, designs, manufactures, operates, and maintains vehicles moving through air and space...
industry) they failed to respond to the low-end market challenge where single users, rather than engineering departments, bought workstations. As a result the market for MG displays passed to Silicon Graphics
Silicon Graphics
Silicon Graphics, Inc. was a manufacturer of high-performance computing solutions, including computer hardware and software, founded in 1981 by Jim Clark...
, coupled with the development of minisupercomputer
Minisupercomputer
Minisupercomputers constituted a short-lived class of computers that emerged in the mid-1980s. As scientific computing using vector processors became more popular, the need for lower-cost systems that might be used at the departmental level instead of the corporate level created an opportunity for...
s (e.g., CONVEX
Convex Computer
Convex Computer Corporation was a company that developed, manufactured and marketed vector minisupercomputers and supercomputers for small-to-medium-sized businesses. Their later Exemplar series of parallel computing machines were based on the Hewlett-Packard PA-RISC microprocessors, and in 1995,...
and Alliant
Alliant Computer Systems
Alliant Computer Systems was a computer company that designed and manufactured parallel computing systems. Together with Pyramid Technology and Sequent Computer Systems, Alliant's machines pioneered the symmetric multiprocessing market...
) which were affordable for well-supported MG laboratories. Silicon Graphics provided a graphics language, IrisGL, which was easier to use and more productive than the PS300 architecture. Commercial companies (e.g., Biosym, Polygen/MSI) ported their code to Silicon Graphics, and by the early 1990s, this was the "industry standard". Dial box
Dial box
A dial box is a computer peripheral for direct 3D manipulation e.g. to interactively input the rotation and torsion angles of a model displayed on a computer screen. Dial boxes were common input tools in the first years of interactive 3D graphics and they were available for Silicon Graphics or...
es were often used as control devices.
Stereoscopic displays
Stereopsis
Stereopsis refers to impression of depth that is perceived when a scene is viewed with both eyes by someone with normal binocular vision. Binocular viewing of a scene creates two slightly different images of the scene in the two eyes due the the eyes' different positions on the head...
were developed based on liquid crystal
Liquid crystal
Liquid crystals are a state of matter that have properties between those of a conventional liquid and those of a solid crystal. For instance, an LC may flow like a liquid, but its molecules may be oriented in a crystal-like way. There are many different types of LC phases, which can be...
polarized spectacles, and while this had been very expensive on the PS300, it now became a commodity item. A common alternative was to add a polarizable screen to the front of the display and to provide viewers with extremely cheap spectacles with orthogonal polarization for separate eyes. With projectors such as Barco
Barco
Barco N.V. is a display hardware manufacturer specialising in video projectors, LCD projectors, DLP projectors, LCoS projectors, LED displays, video walls, flat panel displays, automated luminaires, digital lighting and lighting controls....
, it was possible to project stereoscopic display onto special silvered screens and supply an audience of hundreds with spectacles. In this way molecular graphics became universally known within large sectors of chemical and biochemical science, especially in the pharmaceutical industry. Because the backgrounds of many displays were black by default, it was common for modelling sessions and lectures to be held with almost all lighting turned off.
In the last decade almost all of this technology has become commoditized. IrisGL evolved to OpenGL
OpenGL
OpenGL is a standard specification defining a cross-language, cross-platform API for writing applications that produce 2D and 3D computer graphics. The interface consists of over 250 different function calls which can be used to draw complex three-dimensional scenes from simple primitives. OpenGL...
so that molecular graphics can be run on any machine. In 1992, Roger Sayle released his RasMol
RasMol
RasMol is a computer program written for molecular graphics visualization intended and used primarily for the depiction and exploration of biological macromolecule structures, such as those found in the Protein Data Bank...
program into the public domain. RasMol contained a very high-performance molecular renderer that ran on Unix/X Window, and Sayle later ported this to the Windows
Microsoft Windows
Microsoft Windows is a series of operating systems produced by Microsoft.Microsoft introduced an operating environment named Windows on November 20, 1985 as an add-on to MS-DOS in response to the growing interest in graphical user interfaces . Microsoft Windows came to dominate the world's personal...
and Macintosh platforms. The Richardsons developed kinemage
Kinemage
A kinemage is an interactive graphic scientific illustration. It often is used to visualize molecules, especially proteins and nucleic acids, although it can also represent other types of 3-dimensional data...
s and the Mage software, which was also multi-platform. By specifying the chemical MIME type, molecular models could be served over the Internet, so that for the first time MG could be distributed at zero cost regardless of platform. In 1995, Birkbeck College
Birkbeck, University of London
Birkbeck, University of London is a public research university located in London, United Kingdom and a constituent college of the federal University of London. It offers many Master's and Bachelor's degree programmes that can be studied either part-time or full-time, though nearly all teaching is...
's crystallography department used this to run "Principles of Protein Structure", the first multimedia course on the Internet, which reached 100 to 200 scientists.
 |
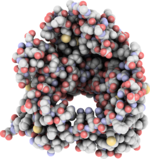 |
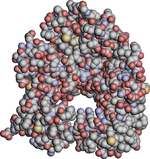
| Fig. 6. A molecule of Porin (protein) Porin (protein) Porins are beta barrel proteins that cross a cellular membrane and act as a pore through which molecules can diffuse. Unlike other membrane transport proteins, porins are large enough to allow passive diffusion, i.e., they act as channels that are specific to different types of molecules... shown without ambient occlusion Ambient occlusion Ambient occlusion is a shading method used in 3D computer graphics which helps add realism to local reflection models by taking into account attenuation of light due to occlusion... (left) and with (right). Advanced rendering effects can improve the comprehension of the 3D shape of a molecule. |
|
MG continues to see innovation that balances technology and art, and currently zero-cost or open source
Open source
The term open source describes practices in production and development that promote access to the end product's source materials. Some consider open source a philosophy, others consider it a pragmatic methodology...
programs such as PyMOL
PyMOL
PyMOL is an open-source, user-sponsored, molecular visualization system created by Warren Lyford DeLano and commercialized by DeLano Scientific LLC, which is a private software company dedicated to creating useful tools that become universally accessible to scientific and educational communities...
and Jmol
Jmol
Jmol is an open-source Java viewer for chemical structures in 3D,that does not require 3D acceleration plugins.Jmol returns a 3D representation of a molecule that may be used as a teaching tool, or for research e.g...
have very wide use and acceptance.
Recently the wide spread diffusion of advanced graphics hardware
Graphics hardware
Graphics hardware is a hardware that enable to produce and show computer graphics. It works in conjuntion with graphics software. Examples of graphics hardware are display devices, graphics cards and motion capture hardware....
, has improved the rendering capabilities of the visualization tools. The capabilities of current shading languages
Shader
In the field of computer graphics, a shader is a computer program that is used primarily to calculate rendering effects on graphics hardware with a high degree of flexibility...
allow the inclusion of advanced graphic effects (like ambient occlusion
Ambient occlusion
Ambient occlusion is a shading method used in 3D computer graphics which helps add realism to local reflection models by taking into account attenuation of light due to occlusion...
, cast shadows
Shadow
A shadow is an area where direct light from a light source cannot reach due to obstruction by an object. It occupies all of the space behind an opaque object with light in front of it. The cross section of a shadow is a two-dimensional silhouette, or reverse projection of the object blocking the...
and non-photorealistic rendering
Non-photorealistic rendering
Non-Photorealistic rendering is an area of computer graphics that focuses on enabling a wide variety of expressive styles for digital art. In contrast to traditional computer graphics, which has focused on photorealism, NPR is inspired by artistic styles such as painting, drawing, technical...
techniques) in the interactive visualization
Interactive visualization
Interactive visualization is a branch of graphic visualization in computer science that involves studying how humans interact with computers to create graphic illustrations of information and how this process can be made more efficient....
of molecules. These graphic effects, beside being eye candy
Eye candy
Eye candy may refer to:*Attractiveness*Eye Candy , an album by Mis-Teeq*software "Eye Candy", a plugin for Adobe Photoshop and Adobe Fireworks that adds new filter effects*"Eye Candy", an episode of the animated series Happy Tree Friends...
, can improve the comprehension of the three dimensional shapes of the molecules. An example of the effects that can be achieved exploiting recent graphics hardware can be seen in the simple open source visualization system QuteMol
QuteMol
QuteMol is an open source, interactive, molecular visualization system. QuteMol utilizes the current capabilities of modern GPUs through OpenGL shaders to offer an array of innovative visual effects...
.
Reference frames
Drawing molecules requires a transformation between molecular coordinates (usually, but not always, in AngstromÅngström
The angstrom or ångström, is a unit of length equal to 1/10,000,000,000 of a meter . Its symbol is the Swedish letter Å....
units) and the screen. Because many molecules are chiral
Chirality (chemistry)
A chiral molecule is a type of molecule that lacks an internal plane of symmetry and thus has a non-superimposable mirror image. The feature that is most often the cause of chirality in molecules is the presence of an asymmetric carbon atom....
it is essential that the handedness of the system (almost always right-handed) is preserved. In molecular graphics the origin (0, 0) is usually at the lower left, while in many computer systems the origin is at top left. If the z-coordinate is out of the screen (towards the viewer) the molecule will be referred to right-handed axes, while the screen display will be left-handed.
Molecular transformations normally require:
- scaling of the display (but not the molecule).
- translations of the molecule and objects on the screen.
- rotations about points and lines.
Conformational changes (e.g. rotations about bonds) require rotation of one part of the molecule relative to another. The programmer must decide whether a transformation on the screen reflects a change of view or a change in the molecule or its reference frame.
Simple
In early displays only vectors could be drawn e.g. (Fig. 7) which are easy to draw because no rendering or hidden surface removal is required.
On vector machines the lines would be smooth but on raster devices Bresenham's
Bresenham's line algorithm
The Bresenham line algorithm is an algorithm which determines which points in an n-dimensional raster should be plotted in order to form a close approximation to a straight line between two given points...
algorithm is used (note the "jaggies" on some of the bonds, which can be largely removed with antialiasing software.)
Atoms can be drawn as circles, but these should be sorted so that those with the largest z-coordinates (nearest the screen) are drawn last. Although imperfect, this often gives a reasonably attractive display. Other simple tricks which do not include hidden surface algorithms are:
- coloring each end of a bond with the same color as the atom to which it is attached (Fig. 7).
- drawing less than the whole length of the bond (e.g. 10%-90%) to simulate the bond sticking out of a circle.
- adding a small offset white circle within the circle for an atom to simulate reflection.
Typical pseudocode
Pseudocode
In computer science and numerical computation, pseudocode is a compact and informal high-level description of the operating principle of a computer program or other algorithm. It uses the structural conventions of a programming language, but is intended for human reading rather than machine reading...
for creating Fig. 7 (to fit the molecule exactly to the screen):
// assume:
// atoms with x, y, z coordinates (Angstrom) and elementSymbol
// bonds with pointers/references to atoms at ends
// table of colors for elementTypes
// find limits of molecule in molecule coordinates as xMin, yMin, xMax, yMax
scale = min(xScreenMax/(xMax-xMin), yScreenMax/(yMax-yMin))
xOffset = -xMin * scale; yOffset = -yMin * scale
for (bond in $bonds) {
atom0 = bond.getAtom(0)
atom1 = bond.getAtom(1)
x0 = xOffset+atom0.getX*scale; y0 = yOffset+atom0.getY*scale // (1)
x1 = xOffset+atom1.getX*scale; y1 = yOffset+atom1.getY*scale // (2)
x1 = atom1.getX; y1 = atom1.getY
xMid = (x0 + x1) /2; yMid = (y0 + y1) /2;
color0 = ColorTable.getColor(atom0.getSymbol)
drawLine (color0, x0, y0, xMid, yMid)
color1 = ColorTable.getColor(atom1.getSymbol)
drawLine (color1, x1, y1, xMid, yMid)
}
Note that this assumes the origin is in the bottom left corner of the screen, with Y up the screen. Many graphics systems have the origin at the top left, with Y down the screen. In this case the lines (1) and (2) should have the y coordinate generation as:
y0 = yScreenMax -(yOffset+atom0.getY*scale) // (1)
y1 = yScreenMax -(yOffset+atom1.getY*scale) // (2)
Changes of this sort change the handedness of the axes so it is easy to reverse the chirality of the displayed molecule unless care is taken.
Advanced
For greater realism and better comprehension of the 3D structure of a molecule many computer graphicsComputer graphics
Computer graphics are graphics created using computers and, more generally, the representation and manipulation of image data by a computer with help from specialized software and hardware....
algorithms can be used. For many years molecular graphics has stressed the capabilities of graphics hardware and has required hardware-specific approaches. With the increasing power of machines on the desktop, portability is more important and programs such as Jmol
Jmol
Jmol is an open-source Java viewer for chemical structures in 3D,that does not require 3D acceleration plugins.Jmol returns a 3D representation of a molecule that may be used as a teaching tool, or for research e.g...
have advanced algorithms that do not rely on hardware. On the other hand recent graphics hardware is able to interactively render very complex molecule shapes with a quality that would not be possible with standard software techniques.
Timeline
| Developer(s) | Approximate date | Technology | Comments |
|---|---|---|---|
| Crystallographers | < 1960 | Hand-drawn | Crystal structures, with hidden atom and bond removal. Often clinographic projections. |
| Johnson, Motherwell | ca 1970 | Pen plotter | ORTEP, PLUTO. Very widely deployed for publishing crystal structures. |
| Cyrus Levinthal Cyrus Levinthal Cyrus Levinthal was an American molecular biologist.-Biography:Levinthal graduated with a Ph.D. in physics from University of California, Berkeley and taught physics at the University of Michigan for seven years before moving to the Massachusetts Institute of Technology in 1957... , Bob Langridge, Ward, Stots |
1966 | Project MAC display system, two-degree of freedom, spring-return velocity joystick for rotating the image. | First protein display on screen. System for interactively building protein structures. |
| Barry | 1969 | Link 300 computer with a dual trace oscilloscope display. | Interactive molecular structure viewing system. Early examples of dynamic rotation, intensity depth·cueing, and side-by-side stereo. Early use of the small angle approximations (a = sin a, 1 = cos a) to speed up graphical rotation calculations. |
| Ortony | 1971 | Designed a stereo viewer (British patent appl. 13844/70) for molecular computer graphics. | Horizontal two-way (half-silvered) mirror combines images drawn on the upper and lower halves of a CRT. Crossed polarizers isolate the images to each eye. |
| Ortony | 1971 | Light pen, knob. | Interactive molecular structure viewing system. Select bond by turning another knob until desired bond lights up in sequence, a technique later used on the MMS-4 system below, or by picking with the light pen. Points in space are specified with a 3-D ”bug” under dynamic control. |
| Barry, Graesser, Marshall | 1971 | CHEMAST: LINK 300 computer driving an oscilloscope. Two-axis joystick, similar to one used later by GRIP-75 (below). | Interactive molecular structure viewing system. Structures dynamically rotated using the joystick. |
| Tountas and Katz | 1971 | Adage AGT/50 display | Interactive molecular structure viewing system. Mathematics of nested rotation and for laboratory-space rotation. |
| Perkins, Piper, Tattam, White | 1971 | Honeywell DDP 516 computer, EAL TR48 analog computer, Lanelec oscilloscope, 7 linear potentiometers. Stereo. | Interactive molecular structure viewing system. |
| Wright | 1972 | GRIP-71 at UNC-CH: IBM System/360 Model 40 time-shared computer, IBM 2250 display, buttons, light pen, keyboard. | Discrete manipulation and energy relaxation of protein structures. Program code became the foundation of the GRIP-75 system below. |
| Barry and North | 1972 | Oxford Univ.: Ferranti Argus 500 computer, Ferranti model 30 display, keyboard, track ball, one knob. Stereo. | Prototype large-molecule crystallographic structure solution system. Track ball rotates a bond, knob brightens the molecule vs. electron density map. |
| North, Ford, Watson | Early 1970s | Leeds Univ.: DEC PDP·11/40 computer, Hewlett-Packard display. 16 knobs, keyboard, spring-return joystick. Stereo. | Prototype large-molecule crystallographic structure solution system. Six knobs rotate and translate a small molecule. |
| Barry, Bosshard, Ellis, Marshall, Fritch, Jacobi | 1974 | MMS-4: Washington Univ. at St. Louis, Link 300 computer and an LDS-1 / Link 300 display, custom display modules. Rotation joystick, knobs. Stereo. | Prototype large-molecule crystallographic structure solution system. Select bond to rotate by turning another knob until desired bond lights up in sequence. |
| Cohen and Feldmann | 1974 | DEC PDP-10 computer, Adage display, push buttons, keyboard, knobs | Prototype large-molecule crystallographic structure solution system. |
| Stellman | 1975 | Princeton: PDP-10 computer, LDS-1 display, knobs | Prototype large-molecule crystallographic structure solution system. Electron density map not shown; instead an "H Factor" figure of merit is updated as the molecular structure is manipulated. |
| Collins, Cotton, Hazen, Meyer, Morimoto | 1975 | CRYSNET , Texas A&M Univ. DEC PDP-11/40 computer, Vector General Series 3 display, knobs, keyboard. Stereo. | Prototype large-molecule crystallographic structure solution system. Variety of viewing modes: rocking, spinning, and several stereo display modes. |
| Cornelius and Kraut | 1976 (approx.) | Univ, of Calif. at San Diego: DEC PDP-11/40 emulator (CalData 135), Evans and Sutherland Picture System display, keyboard, 6 knobs. Stereo. | Prototype large-molecule crystallographic structure solution system. |
| (Yale Univ.) | 1976 (approx.) | PIGS: DEC PDP-11/70 computer, Evans and Sutherland Picture System 2 display, data tablet, knobs. | Prototype large-molecule crystallographic structure solution system. The tablet was used for most interactions. |
| Feldmann and Porter | 1976 | NIH: DEC PDP—11/70 computer. Evans and Sutherland Picture System 2 display, knobs. Stereo. | Interactive molecular structure viewing system. Intended to display interactively molecular data from the AMSOM – Atlas of Macromolecular Structure on Microfiche. |
| Rosenberger et al. | 1976 | MMS-X: Washington Univ. at St. Louis, TI 980B computer, Hewlett-Packard 1321A display, Beehive video terminal, custom display modules, pair of 3-D spring-return joysticks, knobs. | Prototype (and later successful) large-molecule crystallographic structure solution system. Successor to the MMS-4 system above. The 3-D spring-return joysticks either translate and rotate the molecular structure for viewing or a molecular substructure for fitting, mode controlled by a toggle switch. |
| Britton, Lipscomb, Pique, Wright, Brooks Fred Brooks Frederick Phillips Brooks, Jr. is a software engineer and computer scientist, best known for managing the development of IBM's System/360 family of computers and the OS/360 software support package, then later writing candidly about the process in his seminal book The Mythical Man-Month... |
1977 | GRIP-75 at UNC-CH: Time-shared IBM System/360 Model 75 computer, DEC PDP 11/45 computer, Vector General Series 3 display, 3-D movement box from A.M. Noll A. Michael Noll A. Michael Noll is an American engineer, and professor emeritus at the Annenberg School for Communication at the University of Southern California. He was a very early pioneer in digital computer art and 3D animation and tactile communication.- Biography :Noll has a B.S.E.E... and 3-D spring return joystick for substructure manipulation, Measurement Systems nested joystick, knobs, sliders, buttons, keyboard, light pen. |
First large-molecule crystallographic structure solution. |
| Jones | 1978 | FRODO and RING Max Planck Inst., Germany, RING: DEC PDP-11/40 and Siemens 4004 computers, Vector General 3404 display, 6 knobs. | Large-molecule crystallographic structure solution. FRODO may have run on a DEC VAX-780 as a follow-on to RING. |
| Diamond | 1978 | Bilder Cambridge, England, DEC PDP-11/50 computer, Evans and Sutherland Picture System display, tablet. | Large-molecule crystallographic structure solution. All input is by data tablet. Molecular structures built on-line with ideal geometry. Later passes stretch bonds with idealization. |
| Langridge, White, Marshall | Late 1970s | Departmental systems (PDP-11 PDP-11 The PDP-11 was a series of 16-bit minicomputers sold by Digital Equipment Corporation from 1970 into the 1990s, one of a succession of products in the PDP series. The PDP-11 replaced the PDP-8 in many real-time applications, although both product lines lived in parallel for more than 10 years... , Tektronix Tektronix Tektronix, Inc. is an American company best known for its test and measurement equipment such as oscilloscopes, logic analyzers, and video and mobile test protocol equipment. In November 2007, Tektronix became a subsidiary of Danaher Corporation.... displays or DEC-VT11, e.g. MMS-X) |
Mixture of commodity computing with early displays. |
| Davies, Hubbard | Mid-1980s | CHEM-X, HYDRA | Laboratory systems with multicolor, raster and vector devices (Sigmex, PS300). |
| Biosym, Tripos, Polygen | Mid-1980s | PS300 and lower cost dumb terminals (VT200, SIGMEX) | Commercial integrated modelling and display packages. |
| Silicon Graphics Silicon Graphics Silicon Graphics, Inc. was a manufacturer of high-performance computing solutions, including computer hardware and software, founded in 1981 by Jim Clark... , Sun Sun Microsystems Sun Microsystems, Inc. was a company that sold :computers, computer components, :computer software, and :information technology services. Sun was founded on February 24, 1982... |
Late 1980s | IRIS GL IRIS GL IRIS GL was a proprietary graphics API created by Silicon Graphics for producing 2D and 3D computer graphics on their IRIX-based IRIS graphical workstations... (UNIX) workstations |
Commodity-priced single-user workstations with stereoscopic display. |
| EMBL - WHAT IF WHAT IF software WHAT IF is a computer program used in a wide variety of in silico macromolecular structure research fields such as:* Homology models of protein tertiary structures as well as quaternary structures,... |
1989, 2000 | Machine independent | Nearly free, multifunctional, still fully supported, many free servers based on it |
| Sayle, Richardson | 1992, 1993 | RasMol RasMol RasMol is a computer program written for molecular graphics visualization intended and used primarily for the depiction and exploration of biological macromolecule structures, such as those found in the Protein Data Bank... , Kinemage Kinemage A kinemage is an interactive graphic scientific illustration. It often is used to visualize molecules, especially proteins and nucleic acids, although it can also represent other types of 3-dimensional data... |
Platform-independent MG. |
| MDL (van Vliet, Maffett, Adler, Holt) | 1995–1998 | Chime MDL Chime MDL Chime is a free plugin used by web browsers to display the three dimensional structures of molecules. It is part of the ISIS product line acquired by Symyx Technologies from scientific publisher Elsevier in October 2007. It is based on the RasMol code.Chime is used by a wide range of... |
proprietary C++ ; free browser plugin for Mac (OS9) and PCs |
| ChemAxon Chemaxon ChemAxon is a software company specializing in application programming interfaces and end user applications for cheminformatics and life science research... |
1998- | MarvinSketch & MarvinView. MarvinSpace (2005) | proprietary Java applet Applet In computing, an applet is any small application that performs one specific task that runs within the scope of a larger program, often as a plug-in. An applet typically also refers to Java applets, i.e., programs written in the Java programming language that are included in a web page... or stand-alone Stand-alone Standalone software can mean:* Computer software that can work offline, i.e. does not necessarily require network connection to function* Software that is not a part of some software bundle... application. |
| Community efforts | 2000- | Jmol Jmol Jmol is an open-source Java viewer for chemical structures in 3D,that does not require 3D acceleration plugins.Jmol returns a 3D representation of a molecule that may be used as a teaching tool, or for research e.g... , PyMol PyMOL PyMOL is an open-source, user-sponsored, molecular visualization system created by Warren Lyford DeLano and commercialized by DeLano Scientific LLC, which is a private software company dedicated to creating useful tools that become universally accessible to scientific and educational communities... , Avogadro Avogadro (software) Avogadro is a molecular editor designed for cross-platform use in computational chemistry, molecular modeling, bioinformatics, materials science, and related areas... , PDB Protein Data Bank The Protein Data Bank is a repository for the 3-D structural data of large biological molecules, such as proteins and nucleic acids.... |
Open-source Java applet Applet In computing, an applet is any small application that performs one specific task that runs within the scope of a larger program, often as a plug-in. An applet typically also refers to Java applets, i.e., programs written in the Java programming language that are included in a web page... or stand-alone Stand-alone Standalone software can mean:* Computer software that can work offline, i.e. does not necessarily require network connection to function* Software that is not a part of some software bundle... application. |
| NOCH NOCH NOCH - is a free and open source molecular explorer for protein structure visualization. It allows for import of molecular structures described in the Protein Data Bank file format.... |
2002- | NOC | Powerful and open source code molecular structure explorer |
| LION Bioscience / EMBL | 2004- | SRS 3D | Free, open-source system based on Java3D. Integrates 3D structures with sequence and feature data (domains, SNPs, etc.). |
| San Diego Supercomputer Center | 2006- | Sirius Sirius visualization software Sirius is a molecular modeling and analysis system developed at San Diego Supercomputer Center. Sirius is designed to support advanced user requirements that go beyond simple display of small molecules and proteins... |
Free for academic/non-profit institutions |
| Weizmann Institute of Science - Community efforts | 2008- | Proteopedia Proteopedia Proteopedia is a wiki, 3D encyclopedia of proteins and other molecules..The site contains a page for every entry in the Protein Data Bank , as well as pages that are more descriptive of protein structures in general such as acetylcholinesterase, hemoglobin, and the photosystem II with a Jmol view... |
Collaborative, 3D wiki encyclopedia of proteins & other molecules |
Electronic Richards Box Systems
Before computer graphics could do the job, mechanical methods were used to fit large molecules to their electron density maps. Using techniques of X-ray crystallographyX-ray crystallography
X-ray crystallography is a method of determining the arrangement of atoms within a crystal, in which a beam of X-rays strikes a crystal and causes the beam of light to spread into many specific directions. From the angles and intensities of these diffracted beams, a crystallographer can produce a...
crystal of a substance were bombarded with x-rays, and the diffracted beams that came off were assembled by computer using a Fourier transform
Fourier transform
In mathematics, Fourier analysis is a subject area which grew from the study of Fourier series. The subject began with the study of the way general functions may be represented by sums of simpler trigonometric functions...
into a usually blurry 3-D image of the molecule, made visible by drawing contour circles around high electron density to produce a contoured electron density map.
In the earliest days contoured electron density maps were hand drawn on large plastic sheets. Sometimes bingo chips were placed on the plastic sheets where atoms were interpreted to be.
This was superseded by the Richards Box (see picture here) http://www.proteopedia.org/wiki/index.php/Frederic_M._Richards in which an adjustable brass Kendrew molecular model was placed front of a 2-way mirror, behind which were plastic sheets of the electron density map. This optically superimposed the molecular model and the electron density map. The model was moved to within the contour lines of the superimposed map. Then, atomic coordinates were recorded using a plumb bob and a meter stick.
Computer graphics held out the hope of vastly speeding up this process, as well as giving a clearer view in many ways.
A noteworthy attempt to overcome the low speed of graphics displays of the time took place at Washington University in St. Louis. Dave Barry's group attempted to leapfrog the state of the art in graphics displays by making custom display hardware to display images complex enough for large-molecule crystallographic structure solution, fitting molecules to their electron-density maps. The MMS-4 (table above) display modules were slow and expensive, so a second generation of modules was produced for the MMS-X (table above) system.
The first large molecule whose atomic structure was partly determined on a molecular computer graphics system was Transfer RNA by Sung-Hou Kim
Kim Sung-Hou
Kim Sung-Hou PhD is a Korean-born American structural biologist and biophysicist. Dr. Kim reported the first 3D structure of tRNA with A. Rich in 1973. He also published many papers on the structures of protein molecules including human Ras, human cyclin dependent kinase 2 and small heat shock...
's team in 1976. after initial fitting on a mechanical Richards Box. The first large molecule whose atomic structure was entirely determined on a molecular computer graphics system is said to be neurotoxin A from venom of the Philippines sea snake, by Tsernoglou, Petsko
Gregory Petsko
Gregory A. Petsko is an American biochemist and member of the National Academy of Sciences. He is currently the Gyula and Katica Tauber Professor of Biochemistry & Chemistry at Brandeis University.-Education:Petsko was an undergraduate at Princeton University...
, and Tu, with a statement of being first in 1977. The Richardson
Jane S. Richardson
Jane Shelby Richardson is an American biochemist who developed the Richardson diagram, or ribbon diagram, method of representing proteins...
group published partial atomic structure results of the protein superoxide dismutase the same year, in 1977. All of these were done using the GRIP-75 system.
Other structure fitting systems, FRODO, RING, Builder, MMS-X, etc. (table above) succeeded as well within three years and became dominant.
The reason that most of these systems succeeded in just those years, not earlier or later, and within a short timespan had to do with the arrival of commercial hardware that was up to the job. Two things were needed and arrived at about the same time. First, electron density maps are large and require either a computer with at least a 24-bit address space or a combination of a computer with a lesser 16-bit address space plus several years to overcome the difficulties of an address space that is smaller than the data. The second arrival was that of interactive computer graphics displays that were fast enough to display electron-density maps, whose contour circles require the display of numerous short vectors. The first such displays were the Vector General Series 3 and the Evans and Sutherland Picture System 2, MultiPicture System, and PS-300.
For further reading about early computer graphics systems for large-molecule crystallographic structure solutions see Duncan McRee.
Nowadays fitting of the molecular structure to the electron density map is largely automated by algorithms with computer graphics a guide to the process. An example is the XtalView XFit program.
See also
- List of molecular graphics systems
- List of web resources for visualizing molecular dynamics
- Molecular design softwareMolecular Design softwareMolecular design software is software for molecular modeling, that provides special support for developing molecular models de novo.In contrast to the usual molecular modeling programs such as the molecular dynamics and quantum chemistry programs, such software directly supports the aspects related...
- Molecular modelMolecular modelA molecular model, in this article, is a physical model that represents molecules and their processes. The creation of mathematical models of molecular properties and behaviour is molecular modelling, and their graphical depiction is molecular graphics, but these topics are closely linked and each...
- Molecular modellingMolecular modellingMolecular modelling encompasses all theoretical methods and computational techniques used to model or mimic the behaviour of molecules. The techniques are used in the fields of computational chemistry, computational biology and materials science for studying molecular systems ranging from small...
- Molecular geometryMolecular geometryMolecular geometry or molecular structure is the three-dimensional arrangement of the atoms that constitute a molecule. It determines several properties of a substance including its reactivity, polarity, phase of matter, color, magnetism, and biological activity.- Molecular geometry determination...
- Molecule editorMolecule editorA molecule editor is a computer program for creating and modifying representations of chemical structures.Molecule editors can manipulate chemical structure representations in either two- or three-dimensions. Two-Dimensional editors generate output used as illustrations or for querying chemical...
- Software for molecular mechanics modeling
External links
- Luminary Series Interview with Robert Langridge Interview by Russ Altman and historical slides.
- History of Visualization of Biological Macromolecules by Eric Martz and Eric Francoeur.