

Income inequality in the United States
Encyclopedia
Income inequality in the United States of America refers to the extent to which income
is distributed in an uneven manner in the US. Data from the United States Department of Commerce
, CBO
, and Internal Revenue Service
indicate that income inequality among households has been increasing significantly since the late 1970s
,
after several decades of stability
. Inequality between male and female workers in the US has decreased considerably since 1953 but remains relatively large.
A CBO study in 2011 found that the top 1% of households gained about 275% over a period between 1979 and 2007, although this number has decreased somewhat since 2007 as a result of the Great Recession
. The increase is far above other income levels, especially the bottom 80%, whose share of national income growth declined over this period.
As of 2006, the United States had one of the highest levels of income inequality, as measured through the Gini index, among similar high income countries
or developed countries, being one of only a few developed countries
where inequality has increased since 1980.
Scholars and others differ as the cause(s) and significance of the trend, which in 2011 helped ignite the "Occupy" protest movement
. While education and increased demand for skilled labor is often cited as a cause of increased inequality, many social scientists, such as economists Paul Krugman
and Timothy Smeeding and political scientists Larry Bartels
and Nathan Kelly
, point to public policy and partisan politics as an important cause of inequality.
") to present. Krugman argues that in modern American history there has been a great "economic arc from high inequality to relative equality and back again." In 1915, an era in which the Rockefellers and Carnegies dominated American industry, the richest 1% of Americans earned roughly 18% of all income. Today, the top 1% account for 24% of all income. From 1870 to sometime around 1937 inequality was quite high, but from about 1937 to 1947 inequality dropped dramatically -- a period dubbed "the the Great Compression
", Brought on by highly progressive New Deal taxation, the strengthening of unions, and regulation of the National War Labor Board during World War II. This relatively low level of inequality remained fairly steady for about three decades until the late 1970s when income again began to become more concentrated. Krugman refers to this period after 1979 as the “Great Divergence.” Inequality increased during the 1980s, decreased slightly during the late 1990s and has since continued its overall increasing trend.

 The distribution of income in the United States — most commonly measured by household
or individual
— has become increasingly unequal in the last three decades or so. In 2010, the top 20% of Americans earned 49.4% of the nation’s income, compared with the 3.4% earned by Americans living below the poverty line (roughly 15% of the population). This earnings ratio of 14.5 to 1 was an increase from the 13.6 to 1 ratio in 2008 and a significant rise from the historic low of 7.69 to 1 in 1968.
The 2011 Congressional Budget Office
report found the following with respect to indicators: Real household income in the U.S. grew by 62% between 1979 and 2007. However, after-tax income of households in the top 1% of earners grew by 275%, while income growth for the bottom fifth of earners was 18%. “As a result of that uneven income growth," the report notes, "the share of total after-tax income received by the 1 percent of the population in households with the highest income more than doubled between 1979 and 2007, whereas the share received by low- and middle-income households declined … The share of income received by the top 1 percent grew from about 8 percent in 1979 to over 17 percent in 2007. The share received by other households in the highest income quintile (one-fifth of the population as divided by income) was fairly flat over the same period, edging up from 35 percent to 36 percent.”
However, it should be noted that the people or households in the quintile may change over time, some falling into lower quintiles, and being replaced by those rising.
According to economist Janet Yellen
"the growth [in real income] was heavily concentrated at the very tip of the top, that is, the top 1 percent." A 2006 analysis of IRS income data by economists Emmanuel Saez at the University of California, Berkeley
and Thomas Piketty at the Paris School of Economics
showed that the share of income held by the top 1% was as large in 2005 as in 1928. The data revealed that reported income increased by 9% in 2005, with the mean for the top 1% increasing by 14% and that for the bottom 90% dropping slightly by 0.6%.
A study done by University of Texas economists James K. Galbraith and Travis Hale titled "Income Distribution and the Information Technology Bubble" found that during the technology boom of the late 1990's, most of the gains enjoyed by the top 1% came from a small number of counties, rather than a national trend. Almost all of the richest 1%'s gains occurred in the economic hotbeds of Silicon Valley
, and also New York City. If the top four counties in those regions are removed, there is almost no trend towards income inequality during the years studied (1994-2000). On this basis, the researchers ascribe the growth in income inequality in the late 1990's to the growth of information technology. However, the study was done prior to the "dot com bubble" collapse where Technology-heavy NASDAQ Composite Index fell from a peak of 5,048.62 to a low 1,695.37.
Between 1979 and 2005, the mean after-tax income for the top 1% increased by 176%, compared to an increase of 69% for the top quintile overall, 20% for the fourth quintile, 21% for the middle quintile, 17% for the second quintile and 6% for the bottom quintile. For the same time span the aggregate share of after-tax income held by the top percentile increased from 7.5% to 14%. Economist Timothy Smeeding summed up the current trend of rising inequality on the pages of the Social Science Quarterly:
 Conservatives commonly focused on the flaws of household income as a measure for standard of living in order to refute claims that income inequality is growing, becoming excessive or posing a problem for society. High earning households are more likely to be dual earner households, and households in the upper quintile tend to be larger than households in lower quintiles. Thus gross annual household income does not always accurately reflect standard of living
as it does not consider household size. As of 2005, 42% of all U.S. households and 76% of those in the top quintile had two or more income earner
s.
A 2004 analysis of income quintile data by the Heritage Foundation
stated that the aggregate share of income held by the upper quintile (the top earning 20%) decreases by 20.3% when figures are adjusted to reflect household size.
During the early 1920s, median earnings decreased for both sexes, not increasing substantially until the late 1990s. Since 1974 the median income for workers of both sexes increased by 31.7% from $18,474 to $24,325, reaching its high-point in 2000. Income inequality has increased considerably as well with the top 1% receiving much larger gains than all other demographics. This group has pulled ahead of other income earners including the remainder of the top 10% considerably during the past few years.
According to Gini index data income inequality among all workers with incomes increased by roughly 20% since 1967. Both increasing median income, largely connected to an increase in educational attainment, and income inequality with the very top earners gaining a larger share has characterized personal income trends during the past thirty or so years.
or coefficient, which measures inequality on a scale from 0 to 1 -- where 0 represents perfect equality with everyone having exactly the same income, and 1 represents perfect inequality with one person having all income. Index scores are commonly multiplied by 100 to make them easier to understand.
Since the Census Bureau started measuring the Gini coefficient in 1967, it has risen by 20% for full-time workers and 18% for households. Among households, the index has risen from 39.7 to 46.9, from 31.4 to 42.4 among men and from 29.8 to 35.7 among women.
Gini index ratings are often used to compare inequality in countries. Recent ratings provided by the UN range from 24.7 in Denmark
to 74.3 in Namibia
, while the most recent CIA World Factbook ratings range from 23 (Sweden
) to 70.7 (Namibia). According to Gini coefficient data, income inequality in the U.S., was already among the highest in the post-industrial world, before its rise from 1967 and 2005 among households and individuals. Most post-industrial nations are in the lower, more equal, end of the spectrum, with a Gini coefficient in the high twenties to mid thirties. In 2005 the Gini index for the EU was estimated at 31. America's is at the higher end, rated 40 or 45. (Factbook estimates the US Gini index at 45, 95th in equality out of 134 countries studied and rated; the UN estimates it at 40, placing it 32nd out of 39 countries it rated.
As the chart below demonstrates, inequality of income in some countries has increased steadily (China and the US); in others changed little (Belgium, Canada, Germany, Japan, and Sweden); and in others declined significantly (France, Italy, Mexico, and Norway).
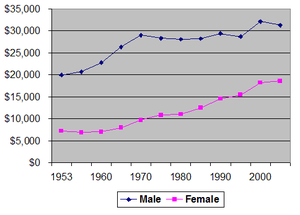
 Income levels remain considerably lower for females than for men with certain racial demographics having median income levels considerably below the national median. Personal income has risen considerably since 1953, especially for female workers. For male workers, however, income stagnated during the 1970s and 1980s, increasing substantially during the 1990s and then stagnating once more since 2000.
Despite considerable progress in pursuing gender and racial equality, some social scientists attribute these discrepancies in income to continued discrimination. Others argue that the majority of the wage gap is due to women's choices and preferences. Women are more likely to consider factors other than salary when looking for employment. On average, women are less willing to travel or relocate, take more hours off and work fewer hours, and choose college majors that lead to lower paying jobs. Women are also more likely to work for governments or non-profits, that pay less than the private sector. According to this perspective certain ethnic minorities and women receive fewer promotions and opportunities for occupation and economic advancement than others. In the case of women this concept is referred to as the glass ceiling
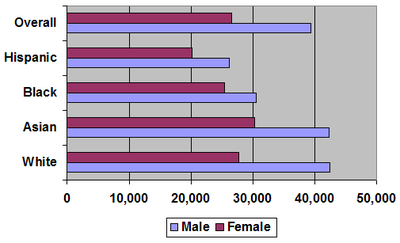
keeping women from climbing the occupational ladder. In terms of race, studies have shown that African Americans are less likely to be hired than European-Americans with the same qualifications. The continued prevalence of traditional gender roles and ethnic stereotypes may partially account for current levels of discrimination. In 2005, median income levels were highest among Asian and White males and lowest among females of all races, especially those identifying as African American or Hispanic. Despite closing gender and racial gaps, considerable discrepancies remain among racial and gender demographics, even at the same level of educational attainment.
Since 1953 the income gap between male and female workers has decreased considerably but remains relatively large. Women currently earn significantly more Associate's, Bachelor's, and Master's degrees than men and almost as many Doctorates. Women are projected to have passed men in Doctorates earned in 2006–2007, and to earn nearly two thirds of Associate's, Bachelor's, and Master's degrees by 2016. Despite this, some still argue that male workers still hold higher educational attainment, as the success of women in academia is a relatively new phenomenon. Though it is important to note that income inequality between sexes remained stark at all levels of educational attainment. Between 1953 and 2005 median earnings as well as educational attainment increased, at a far greater pace for women than for men. Median income for male earners increased by 36.2% versus 157.2% among female earners. This means that the median income of women rose 334.5% as fast as that of men. The extent by which men out-earned women reduced by 61.2%, indicating increased gender equality. Today the median male worker earns roughly 68.36% more than their female counterparts, compared to 176.25% in 1953. Furthermore income has increased more or less continuously for women, while the median earning for men have shown some fluctuation and stagnation since the early 1970s. The median income of men in 2005 was 2% higher than in 1973 compared to a 74.6% increase for female earners. Racial differences remained stark as well, with the highest earning sex-gender demographic of workers aged 25 or older, Asian males (who were roughly tied with white males) earning more than twice, 109.7%, as much as the lowest-earning demographic, Hispanic females. As mentioned above, inequality between races and gender persisted at similar education levels. In 2005, Asian men, age 25+, with a Bachelor's degree or higher
earned 203.8% more than Hispanic females (age 25+) with the same educational attainment. Racial differences were overall more pronounced among male than among female income earners.
According to Economist Paul Krugman
these hypotheses came to be found "increasingly inadequate" as more evidence accumulated.
Immigration was also criticized as weak or insufficient to explain the change.
Other scholars (such as political scientists Jacob S. Hacker and Paul Pierson
) examining the issue also questioned the explanation of educational achievements and workplace skills. Other countries of similar education levels and economies have not gone the way of the US, and the growth in inequality hasn't followed a pattern of "the 29% of Americans with college degrees pulling away" from those who have less education.
and Nathan Kelly, point to public policy and partisan politics as an important cause of inequality. They point out that education, labor force, and demographic changes cannot be the sole cause of the widening gap between the rich and the poor, and that the U.S. is unique in having experienced such a rise in inequality – a trend that, if caused by education, labor force, and demographic factors, would have manifested itself in other developed nations.
The diminishing political clout of labor unions, resulting from declining union membership rates, and less government redistribution as well as decreased expenditure on social services are commonly cited as the main causes of this trend.
Federal taxes (personal income tax, payroll tax, gift and estate tax, etc.) and transfers (Social Security, Unemployment Insurance, etc.), reduced inequality by 20% in 2007 according to the CBO
-- while in 1979 they reduced it by an even larger amount.
In addition, there is strong evidence that the party of the president and the ideological content of public policy have powerfully shaped the path of income inequality over time. While expertise, productiveness and work experience, inheritance, gender, and race had a strong influence on personal income, household income was largely affected by the number of income earners, contributing to inequality between households based on the number of earners in them. Yet, other causes for income inequality, especially some of those behind its recent rise, likely remain unknown.
There is some debate in the political and academic spheres over the roll of tax policy changes over the last thirty years contributing to income inequality. Economists such as Paul Krugman
argue that policies such as the Bush Tax Cuts
have increased income inequality by letting the rich keep a greater amount of their wealth relative to poorer people.
education attainment
(usually measured by the highest degree of education an individual has completed) has gained importance. More and more employers require expertise that they did not a generation ago, while the manufacturing sector which employed many of those lacking a post-secondary education is decreasing in size.
The resulting economic job market may be referred to as constituting a "two-tier" labor market. In this market the income discrepancy between the professional and working class may be growing. Sociologists such as Dennis Gilbert refer to the professional class as a privileged class due to its favorable disposition in the two-tier labor market. Income gains and median levels were higher among those with the higher academic degrees, that is those who possess scarce amounts of certified expertise. In other words, higher educational attainment translates into higher personal income levels and larger income increases over time.The benefits of education are worth the time and effort, especially when considering the high “return” rates of personal income. By examining the “return” to a year of school, income can be determined for each year invested in education. For instance, the equation for “return” to a year of school, say for the 11th grade year is = (income for 11th grade – income for 10th grade)/income for 10th grade. Generally, this implies that more time invested each year in education results in higher income because of increased human capital.
While the higher education commonly translates into higher income, and the highly educated tend to reside in upper quintile households
, differences in educational attainment fail to explain income discrepancies between the top 1% and the rest of the population. Large percentages of individuals lacking a college degree
are present in all income demographics, including 33% of those with heading households with six figure incomes
. In 2005, roughly 55% of income earners with doctorate degrees, the most educated 1.4%, were among the top 15% earners. Among those with Masters degrees, the most educated 10%, roughly half had incomes among the top 20% of earners. Only among households in the top quintile were householders with college degrees in the majority. While discrepancies in educational attainment cannot account for all aspects of income inequality, education remains one of the strongest influences on income distribution, thereby affecting income inequality. From 2000 to 2010, the 1.5% of Americans with an M.D., J.D., or M.B.A. and the 1.5% with a PhD saw gains of approximately 5%. Among those with a college or master’s degree (about 25% of the American workforce) average wages dropped by about 7 percent, and wages dropped even more for those who had not completed college.
While the returns to education increased considerably in the United States since the 1980s, it has not increased as much in many European countries such as Germany, France or the United Kingdom . The reasons for this discrepancy in inequality trends between Europe and the United States is still the subject of much debate but one study suggests that tight regulations of labor markets in Europe could have prevented the returns to education from rising there as much as in the United States, but at the expense of creating unemployment .
, may increase the concentration of income and wealth by the owners of capital.
The development of a modern efficient political system, especially lobbying
, by top earnersand particularly corporate executives and the financial services industry. According to political scientists Jacob Hacker and Paul Pierson writing in the book Winner-Take-All Politics
, the end of the 1970s saw a transformation of American politics away from a focus on the middle class, with new, much more effective, aggressive and well-financed lobbyists and pressure groups acting on behalf of upper income groups. Executives successfully eliminated any countervailing power or oversight of corporate managers (from private litigation, boards of directors and shareholders, the Securities and Exchange Commission or labor unions). The financial industry's success came from successfully pushing for deregulation of financial markets, allowing much more lucrative but much more risky investments from which it privatized the gains while socializing the losses with government bailouts. (the two groups formed about 60% of the top 0.1% of taxpayers.) All top earners were helped by deep cuts in estate and capital gains taxes, and tax rates on high levels of income.
In addition to politics, Krugman postulated change in norms of corporate culture have played a factor. While corporate executives had (or could develop) the ability to pay themselves very high compensation through control of corporate boards of directors, they restrained themselves. The New Deal
imposed norms of relative equality in pay and executives followed those norms for more than 30 years, but in the late 1970s there was a "relaxation of old strictures, a new permissiveness", in American management akin to the sexual revolution
of the 1960's. "By the end of the 1990's, the executive motto might as well have been If it feels good, do it," and the average real annual compensation of the top 100 C.E.O.'s skyrocketed from $1.3 million -- 39 times the pay of an average worker -- to $37.5 million, more than 1,000 times the pay of ordinary workers from 1982to 2002. Journalist George Packer, writing in Foreign Affairs
magazine, also sees the dramatic increase in inequality in America as a product of the change in attitude of the American elite, which (in his view) has been transitioning itself from pillars of society to a special interest group.
Journalist Timothy Noah in the series “The United States of Inequality” summarized Bartels's findings referring to the administrations of Democratic presidents as "Democrat-world", and GOP administrations as "Republican-world":
The pattern of distribution of growth appears to be the result of a whole host of policies,
During Republican President Ronald Reagan's tenure in office the top marginal income tax rate was reduced from over 70 to 28 percent, high top marginal rates like 70% being the sort in place during much of the period of great income equality following the “Great Compression”.
Progressivity
of income tax and the (effective) rate at which income is taxed
can have an effect on equality.
A progressive tax
is a tax by which the tax rate increases as the taxable base amount increases. In a progressive tax system, the level of the top tax rate will have a direct impact on the level of inequality within a society, either increasing it or decreasing it. Additionally, a steeper progressivity results in an even more equal distribution of income across the board. The difference between the Gini index for an income distribution before taxation and the Gini index after taxation is an indicator for the effects of such taxation. Overall income tax rates in the United States are below the OECD
average.
 All societies feature some income inequality as the positions people hold in these societies vary in responsibility, importance and complexity. In order to provide sufficient incentive for a wide variety of occupations to be filled with motivated incumbents societies need to provide a variety of rewards. Income is among the perhaps most prominent forms of compensation. Since abundant supply decreases market value, the possession of scarce skills considerably increases income. Among the American lower class
, the most common source of income was not occupation, but government welfare.
As expected, households in the upper quintiles are generally home to more, better educated and employed working income earners, than those in lower quintiles. Among those in the upper quintile, 62% of householders were college graduates, 80% worked full-time and 76% of households had two or more income earners, compared to the national percentages of 27%, 58% and 42%, respectively. Upper-most sphere US Census Bureau data indicated that occupational achievement and the possession of scarce skills correlates with higher income.
-- starting in Wall Street and spreading to 600 communities across the United States. Its main political slogan is "We are the 99%", references its dissatisfaction with the concentration of income in the top 1%.
Commentators, economists, politicians do not agree on the issue or its importance. Some have argued that the increase in inequality in America is highly undesirable -- unjust, a danger to democracy/social stability, and/or even a sign of national decline. Others have claimed that the increase is not significant and an excuse for "class-warfare rhetoric", that its created a divide between the educated and the less educated, or that it doesn't matter, because America's economic growth and/or equality of opportunity are what's important.
writing on the "Great Divergence" of income in America, quote a warning by Greek/Roman historian Plutarch
: `An imbalance between rich and poor is the oldest and most fatal ailment of all republics.`
In the words of journalist George Packer,
, and Congressman Paul Ryan (R., Wisc.) say that the United States redeems its disproportionate income inequality, relative to western Europe, by offering greater equality of opportunity.
Sowell suggests that many discussions of income equality ignore fluctuations in income and social mobility. He writes,
According to Thomas A. Garrett, studies examining quintiles of wealth levels may provide a misleading picture.
For example, a U.S. Treasury study of the period from 1996 to 2005 found that "[l]ess than half (40 percent or 43 percent depending on the measure) of those in the top 1 percent in 1996 were still in the top 1 percent in 2005. Only about 25 percent of the individuals in the top 1/100th percent in 1996 remained in the top 1/100th percent in 2005."
However others, such as economist Paul Krugman
, argue that despite their "great ferocity in presenting its case and attacking its opponents", conservatives ignore public record on social mobility
statistics in the United States. Over the course of a person's lifetime, income rises and falls -- low during student years and the beginning of a career, or unemployment and job searching, rising to peak earnings of a career, and then down during retirement -- but this 'mobility' is not an appreciable part of the trend in income in equality and not the same as rising from poor to middle income, or from middle to upper income.
Krugman argues claims of strong socio-economic mobility are contradicted by the 2011 Congressional Budget Office study on income inequality which says
In other words, "many people who have incomes greater than $1 million one year fall out of the category the next year — but that’s typically because their income fell from, say, 1.05 million to 0.95 million, not because they went back to being middle class."
Another study (by Kopczuk, Saez and Song in 2007) found social/economic mobility in America at top income levels "very stable" and "not mitigated the dramatic increase in annual earnings concentration since the 1970s." Social/economic mobility declined significantly after World War II and has declined slightly from the 1970s.
Dan Ariely
and Michael Norton show in a study (2011) that US citizens across the political spectrum significantly underestimate the current US wealth inequality and would prefer a more egalitarian distribution of wealth, raising questions about ideological disputes over issues like taxation and welfare.
General:
Income in the United States
Income in the United States is measured by the United States Department of Commerce either by household or individual. The differences between household and personal income is considerable since 42% of households, the majority of those in the top two quintiles with incomes exceeding $57,658, now...
is distributed in an uneven manner in the US. Data from the United States Department of Commerce
United States Department of Commerce
The United States Department of Commerce is the Cabinet department of the United States government concerned with promoting economic growth. It was originally created as the United States Department of Commerce and Labor on February 14, 1903...
, CBO
Congressional Budget Office
The Congressional Budget Office is a federal agency within the legislative branch of the United States government that provides economic data to Congress....
, and Internal Revenue Service
Internal Revenue Service
The Internal Revenue Service is the revenue service of the United States federal government. The agency is a bureau of the Department of the Treasury, and is under the immediate direction of the Commissioner of Internal Revenue...
indicate that income inequality among households has been increasing significantly since the late 1970s
History of the United States (1945–1964)
For the United States, 1945 to 1964 was an era of economic growth and prosperity which saw the victorious powers of World War II confronting each other in the Cold War and the triumph of the Civil Rights Movement that ended Jim Crow segregation in the South....
,
after several decades of stability
Great Compression
The Great Compression refers to "a decade of extraordinary wage compression" in the United States in the early 1940s. During that time economic inequality as shown by wealth distribution and income distribution between the rich and poor became much smaller than it had been in preceding time periods...
. Inequality between male and female workers in the US has decreased considerably since 1953 but remains relatively large.
A CBO study in 2011 found that the top 1% of households gained about 275% over a period between 1979 and 2007, although this number has decreased somewhat since 2007 as a result of the Great Recession
Late-2000s financial crisis
The late-2000s financial crisis is considered by many economists to be the worst financial crisis since the Great Depression of the 1930s...
. The increase is far above other income levels, especially the bottom 80%, whose share of national income growth declined over this period.
As of 2006, the United States had one of the highest levels of income inequality, as measured through the Gini index, among similar high income countries
First World
The concept of the First World first originated during the Cold War, where it was used to describe countries that were aligned with the United States. These countries were democratic and capitalistic. After the fall of the Soviet Union and the end of the Cold War, the term "First World" took on a...
or developed countries, being one of only a few developed countries
Developed country
A developed country is a country that has a high level of development according to some criteria. Which criteria, and which countries are classified as being developed, is a contentious issue...
where inequality has increased since 1980.
Scholars and others differ as the cause(s) and significance of the trend, which in 2011 helped ignite the "Occupy" protest movement
Occupy movement
The Occupy movement is an international protest movement which is primarily directed against economic and social inequality. The first Occupy protest to be widely covered was Occupy Wall Street in New York City, taking place on September 17, 2011...
. While education and increased demand for skilled labor is often cited as a cause of increased inequality, many social scientists, such as economists Paul Krugman
Paul Krugman
Paul Robin Krugman is an American economist, professor of Economics and International Affairs at the Woodrow Wilson School of Public and International Affairs at Princeton University, Centenary Professor at the London School of Economics, and an op-ed columnist for The New York Times...
and Timothy Smeeding and political scientists Larry Bartels
Larry Bartels
Larry Martin Bartels is an American political scientist.Bartels is the Co-Director of the Center for the Study of Democratic Institutions and Shayne Chair in Public Policy and Social Science at Vanderbilt University. He is formerly the Donald E...
and Nathan Kelly
Nathan Kelly
Nathan Kelly is an American composer in Los Angeles, best known for working as an orchestrator for Broadway productions such as Gypsy, Curtains, The Tony Awards, and Séance on a Wet Afternoon. His work has been eclectic, orchestrating many different styles of music...
, point to public policy and partisan politics as an important cause of inequality.
History
Concentration of income in America has varied throughout its history. Nobel laureate economist Paul Krugman and others point to several eras of differing levels of inequality from the post-civil war era ("the Gilded AgeGilded Age
In United States history, the Gilded Age refers to the era of rapid economic and population growth in the United States during the post–Civil War and post-Reconstruction eras of the late 19th century. The term "Gilded Age" was coined by Mark Twain and Charles Dudley Warner in their book The Gilded...
") to present. Krugman argues that in modern American history there has been a great "economic arc from high inequality to relative equality and back again." In 1915, an era in which the Rockefellers and Carnegies dominated American industry, the richest 1% of Americans earned roughly 18% of all income. Today, the top 1% account for 24% of all income. From 1870 to sometime around 1937 inequality was quite high, but from about 1937 to 1947 inequality dropped dramatically -- a period dubbed "the the Great Compression
Great Compression
The Great Compression refers to "a decade of extraordinary wage compression" in the United States in the early 1940s. During that time economic inequality as shown by wealth distribution and income distribution between the rich and poor became much smaller than it had been in preceding time periods...
", Brought on by highly progressive New Deal taxation, the strengthening of unions, and regulation of the National War Labor Board during World War II. This relatively low level of inequality remained fairly steady for about three decades until the late 1970s when income again began to become more concentrated. Krugman refers to this period after 1979 as the “Great Divergence.” Inequality increased during the 1980s, decreased slightly during the late 1990s and has since continued its overall increasing trend.
Indicators
Household income in the United States
Household income is a measure commonly used by the United States government and private institutions, that counts the income of all residents over the age of 18 in each household, including not only all wages and salaries, but such items as unemployment insurance, disability payments, child support...
or individual
Personal income in the United States
Personal income is an individual’s total earnings from wages, investment interest, and other sources. In the United States the most widely cited personal income statistics are the Bureau of Economic Analysis’s personal income and the Census Bureau’s per capita money income...
— has become increasingly unequal in the last three decades or so. In 2010, the top 20% of Americans earned 49.4% of the nation’s income, compared with the 3.4% earned by Americans living below the poverty line (roughly 15% of the population). This earnings ratio of 14.5 to 1 was an increase from the 13.6 to 1 ratio in 2008 and a significant rise from the historic low of 7.69 to 1 in 1968.
The 2011 Congressional Budget Office
Congressional Budget Office
The Congressional Budget Office is a federal agency within the legislative branch of the United States government that provides economic data to Congress....
report found the following with respect to indicators: Real household income in the U.S. grew by 62% between 1979 and 2007. However, after-tax income of households in the top 1% of earners grew by 275%, while income growth for the bottom fifth of earners was 18%. “As a result of that uneven income growth," the report notes, "the share of total after-tax income received by the 1 percent of the population in households with the highest income more than doubled between 1979 and 2007, whereas the share received by low- and middle-income households declined … The share of income received by the top 1 percent grew from about 8 percent in 1979 to over 17 percent in 2007. The share received by other households in the highest income quintile (one-fifth of the population as divided by income) was fairly flat over the same period, edging up from 35 percent to 36 percent.”
However, it should be noted that the people or households in the quintile may change over time, some falling into lower quintiles, and being replaced by those rising.
According to economist Janet Yellen
Janet Yellen
Janet Louise Yellen is an American economist and professor, who is currently the Vice Chair of the Board of Governors of the Federal Reserve System...
"the growth [in real income] was heavily concentrated at the very tip of the top, that is, the top 1 percent." A 2006 analysis of IRS income data by economists Emmanuel Saez at the University of California, Berkeley
University of California, Berkeley
The University of California, Berkeley , is a teaching and research university established in 1868 and located in Berkeley, California, USA...
and Thomas Piketty at the Paris School of Economics
Paris School of Economics
The Paris School of Economics , created on 21 December 2006 in Paris, France, is a French economics department. The EEP combines researchers from several institutions, including DELTA and INRA...
showed that the share of income held by the top 1% was as large in 2005 as in 1928. The data revealed that reported income increased by 9% in 2005, with the mean for the top 1% increasing by 14% and that for the bottom 90% dropping slightly by 0.6%.
A study done by University of Texas economists James K. Galbraith and Travis Hale titled "Income Distribution and the Information Technology Bubble" found that during the technology boom of the late 1990's, most of the gains enjoyed by the top 1% came from a small number of counties, rather than a national trend. Almost all of the richest 1%'s gains occurred in the economic hotbeds of Silicon Valley
Silicon Valley
Silicon Valley is a term which refers to the southern part of the San Francisco Bay Area in Northern California in the United States. The region is home to many of the world's largest technology corporations...
, and also New York City. If the top four counties in those regions are removed, there is almost no trend towards income inequality during the years studied (1994-2000). On this basis, the researchers ascribe the growth in income inequality in the late 1990's to the growth of information technology. However, the study was done prior to the "dot com bubble" collapse where Technology-heavy NASDAQ Composite Index fell from a peak of 5,048.62 to a low 1,695.37.
Between 1979 and 2005, the mean after-tax income for the top 1% increased by 176%, compared to an increase of 69% for the top quintile overall, 20% for the fourth quintile, 21% for the middle quintile, 17% for the second quintile and 6% for the bottom quintile. For the same time span the aggregate share of after-tax income held by the top percentile increased from 7.5% to 14%. Economist Timothy Smeeding summed up the current trend of rising inequality on the pages of the Social Science Quarterly:
Household income
Standard of living in the United States
The standard of living in the United States is one of the top 20 in the world by the standards economists use as measures of standards of living. Per capita income is high but also less evenly distributed than in most other developed countries; as a result, the United States fares particularly well...
as it does not consider household size. As of 2005, 42% of all U.S. households and 76% of those in the top quintile had two or more income earner
Income earner
Income earner refers to an individual who through work, investments or a combination of both derives income, which has a fixed and very fixed value of his/her income...
s.
A 2004 analysis of income quintile data by the Heritage Foundation
Heritage Foundation
The Heritage Foundation is a conservative American think tank based in Washington, D.C. Heritage's stated mission is to "formulate and promote conservative public policies based on the principles of free enterprise, limited government, individual freedom, traditional American values, and a strong...
stated that the aggregate share of income held by the upper quintile (the top earning 20%) decreases by 20.3% when figures are adjusted to reflect household size.
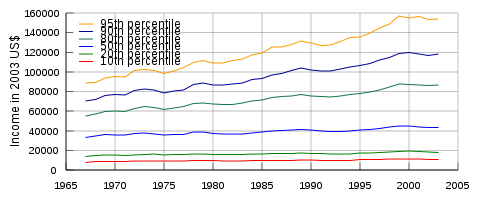
| Data | Total gain | Percent gain | 2003 | 2000 | 1997 | 1994 | 1991 | 1988 | 1985 | 1982 | 1979 | 1976 | 1973 | 1970 | 1967 |
|---|---|---|---|---|---|---|---|---|---|---|---|---|---|---|---|
| 20th percentile | $3,982 | 28.4% | $17,984 | $19,142 | $17,601 | $16,484 | $16,580 | $17,006 | $16,306 | $15,548 | $16,457 | $15,615 | $15,844 | $15,126 | $14,002 |
| Median (50th) | $9,980 | 29.9% | $43,318 | $44,853 | $42,294 | $39,613 | $39,679 | $40,678 | $38,510 | $36,811 | $38,649 | $36,155 | $37,700 | $35,832 | $33,338 |
| 80th percentile | $34,602 | 62.6% | $86,867 | $87,341 | $81,719 | $77,154 | $74,759 | $75,593 | $71,433 | $66,920 | $68,318 | $63,247 | $64,500 | $60,148 | $55,265 |
| 95th percentile | $65,442 | 73.8% | $154,120 | $155,121 | $144,636 | $134,835 | $126,969 | $127,958 | $119,459 | $111,516 | $111,445 | $100,839 | $102,243 | $95,090 | $88,678 |
| SOURCE: U.S. Census Bureau, 2004 (Page 44/45) | |||||||||||||||
Personal income
Personal income represents the earnings of individuals and, therefore, directly reflects occupational status, achievement and educational attainment. While many, though not the majority, of income earners reside in households with more than one income earner, trends in personal income are more indicative of the job market and the economy than household income.During the early 1920s, median earnings decreased for both sexes, not increasing substantially until the late 1990s. Since 1974 the median income for workers of both sexes increased by 31.7% from $18,474 to $24,325, reaching its high-point in 2000. Income inequality has increased considerably as well with the top 1% receiving much larger gains than all other demographics. This group has pulled ahead of other income earners including the remainder of the top 10% considerably during the past few years.
According to Gini index data income inequality among all workers with incomes increased by roughly 20% since 1967. Both increasing median income, largely connected to an increase in educational attainment, and income inequality with the very top earners gaining a larger share has characterized personal income trends during the past thirty or so years.
Wage inequality
Gini index
One of the most commonly used measures of income inequality is the Gini indexGini coefficient
The Gini coefficient is a measure of statistical dispersion developed by the Italian statistician and sociologist Corrado Gini and published in his 1912 paper "Variability and Mutability" ....
or coefficient, which measures inequality on a scale from 0 to 1 -- where 0 represents perfect equality with everyone having exactly the same income, and 1 represents perfect inequality with one person having all income. Index scores are commonly multiplied by 100 to make them easier to understand.
Since the Census Bureau started measuring the Gini coefficient in 1967, it has risen by 20% for full-time workers and 18% for households. Among households, the index has risen from 39.7 to 46.9, from 31.4 to 42.4 among men and from 29.8 to 35.7 among women.
| Gini index, Persons, age 25+, employed full-time | Gini index, Households | ||||||||||
|---|---|---|---|---|---|---|---|---|---|---|---|
| Men | Women | Both sexes | |||||||||
| 1967 | 2005 | Increase | 1967 | 2005 | Increase | 1967 | 2005 | Increase | 1967 | 2005 | Increase |
| 31.4 | 42.4 | 35.0% | 29.8 | 35.7 | 19.8% | 34.0 | 40.9 | 20.3% | 39.7 | 46.9 | 18.1% |
| SOURCE: U.S. Census Bureau, 2006 | |||||||||||
Gini index ratings are often used to compare inequality in countries. Recent ratings provided by the UN range from 24.7 in Denmark
Denmark
Denmark is a Scandinavian country in Northern Europe. The countries of Denmark and Greenland, as well as the Faroe Islands, constitute the Kingdom of Denmark . It is the southernmost of the Nordic countries, southwest of Sweden and south of Norway, and bordered to the south by Germany. Denmark...
to 74.3 in Namibia
Namibia
Namibia, officially the Republic of Namibia , is a country in southern Africa whose western border is the Atlantic Ocean. It shares land borders with Angola and Zambia to the north, Botswana to the east and South Africa to the south and east. It gained independence from South Africa on 21 March...
, while the most recent CIA World Factbook ratings range from 23 (Sweden
Sweden
Sweden , officially the Kingdom of Sweden , is a Nordic country on the Scandinavian Peninsula in Northern Europe. Sweden borders with Norway and Finland and is connected to Denmark by a bridge-tunnel across the Öresund....
) to 70.7 (Namibia). According to Gini coefficient data, income inequality in the U.S., was already among the highest in the post-industrial world, before its rise from 1967 and 2005 among households and individuals. Most post-industrial nations are in the lower, more equal, end of the spectrum, with a Gini coefficient in the high twenties to mid thirties. In 2005 the Gini index for the EU was estimated at 31. America's is at the higher end, rated 40 or 45. (Factbook estimates the US Gini index at 45, 95th in equality out of 134 countries studied and rated; the UN estimates it at 40, placing it 32nd out of 39 countries it rated.
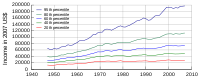
As the chart below demonstrates, inequality of income in some countries has increased steadily (China and the US); in others changed little (Belgium, Canada, Germany, Japan, and Sweden); and in others declined significantly (France, Italy, Mexico, and Norway).
Race and gender disparities
Despite considerable progress in pursuing gender and racial equality, some social scientists attribute these discrepancies in income to continued discrimination. Others argue that the majority of the wage gap is due to women's choices and preferences. Women are more likely to consider factors other than salary when looking for employment. On average, women are less willing to travel or relocate, take more hours off and work fewer hours, and choose college majors that lead to lower paying jobs. Women are also more likely to work for governments or non-profits, that pay less than the private sector. According to this perspective certain ethnic minorities and women receive fewer promotions and opportunities for occupation and economic advancement than others. In the case of women this concept is referred to as the glass ceiling
Glass ceiling
In economics, the term glass ceiling refers to "the unseen, yet unbreachable barrier that keeps minorities and women from rising to the upper rungs of the corporate ladder, regardless of their qualifications or achievements." Initially, the metaphor applied to barriers in the careers of women but...
keeping women from climbing the occupational ladder. In terms of race, studies have shown that African Americans are less likely to be hired than European-Americans with the same qualifications. The continued prevalence of traditional gender roles and ethnic stereotypes may partially account for current levels of discrimination. In 2005, median income levels were highest among Asian and White males and lowest among females of all races, especially those identifying as African American or Hispanic. Despite closing gender and racial gaps, considerable discrepancies remain among racial and gender demographics, even at the same level of educational attainment.
Since 1953 the income gap between male and female workers has decreased considerably but remains relatively large. Women currently earn significantly more Associate's, Bachelor's, and Master's degrees than men and almost as many Doctorates. Women are projected to have passed men in Doctorates earned in 2006–2007, and to earn nearly two thirds of Associate's, Bachelor's, and Master's degrees by 2016. Despite this, some still argue that male workers still hold higher educational attainment, as the success of women in academia is a relatively new phenomenon. Though it is important to note that income inequality between sexes remained stark at all levels of educational attainment. Between 1953 and 2005 median earnings as well as educational attainment increased, at a far greater pace for women than for men. Median income for male earners increased by 36.2% versus 157.2% among female earners. This means that the median income of women rose 334.5% as fast as that of men. The extent by which men out-earned women reduced by 61.2%, indicating increased gender equality. Today the median male worker earns roughly 68.36% more than their female counterparts, compared to 176.25% in 1953. Furthermore income has increased more or less continuously for women, while the median earning for men have shown some fluctuation and stagnation since the early 1970s. The median income of men in 2005 was 2% higher than in 1973 compared to a 74.6% increase for female earners. Racial differences remained stark as well, with the highest earning sex-gender demographic of workers aged 25 or older, Asian males (who were roughly tied with white males) earning more than twice, 109.7%, as much as the lowest-earning demographic, Hispanic females. As mentioned above, inequality between races and gender persisted at similar education levels. In 2005, Asian men, age 25+, with a Bachelor's degree or higher
Bachelor's degree or higher
Bachelor's degree or higher is a commonly used term by the United States Census Bureau and other U.S. government agencies on the federal as well as state and local level. The term describes the portion of the population that has either a bachelor's degree or a higher degree such as a master's or...
earned 203.8% more than Hispanic females (age 25+) with the same educational attainment. Racial differences were overall more pronounced among male than among female income earners.
| Demographic | Median personal income | |||||||
|---|---|---|---|---|---|---|---|---|
| Overall Median | High school graduate | Some college | Bachelor's degree or higher | Bachelor's degree | Masters degree | Doctorate degree | ||
| White | Male | $40,432 | $33,805 | $40,427 | $61,175 | $55,129 | $67,903 | $77,818 |
| Female | $26,636 | $21,306 | $25,190 | $40,161 | $36,076 | $45,555 | $56,759 | |
| Both sexes | $32,919 | $27,291 | $31,510 | $49,879 | $43,841 | $52,244 | $71,184 | |
| Black | Male | $30,549 | $25,747 | $32,758 | $46,474 | $41,889 | $52,488 | N/A |
| Female | $25,435 | $20,366 | $25,574 | $42,461 | $41,263 | $45,830 | |N/A | |
| Both sexes | $27,110 | $22,328 | $27,589 | $44,460 | $41,565 | $47,407 | $61,993 | |
| Asian | Male | $42,217 | $28,486 | $34,548 | $61,165 | $51,448 | $70,979 | $81,676 |
| Female | $30,332 | $21,057 | 23,523 | $41,442 | $37,057 | $48,177 | $53,659 | |
| Both sexes | $36,152 | $25,285 | $29,982 | $51,481 | $42,466 | $61,452 | $69,653 | |
| Hispanic | Male | $26,162 | $26,579 | $33,617 | $48,282 | $43,791 | $60,194 | N/A |
| Female | $20,133 | $18,886 | $25,088 | $37,405 | $34,302 | $47,052 | N/A | |
| Both sexes | $23,613 | $22,941 | $28,698 | $41,596 | $37,819 | $50,901 | $67,274 | |
| All racial/ethnic demographics | Male | $39,403 | $32,085 | $39,150 | $60,493 | $52,265 | $67,123 | $78,324 |
| Female | $26,507 | $21,117 | $25,185 | $40,483 | $36,532 | $45,730 | $54,666 | |
| Both sexes | $32,140 | $26,505 | $31,054 | $49,303 | $43,143 | $52,390 | $70,853 | |
| NOTE: The highest median for each level of educational attainment is highlighted in green, the lowest in orange. | ||||||||
SOURCE: US Bureau of Census , 2006 |
||||||||
Economic
There are several hypotheses as to why income inequality has gotten worse in the United States. Some conflicting, some overlapping. They include:- the globalization hypothesis -- that low skilled American workers were losing ground in the face of competition from low-wage workers in Asia and other "emerging" economies;
- the skill-biased technological change, -- that the rapid pace of progress in information technology, increased the demand for the highly skilled and educated so that income distribution favored brains rather than brawn; and
- the superstar hypothesis (named by the Chicago economist Sherwin RosenSherwin RosenSherwin Rosen was an American labor economist. He had ties with many American universities and academic institutions including the University of Chicago, the University of Rochester, Stanford University and its Hoover Institution. At the time of his death, Rosen was Edwin A. and Betty L...
) -- that argued that modern technologies of communication often turn competition into a tournament in which the winner is richly rewarded, while the runners-up get far less than in the past (an example being the passing of the hundreds of comedians that made a modest living at live shows in the borscht belt and other places in bygone days that have been replaced by a handful of superstar TV comedians.) - immigration of less-educated workers, which may have reduced wages for high school dropouts by 5% according to George Borjas
According to Economist Paul Krugman
Paul Krugman
Paul Robin Krugman is an American economist, professor of Economics and International Affairs at the Woodrow Wilson School of Public and International Affairs at Princeton University, Centenary Professor at the London School of Economics, and an op-ed columnist for The New York Times...
these hypotheses came to be found "increasingly inadequate" as more evidence accumulated.
Globalization can explain part of the relative decline in blue-collar wages, but it can't explain the 2,500 percent rise in C.E.O. incomes. Technology may explain why the salary premium associated with a college education has risen, but it's hard to match up with the huge increase in inequality among the college-educated, with little progress for many but gigantic gains at the top. The superstar theory works for Jay LenoJay LenoJames Douglas Muir "Jay" Leno is an American stand-up comedian and television host.From 1992 to 2009, Leno was the host of NBC's The Tonight Show with Jay Leno. Beginning in September 2009, Leno started a primetime talk show, titled The Jay Leno Show, which aired weeknights at 10:00 p.m. ,...
, but not for the thousands of people who have become awesomely rich without going on TV.
Immigration was also criticized as weak or insufficient to explain the change.
Other scholars (such as political scientists Jacob S. Hacker and Paul Pierson
Paul Pierson
Paul Pierson is a professor of political science and holder of the Avice Saint Chair of Public Policy at the University of California, Berkeley. From 2007-2010 he served at UC Berkeley as Chair of the Department of Political Science...
) examining the issue also questioned the explanation of educational achievements and workplace skills. Other countries of similar education levels and economies have not gone the way of the US, and the growth in inequality hasn't followed a pattern of "the 29% of Americans with college degrees pulling away" from those who have less education.
Political, normative, institutional
While education and increased demand for skilled labor is often cited as a cause of increased inequality, many social scientists, such as economists Paul Krugman and Timothy Smeeding and political scientists Larry BartelsLarry Bartels
Larry Martin Bartels is an American political scientist.Bartels is the Co-Director of the Center for the Study of Democratic Institutions and Shayne Chair in Public Policy and Social Science at Vanderbilt University. He is formerly the Donald E...
and Nathan Kelly, point to public policy and partisan politics as an important cause of inequality. They point out that education, labor force, and demographic changes cannot be the sole cause of the widening gap between the rich and the poor, and that the U.S. is unique in having experienced such a rise in inequality – a trend that, if caused by education, labor force, and demographic factors, would have manifested itself in other developed nations.
The diminishing political clout of labor unions, resulting from declining union membership rates, and less government redistribution as well as decreased expenditure on social services are commonly cited as the main causes of this trend.
Federal taxes (personal income tax, payroll tax, gift and estate tax, etc.) and transfers (Social Security, Unemployment Insurance, etc.), reduced inequality by 20% in 2007 according to the CBO
CBO
CBO is a three letter abbreviation which may mean:* CBO-FM, a CBC Radio One station in Ottawa, Ontario, Canada* Central Bank of Oman* Central Boycott Office, a specialized agency of the Arab League based in Damascus...
-- while in 1979 they reduced it by an even larger amount.
In addition, there is strong evidence that the party of the president and the ideological content of public policy have powerfully shaped the path of income inequality over time. While expertise, productiveness and work experience, inheritance, gender, and race had a strong influence on personal income, household income was largely affected by the number of income earners, contributing to inequality between households based on the number of earners in them. Yet, other causes for income inequality, especially some of those behind its recent rise, likely remain unknown.
There is some debate in the political and academic spheres over the roll of tax policy changes over the last thirty years contributing to income inequality. Economists such as Paul Krugman
Paul Krugman
Paul Robin Krugman is an American economist, professor of Economics and International Affairs at the Woodrow Wilson School of Public and International Affairs at Princeton University, Centenary Professor at the London School of Economics, and an op-ed columnist for The New York Times...
argue that policies such as the Bush Tax Cuts
Bush tax cuts
The Bush tax cuts refers to changes to the United States tax code passed during the presidency of George W. Bush and extended during the presidency of Barack Obama that generally lowered tax rates and revised the code specifying taxation in the United States...
have increased income inequality by letting the rich keep a greater amount of their wealth relative to poorer people.
Skill-biased technological change
As of the mid to late decade of the 2000s, many wealthy conservative Americans agree this was the most common explanation for income inequality in America. Most left or progressive Americans feel that this is a minor cause, compared to changes in taxation over the decades from 1980 to 2010.Education
Income differences between the varying levels of educational attainment have increased. Expertise and skill certified through an academic degree increases compensation including income. Increased certified expertise translates into increased scarcity of an individual's occupational qualification which in turn leads to greater economic rewards. As the United States has developed into a post-industrial societyPost-industrial society
If a nation becomes "post-industrial" it passes through, or dodges, a phase of society predominated by a manufacturing-based economy and moves on to a structure of society based on the provision of information, innovation, finance, and services.-Characteristics:...
education attainment
Educational attainment in the United States
The educational attainment of the U.S. population is similar to that of many other industrialized countries with the vast majority of the population having completed secondary education and a rising number of college graduates that outnumber high school dropouts. As a whole, the population of the...
(usually measured by the highest degree of education an individual has completed) has gained importance. More and more employers require expertise that they did not a generation ago, while the manufacturing sector which employed many of those lacking a post-secondary education is decreasing in size.
The resulting economic job market may be referred to as constituting a "two-tier" labor market. In this market the income discrepancy between the professional and working class may be growing. Sociologists such as Dennis Gilbert refer to the professional class as a privileged class due to its favorable disposition in the two-tier labor market. Income gains and median levels were higher among those with the higher academic degrees, that is those who possess scarce amounts of certified expertise. In other words, higher educational attainment translates into higher personal income levels and larger income increases over time.The benefits of education are worth the time and effort, especially when considering the high “return” rates of personal income. By examining the “return” to a year of school, income can be determined for each year invested in education. For instance, the equation for “return” to a year of school, say for the 11th grade year is = (income for 11th grade – income for 10th grade)/income for 10th grade. Generally, this implies that more time invested each year in education results in higher income because of increased human capital.
While the higher education commonly translates into higher income, and the highly educated tend to reside in upper quintile households
Affluence in the United States
Affluence in the United States refers to an individual's or household's state of being in an economically favorable position in contrast to a given reference group...
, differences in educational attainment fail to explain income discrepancies between the top 1% and the rest of the population. Large percentages of individuals lacking a college degree
Bachelor's degree or higher
Bachelor's degree or higher is a commonly used term by the United States Census Bureau and other U.S. government agencies on the federal as well as state and local level. The term describes the portion of the population that has either a bachelor's degree or a higher degree such as a master's or...
are present in all income demographics, including 33% of those with heading households with six figure incomes
Affluence in the United States
Affluence in the United States refers to an individual's or household's state of being in an economically favorable position in contrast to a given reference group...
. In 2005, roughly 55% of income earners with doctorate degrees, the most educated 1.4%, were among the top 15% earners. Among those with Masters degrees, the most educated 10%, roughly half had incomes among the top 20% of earners. Only among households in the top quintile were householders with college degrees in the majority. While discrepancies in educational attainment cannot account for all aspects of income inequality, education remains one of the strongest influences on income distribution, thereby affecting income inequality. From 2000 to 2010, the 1.5% of Americans with an M.D., J.D., or M.B.A. and the 1.5% with a PhD saw gains of approximately 5%. Among those with a college or master’s degree (about 25% of the American workforce) average wages dropped by about 7 percent, and wages dropped even more for those who had not completed college.
| Demographic | High school graduate | Some college | Bachelor's degree or higher Bachelor's degree or higher Bachelor's degree or higher is a commonly used term by the United States Census Bureau and other U.S. government agencies on the federal as well as state and local level. The term describes the portion of the population that has either a bachelor's degree or a higher degree such as a master's or... |
Bachelor's degree Bachelor's degree A bachelor's degree is usually an academic degree awarded for an undergraduate course or major that generally lasts for three or four years, but can range anywhere from two to six years depending on the region of the world... |
Master's degree | First professional degree First professional degree A professional degree prepares the holder for a particular profession by emphasizing competency skills along with theory and analysis. These professions are typically licensed or otherwise regulated by a governmental or government-approved body... |
Doctorate degree | ||||||||
|---|---|---|---|---|---|---|---|---|---|---|---|---|---|---|---|
| Median | % +/- national median | Median | % +/- national median | Median | % +/- national median | Median | % +/- national median | Median | % +/- national median | Median | % +/- national median | Median | % +/- national median | ||
| Persons, age 25+ w/ earnings (2005) |
Both sexes | $26,505 | −17.5% | $31,054 | −3.5% | $49,303 | $43,143 | $52,390 | $82,473 | $70,853 | |||||
| Males | $32,085 | −18.6% | $39,150 | −0.6% | $60,493 | $52,265 | $67,123 | $100,000 | $78,324 | ||||||
| Females | $21,117 | −20.3% | $25,185 | −5.0% | $40,483 | $36,532 | $45,730 | $66,055 | $54,666 | ||||||
| Both sexes employed full-time | $31,539 | −19.8% | $37,135 | −5.6% | $56,078 | $50,944 | $61,273 | $100,000 | $79,401 | ||||||
| Households (2003) |
$36,835 | −20.5% | $45,854 | −0.8% | $73,446 | $68,728 | $78,541 | $100,000 | $96,830 | ||||||
| SOURCE: US Census Bureau, 2004/06 | |||||||||||||||
While the returns to education increased considerably in the United States since the 1980s, it has not increased as much in many European countries such as Germany, France or the United Kingdom . The reasons for this discrepancy in inequality trends between Europe and the United States is still the subject of much debate but one study suggests that tight regulations of labor markets in Europe could have prevented the returns to education from rising there as much as in the United States, but at the expense of creating unemployment .
Automation
The replacement by automation not only of routine, lower-skill employment but jobs at high skill levels should have an effect of inequality. The resulting stagnant or falling wages for most workers and a shift of income from labor to capitalCapital
A capital city is the area of a country, province, region, or state considered to enjoy primary status; although there are exceptions, a capital is typically a city that physically encompasses the offices and meeting places of the seat of government and is usually fixed by law or by the constitution...
, may increase the concentration of income and wealth by the owners of capital.
Politics, norms, institutions
Krugman, Hacker, Pierson, and others believe the true cause of the inequality trend to be political rather than purely economic:The development of a modern efficient political system, especially lobbying
Lobbying
Lobbying is the act of attempting to influence decisions made by officials in the government, most often legislators or members of regulatory agencies. Lobbying is done by various people or groups, from private-sector individuals or corporations, fellow legislators or government officials, or...
, by top earnersand particularly corporate executives and the financial services industry. According to political scientists Jacob Hacker and Paul Pierson writing in the book Winner-Take-All Politics
Winner-Take-All Politics (book)
Winner-Take-All Politics: How Washington Made the Rich Richer--and Turned Its Back on the Middle Class is a book by political scientists Jacob S. Hacker and Paul Pierson...
, the end of the 1970s saw a transformation of American politics away from a focus on the middle class, with new, much more effective, aggressive and well-financed lobbyists and pressure groups acting on behalf of upper income groups. Executives successfully eliminated any countervailing power or oversight of corporate managers (from private litigation, boards of directors and shareholders, the Securities and Exchange Commission or labor unions). The financial industry's success came from successfully pushing for deregulation of financial markets, allowing much more lucrative but much more risky investments from which it privatized the gains while socializing the losses with government bailouts. (the two groups formed about 60% of the top 0.1% of taxpayers.) All top earners were helped by deep cuts in estate and capital gains taxes, and tax rates on high levels of income.
In addition to politics, Krugman postulated change in norms of corporate culture have played a factor. While corporate executives had (or could develop) the ability to pay themselves very high compensation through control of corporate boards of directors, they restrained themselves. The New Deal
New Deal
The New Deal was a series of economic programs implemented in the United States between 1933 and 1936. They were passed by the U.S. Congress during the first term of President Franklin D. Roosevelt. The programs were Roosevelt's responses to the Great Depression, and focused on what historians call...
imposed norms of relative equality in pay and executives followed those norms for more than 30 years, but in the late 1970s there was a "relaxation of old strictures, a new permissiveness", in American management akin to the sexual revolution
Sexual revolution
The sexual revolution was a social movement that challenged traditional codes of behavior related to sexuality and interpersonal relationships throughout the Western world from the 1960s into the 1980s...
of the 1960's. "By the end of the 1990's, the executive motto might as well have been If it feels good, do it," and the average real annual compensation of the top 100 C.E.O.'s skyrocketed from $1.3 million -- 39 times the pay of an average worker -- to $37.5 million, more than 1,000 times the pay of ordinary workers from 1982to 2002. Journalist George Packer, writing in Foreign Affairs
Foreign Affairs
Foreign Affairs is an American magazine and website on international relations and U.S. foreign policy published since 1922 by the Council on Foreign Relations six times annually...
magazine, also sees the dramatic increase in inequality in America as a product of the change in attitude of the American elite, which (in his view) has been transitioning itself from pillars of society to a special interest group.
Political parties and presidents
Larry Bartels, a Princeton political scientist, looked at average annual pre-tax income growth from 1948 to 2005, His calculations showed that under Democratic presidents from Harry Truman forward the greatest income gains have been at the bottom of the income scale and tapered off as you went up, while under Republican presidents the greatest income gains have been at the top and tapered off as you went down the income scale. Income growth overall was greater under Democratic presidents than Republicans.Journalist Timothy Noah in the series “The United States of Inequality” summarized Bartels's findings referring to the administrations of Democratic presidents as "Democrat-world", and GOP administrations as "Republican-world":
The pattern of distribution of growth appears to be the result of a whole host of policies,
including not only the distribution of taxes and benefits but also the government's stance toward unions, whether the minimum wage rises, the extent to which the government frets about inflation versus too-high interest rates, etc., etc.
Taxation
Income-tax policy has been cited as one of several factors that contributed to inequality. Several economists have demonstrated that income inequality has grown more rapidly under Republican administrations than under Democratic administrations. A study by Thomas Piketty and Emmanuel Saez found thatLarge reductions in tax progressivity since the 1960s took place primarily during two periods: the Reagan presidency in the 1980s and the Bush administration in the early 2000s.
During Republican President Ronald Reagan's tenure in office the top marginal income tax rate was reduced from over 70 to 28 percent, high top marginal rates like 70% being the sort in place during much of the period of great income equality following the “Great Compression”.
Progressivity
Progressive tax
A progressive tax is a tax by which the tax rate increases as the taxable base amount increases. "Progressive" describes a distribution effect on income or expenditure, referring to the way the rate progresses from low to high, where the average tax rate is less than the marginal tax rate...
of income tax and the (effective) rate at which income is taxed
Income tax
An income tax is a tax levied on the income of individuals or businesses . Various income tax systems exist, with varying degrees of tax incidence. Income taxation can be progressive, proportional, or regressive. When the tax is levied on the income of companies, it is often called a corporate...
can have an effect on equality.
A progressive tax
Progressive tax
A progressive tax is a tax by which the tax rate increases as the taxable base amount increases. "Progressive" describes a distribution effect on income or expenditure, referring to the way the rate progresses from low to high, where the average tax rate is less than the marginal tax rate...
is a tax by which the tax rate increases as the taxable base amount increases. In a progressive tax system, the level of the top tax rate will have a direct impact on the level of inequality within a society, either increasing it or decreasing it. Additionally, a steeper progressivity results in an even more equal distribution of income across the board. The difference between the Gini index for an income distribution before taxation and the Gini index after taxation is an indicator for the effects of such taxation. Overall income tax rates in the United States are below the OECD
Organisation for Economic Co-operation and Development
The Organisation for Economic Co-operation and Development is an international economic organisation of 34 countries founded in 1961 to stimulate economic progress and world trade...
average.
Incentives
American lower class
The concept of a lower class in the United States is used to describe those at or near the lower end of the socio-economic hierarchy. As with all social classes in the United States, the lower class is loosely defined and its boundaries and definitions subject to debate and ambiguous popular...
, the most common source of income was not occupation, but government welfare.
As expected, households in the upper quintiles are generally home to more, better educated and employed working income earners, than those in lower quintiles. Among those in the upper quintile, 62% of householders were college graduates, 80% worked full-time and 76% of households had two or more income earners, compared to the national percentages of 27%, 58% and 42%, respectively. Upper-most sphere US Census Bureau data indicated that occupational achievement and the possession of scarce skills correlates with higher income.
Significance of inequality
The growth of inequality has provoked a political protest movement -- the Occupy movementOccupy movement
The Occupy movement is an international protest movement which is primarily directed against economic and social inequality. The first Occupy protest to be widely covered was Occupy Wall Street in New York City, taking place on September 17, 2011...
-- starting in Wall Street and spreading to 600 communities across the United States. Its main political slogan is "We are the 99%", references its dissatisfaction with the concentration of income in the top 1%.
Commentators, economists, politicians do not agree on the issue or its importance. Some have argued that the increase in inequality in America is highly undesirable -- unjust, a danger to democracy/social stability, and/or even a sign of national decline. Others have claimed that the increase is not significant and an excuse for "class-warfare rhetoric", that its created a divide between the educated and the less educated, or that it doesn't matter, because America's economic growth and/or equality of opportunity are what's important.
Impact on democracy and stability
Economists Jared Bernstein and Paul Krugman have attacked the concentration of income as variously "unsustainable" and "incompatible" with real democracy. Political Scientist Jacob S. Hacker and Paul PiersonPaul Pierson
Paul Pierson is a professor of political science and holder of the Avice Saint Chair of Public Policy at the University of California, Berkeley. From 2007-2010 he served at UC Berkeley as Chair of the Department of Political Science...
writing on the "Great Divergence" of income in America, quote a warning by Greek/Roman historian Plutarch
Plutarch
Plutarch then named, on his becoming a Roman citizen, Lucius Mestrius Plutarchus , c. 46 – 120 AD, was a Greek historian, biographer, essayist, and Middle Platonist known primarily for his Parallel Lives and Moralia...
: `An imbalance between rich and poor is the oldest and most fatal ailment of all republics.`
In the words of journalist George Packer,
Inequality hardens society into a class system ... Inequality divides us from one another in schools, in neighborhoods, at work, on airplanes, in hospitals, in what we eat, in the condition of our bodies, in what we think, in our children's futures, in how we die. Inequality makes it harder to imagine the lives of others.
Social mobility
Some from the conservative and libertarian camps, such as economist Thomas SowellThomas Sowell
Thomas Sowell is an American economist, social theorist, political philosopher, and author. A National Humanities Medal winner, he advocates laissez-faire economics and writes from a libertarian perspective...
, and Congressman Paul Ryan (R., Wisc.) say that the United States redeems its disproportionate income inequality, relative to western Europe, by offering greater equality of opportunity.
Sowell suggests that many discussions of income equality ignore fluctuations in income and social mobility. He writes,
An absolute majority of the people who were in the bottom 20 percent [of income] in 1975 have also been in the top 20 percent at some time since then. Most Americans don't stay put in any income bracket. At different times, they are both "rich" and "poor" -- as these terms are recklessly thrown around in the media. [...] There are of course some people who remain permanently in the bottom 20 percent. But such people constitute less than one percent of the American population, according to data published by the Federal Reserve Bank of Dallas in its 1995 annual report. Perhaps the intelligentsia and the politicians have been too busy waxing indignant to be bothered by anything so mundane as facts.
According to Thomas A. Garrett, studies examining quintiles of wealth levels may provide a misleading picture.
For example, a U.S. Treasury study of the period from 1996 to 2005 found that "[l]ess than half (40 percent or 43 percent depending on the measure) of those in the top 1 percent in 1996 were still in the top 1 percent in 2005. Only about 25 percent of the individuals in the top 1/100th percent in 1996 remained in the top 1/100th percent in 2005."
However others, such as economist Paul Krugman
Paul Krugman
Paul Robin Krugman is an American economist, professor of Economics and International Affairs at the Woodrow Wilson School of Public and International Affairs at Princeton University, Centenary Professor at the London School of Economics, and an op-ed columnist for The New York Times...
, argue that despite their "great ferocity in presenting its case and attacking its opponents", conservatives ignore public record on social mobility
Social mobility
Social mobility refers to the movement of people in a population from one social class or economic level to another. It typically refers to vertical mobility -- movement of individuals or groups up from one socio-economic level to another, often by changing jobs or marrying; but can also refer to...
statistics in the United States. Over the course of a person's lifetime, income rises and falls -- low during student years and the beginning of a career, or unemployment and job searching, rising to peak earnings of a career, and then down during retirement -- but this 'mobility' is not an appreciable part of the trend in income in equality and not the same as rising from poor to middle income, or from middle to upper income.
For example, CensusUnited States CensusThe United States Census is a decennial census mandated by the United States Constitution. The population is enumerated every 10 years and the results are used to allocate Congressional seats , electoral votes, and government program funding. The United States Census Bureau The United States Census...
data show that 81.6 percent of those families who were in the bottom quintile of the income distribution in 1985 were still in that bottom quintile the next year; for the top quintile the fraction was 76.3 percent. Over longer time periods, there is more mixing, but still not that much. Studies by the Urban InstituteUrban InstituteThe Urban Institute is a Washington, D.C.-based think tank that carries out nonpartisan economic and social policy research, collects data, evaluates social programs, educates the public on key domestic issues, and provides advice and technical assistance to developing governments abroad...
and the US Treasury have both found that about half of the families who start in either the top or the bottom quintile of the income distribution are still there after a decade, and that only 3 to 6 percent rise from bottom to top or fall from top to bottom.
Krugman argues claims of strong socio-economic mobility are contradicted by the 2011 Congressional Budget Office study on income inequality which says
Household income measured over a multi-year period is more equally distributed than income measured over one year, although only modestly so. Given the fairly substantial movement of households across income groups over time, it might seem that income measured over a number of years should be significantly more equally distributed than income measured over one year. However, much of the movement of households involves changes in income that are large enough to push households into different income groups but not large enough to greatly affect the overall distribution of income. Multi-year income measures also show the same pattern of increasing inequality over time as is observed in annual measures.
In other words, "many people who have incomes greater than $1 million one year fall out of the category the next year — but that’s typically because their income fell from, say, 1.05 million to 0.95 million, not because they went back to being middle class."
Another study (by Kopczuk, Saez and Song in 2007) found social/economic mobility in America at top income levels "very stable" and "not mitigated the dramatic increase in annual earnings concentration since the 1970s." Social/economic mobility declined significantly after World War II and has declined slightly from the 1970s.
Attitudes Toward Income Inequality
United States citizens are no more intolerant of income inequality than citizens of other nations, but the gap between what they think that people "should" earn and what they do earn is smaller than the average of most industrialized nations, even though the actual gap is the largest in the US. The reason they appear to be more tolerant is that they mistakenly think that there is less inequality in what people actually earn. In other words, Americans are no less egalitarian in their attitudes about their ideal world, but they are less accurate about the real world.Dan Ariely
Dan Ariely
Dan Ariely is an Israeli American professor of psychology and behavioral economics. He teaches at Duke University and is the founder of The Center for Advanced Hindsight.-Biography:...
and Michael Norton show in a study (2011) that US citizens across the political spectrum significantly underestimate the current US wealth inequality and would prefer a more egalitarian distribution of wealth, raising questions about ideological disputes over issues like taxation and welfare.
See also
- Tax Policy and Economic Inequality in the United StatesTax policy and economic inequality in the United StatesThe United States tax code in regard to income, capital gains, estate, and inheritance taxes, has undergone significant changes under both Republican and Democratic administrations and Congresses since 1964. The number of marginal income tax brackets has decreased while the spread within each tax...
- Economy of the United StatesEconomy of the United StatesThe economy of the United States is the world's largest national economy. Its nominal GDP was estimated to be nearly $14.5 trillion in 2010, approximately a quarter of nominal global GDP. The European Union has a larger collective economy, but is not a single nation...
- Educational attainment in the United StatesEducational attainment in the United StatesThe educational attainment of the U.S. population is similar to that of many other industrialized countries with the vast majority of the population having completed secondary education and a rising number of college graduates that outnumber high school dropouts. As a whole, the population of the...
- Homelessness in the United StatesHomelessness in the United StatesHomelessness in the United States has continued to remain a focus area of concern of social service providers, government officials, and policy professionals since its resurgence among many types of individuals and families. The number of homeless people further grew in the 1980s, as housing and...
- List of U.S. states by median income
- The Spirit Level: Why More Equal Societies Almost Always Do BetterThe Spirit Level: Why More Equal Societies Almost Always Do BetterThe Spirit Level: Why More Equal Societies Almost Always Do Better is a book by Richard G. Wilkinson and Kate Pickett, published in 2009 by Allen Lane. The book is published in the US by Bloomsbury Press with the new sub-title: Why Greater Equality Makes Societies Stronger...
(book) - We are the 99%
- Wealth inequality in the United StatesWealth inequality in the United StatesWealth inequality in the United States, also known as the "wealth gap", refers to the unequal distribution of financial assets among residents of the United States. Wealth includes the values of homes, automobiles, businesses, savings, and investments. Those who acquire a great deal of financial...
General:
- Economic inequalityEconomic inequalityEconomic inequality comprises all disparities in the distribution of economic assets and income. The term typically refers to inequality among individuals and groups within a society, but can also refer to inequality among countries. The issue of economic inequality is related to the ideas of...
- Economic mobilityEconomic mobilityEconomic mobility is the ability of an individual or family to improve their economic status, in relation to income and social status, within his or her lifetime or between generations...
- Racism in the United StatesRacism in the United StatesRacism in the United States has been a major issue since the colonial era and the slave era. Legally sanctioned racism imposed a heavy burden on Native Americans, African Americans, Asian Americans, and Latin Americans...
- Income inequality metricsIncome inequality metricsThe concept of inequality is distinct from that of poverty and fairness. Income inequality metrics or income distribution metrics are used by social scientists to measure the distribution of income, and economic inequality among the participants in a particular economy, such as that of a specific...
- Atkinson indexAtkinson indexThe Atkinson index is a measure of income inequality developed by British economist Anthony Barnes Atkinson...
- Gini coefficientGini coefficientThe Gini coefficient is a measure of statistical dispersion developed by the Italian statistician and sociologist Corrado Gini and published in his 1912 paper "Variability and Mutability" ....
- Hoover index
- Pareto distribution#Applications
- Theil indexTheil indexThe Theil index is a statistic used to measure economic inequality. It has also been used to measure the lack of racial diversity. The basic Theil index TT is the same as redundancy in information theory which is the maximum possible entropy of the data minus the observed entropy. It is a special...
- Atkinson index
- List of countries by income equality
- Median income per household memberMedian income per household memberThe median income per member of household is a measure used by statisticians and the US Census Bureau to determine the median income that exists in a household for each of its members. In order to obtain this number the median household income is divided by the median number of persons in...
- Social justiceSocial justiceSocial justice generally refers to the idea of creating a society or institution that is based on the principles of equality and solidarity, that understands and values human rights, and that recognizes the dignity of every human being. The term and modern concept of "social justice" was coined by...
External links
- The L-Curve: A Graph of the US Income Distribution
- Google – public data: GDP and Personal Income of the U.S. (annual)
- The United States of Inequality – a 10 part exposé and visual guide by Slate magazine
- Recent Trends in Household Wealth in the United States: Rising Debt and the Middle-Class Squeeze – by Dr. Edward Wolff
- The Great Divergence 2010: What's causing America's growing income inequality?, Timothy Noah, SlateSlate (magazine)Slate is a US-based English language online current affairs and culture magazine created in 1996 by former New Republic editor Michael Kinsley, initially under the ownership of Microsoft as part of MSN. On 21 December 2004 it was purchased by the Washington Post Company...
- Income Gap Widens: 2010 Census Finds Record Gap Between Rich And Poor by Hope Yen, AP
- It's the Inequality, Stupid: 11 Charts that Explain Everything that's Wrong with America – March 2011 issue of Mother JonesMother Jones (magazine)Mother Jones is an American independent news organization, featuring investigative and breaking news reporting on politics, the environment, human rights, and culture. Mother Jones has been nominated for 23 National Magazine Awards and has won six times, including for General Excellence in 2001,...