All Topics  
Gini coefficient


   Email Print
   Bookmark   Link


Gini coefficient


The Gini coefficient is a measure of statistical dispersion
Statistical dispersion

In statistics, statistical dispersion is variability or spread in a variable or a probability distribution. Common examples of measures of statistical dispersion are the variance, standard deviation and interquartile range....
 most prominently used as a measure of inequality of income distribution
Income inequality metrics

The concept of inequality is distinct from that of poverty and fairness. Income inequality metrics or income distribution metrics are used by social scientists to measure the distribution of income, and economic inequality among the participants in a particular economy, such as that of a specific country or of the world in general....
 or inequality of wealth distribution
Wealth condensation

Wealth condensation is a theoretical process by which, in certain conditions, newly-created wealth tends to become concentrated in the possession of already-wealthy individuals or entities, a form of preferential attachment....
. It is defined as a ratio
Ratio

A ratio is an expression which compares quantities relative to each other. The most common examples involve two quantities, but in theory any number of quantities can be compared....
 with values between 0 and 1: A low Gini coefficient indicates more equal income or wealth distribution, while a high Gini coefficient indicates more unequal distribution. 0 corresponds to perfect equality (everyone having exactly the same income) and 1 corresponds to perfect inequality (where one person has all the income, while everyone else has zero income).


Discussion
Ask a question about 'Gini coefficient'
Start a new discussion about 'Gini coefficient'
Answer questions from other users
Full Discussion Forum


Recent Posts


Encyclopedia


The Gini coefficient is a measure of statistical dispersion
Statistical dispersion

In statistics, statistical dispersion is variability or spread in a variable or a probability distribution. Common examples of measures of statistical dispersion are the variance, standard deviation and interquartile range....
 most prominently used as a measure of inequality of income distribution
Income inequality metrics

The concept of inequality is distinct from that of poverty and fairness. Income inequality metrics or income distribution metrics are used by social scientists to measure the distribution of income, and economic inequality among the participants in a particular economy, such as that of a specific country or of the world in general....
 or inequality of wealth distribution
Wealth condensation

Wealth condensation is a theoretical process by which, in certain conditions, newly-created wealth tends to become concentrated in the possession of already-wealthy individuals or entities, a form of preferential attachment....
. It is defined as a ratio
Ratio

A ratio is an expression which compares quantities relative to each other. The most common examples involve two quantities, but in theory any number of quantities can be compared....
 with values between 0 and 1: A low Gini coefficient indicates more equal income or wealth distribution, while a high Gini coefficient indicates more unequal distribution. 0 corresponds to perfect equality (everyone having exactly the same income) and 1 corresponds to perfect inequality (where one person has all the income, while everyone else has zero income). The Gini coefficient requires that no one have a negative net income or wealth. Worldwide, Gini coefficients range from approximately 0.232 in Denmark
Denmark

Denmark is a Scandinavian country in northern Europe and the senior member of the Kingdom of Denmark. It is the southernmost of the Nordic countries....
 to 0.707 in Namibia
Namibia

Namibia, officially the Republic of Namibia, is a country in southern Africa on the Atlantic Ocean coast. It shares borders with Angola and Zambia to the north, Botswana to the east, and South Africa to the south....
 although not every country has been assessed.

The Gini index is the Gini coefficient expressed as a percentage. Thus Denmark's Gini index is 23.2%.

The Gini coefficient was developed by the Italian
Italian people

The Italian people are a Southern European ethnic group located primarily in Italy and, by virtue of a wide-ranging Italian diaspora, throughout Western Europe, the Americas and Australia....
 statistician
Statistics

Statistics is a Mathematics pertaining to the collection, analysis, interpretation or explanation, and presentation of data. It also provides tools for prediction and forecasting based on data....
 Corrado Gini
Corrado Gini

Corrado Gini was an Italian statistician, demography and sociology who developed the Gini coefficient, a measure of the income inequality in a society....
 and published in his 1912 paper "Variability and Mutability" .
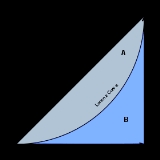
Calculation

The Gini coefficient is defined as a ratio of the areas on the Lorenz curve
Lorenz curve

In economics, the Lorenz curve is a graphical representation of the cumulative distribution function of a probability distribution; it is a graph of a function showing the proportion of the distribution assumed by the bottom y% of the values....
 diagram. If the area between the line of perfect equality and Lorenz curve is A, and the area under the Lorenz curve is B, then the Gini coefficient is A/(A+B). Since A+B = 0.5, the Gini coefficient, G = A/(0.5) = 2A = 1-2B. If the Lorenz curve is represented by the function Y = L(X), the value of B can be found with integration
Integral

Integration is an important concept in mathematics, specifically in the field of calculus and, more broadly, mathematical analysis. Given a function ƒ of a Real number variable x and an interval [ab] of the real line, the integral...
 and: In some cases, this equation can be applied to calculate the Gini coefficient without direct reference to the Lorenz curve. For example:
  • For a population uniform on the values yi, i = 1 to n, indexed in non-decreasing order ( yi = yi+1):
This may be simplified to:


  • For a discrete probability function
    Discrete probability distribution

    Discrete probability distributions arise in the mathematical description of probability theory and statistical analysis in which the values that might be observed are restricted to being within a pre-defined list of possible values....
     f(y), where yi, i = 1 to n, are the points with nonzero probabilities and which are indexed in increasing order ( yi < yi+1):
where
and

  • For a cumulative distribution function
    Cumulative distribution function

    In probability theory and statistics, the cumulative distribution function or just distribution function, completely describes the probability distribution of a real-valued random variable X....
     F(y) that is piecewise differentiable, has a mean
    Mean

    In statistics, mean has two related meanings:* the arithmetic mean .* the expected value of a random variable, which is also called the population mean....
     µ, and is zero for all negative values of y:


  • Since the Gini coefficient is half the relative mean difference, it can also be calculated using formulas for the relative mean difference. For a random sample S consisting of values yi, i = 1 to n, that are indexed in non-decreasing order ( yi = yi+1), the statistic:


is a consistent
Estimator

In statistics, an estimator is a function of the observable sample data that is used to estimate an unknown population parameter ; an estimate is the result from the actual application of the function to a particular Sampling_ of data....
 estimator
Estimator

In statistics, an estimator is a function of the observable sample data that is used to estimate an unknown population parameter ; an estimate is the result from the actual application of the function to a particular Sampling_ of data....
 of the population Gini coefficient, but is not, in general, unbiased
Estimator

In statistics, an estimator is a function of the observable sample data that is used to estimate an unknown population parameter ; an estimate is the result from the actual application of the function to a particular Sampling_ of data....
. Like, G, G(S) has a simpler form:


.

There does not exist a sample statistic that is in general an unbiased estimator of the population Gini coefficient, like the relative mean difference.

Sometimes the entire Lorenz curve is not known, and only values at certain intervals are given. In that case, the Gini coefficient can be approximated by using various techniques for interpolating
Interpolation

In the mathematics subfield of numerical analysis, interpolation is a method of constructing new data points within the range of a discrete set of known data points....
 the missing values of the Lorenz curve. If ( X k , Yk ) are the known points on the Lorenz curve, with the X k indexed in increasing order ( X k - 1 < X k ), so that:
  • Xk is the cumulated proportion of the population variable, for k = 0,...,n, with X0 = 0, Xn = 1.
  • Yk is the cumulated proportion of the income variable, for k = 0,...,n, with Y0 = 0, Yn = 1.


If the Lorenz curve is approximated on each interval as a line between consecutive points, then the area B can be approximated with trapezoids and:

is the resulting approximation for G. More accurate results can be obtained using other methods to approximate the area
Numerical integration

In numerical analysis, numerical integration constitutes a broad family of algorithms for calculating the numerical value of a definite integral, and by extension, the term is also sometimes used to describe the numerical ordinary differential equations....
 B, such as approximating the Lorenz curve with a quadratic function
Simpson's rule

In numerical analysis, Simpson's rule is a method for numerical integration, the numerical approximation of definite integrals. Specifically, it is the following approximation:...
 across pairs of intervals, or building an appropriately smooth approximation to the underlying distribution function that matches the known data. If the population mean and boundary values for each interval are also known, these can also often be used to improve the accuracy of the approximation.

The Gini coefficient calculated from a sample is a statistic and its standard error, or confidence intervals for the population Gini coefficient, should be reported. These can be calculated using bootstrap techniques but those proposed have been mathematically complicated and computationally onerous even in an era of fast computers. Ogwang (2000) made the process more efficient by setting up a “trick regression model” in which the incomes in the sample are ranked with the lowest income being allocated rank 1. The model then expresses the rank (dependent variable) as the sum of a constant A and a normal
Normal distribution

The normal distribution, also called the Gaussian distribution, is an important family of continuous probability distributions, applicable in many fields....
 error term whose variance is inversely proportional to yk;

Ogwang showed that G can be expressed as a function of the weighted least squares estimate of the constant A and that this can be used to speed up the calculation of the jackknife estimate for the standard error. Giles (2004) argued that the standard error of the estimate of A can be used to derive that of the estimate of G directly without using a jackknife at all. This method only requires the use of ordinary least squares regression after ordering the sample data. The results compare favorably with the estimates from the jackknife with agreement improving with increasing sample size. The paper describing this method can be found here: http://web.uvic.ca/econ/ewp0202.pdf

However it has since been argued that this is dependent on the model’s assumptions about the error distributions (Ogwang 2004) and the independence of error terms (Reza & Gastwirth 2006) and that these assumptions are often not valid for real data sets. It may therefore be better to stick with jackknife methods such as those proposed by Yitzhaki (1991) and Karagiannis and Kovacevic (2000). The debate continues.

The gini coefficient can be calculated if you know the mean of a distribution, the number of people (or percentiles), and the income of each person (or percentile). Princeton development economist Angus Deaton (1997, 139) has simplified the Gini calculation to one easy formula:

where u is mean income of the population, Pi is the income rank P of person i, with income X, such that the richest person receives a rank of 1 and the poorest a rank of N. This effectively gives higher weight to poorer people in the income distribution, which allows the Gini to meet the Transfer Principle.

Income Gini indices in the world

A complete listing is in list of countries by income equality
List of countries by income equality

This is a list of countries or dependencies by income inequality metrics, including Gini coefficients, according to the United Nations and the Central Intelligence Agency ....
; the article economic inequality
Economic inequality

Economic inequality refers to disparities in the distribution of economic assets and income. The term typically refers to inequality among individuals and groups within a society, but can also refer to international inequality....
 discusses the social and policy aspects of income and asset inequality.

While most developed European nations and Canada
Canada

Canada is a country occupying most of northern North America, extending from the Atlantic Ocean in the east to the Pacific Ocean in the west and northward into the Arctic Ocean....
 tend to have Gini indices between 24 and 36, the United States' and Mexico's Gini indices are both above 40, indicating that the United States
United States

The United States of America is a Federal government constitutional republic comprising U.S. state and a federal district. The country is situated mostly in central North America, where its Contiguous United States and Washington, D.C., the Capital districts and territories, lie between the Pacific Ocean and Atlantic Oceans, Borders of the U...
 and Mexico
Economy of Mexico

The economy of Mexico is 10th to 12th largest in the world.Since the 1994 economic crisis in Mexico, administrations have improved the country's Macroeconomics....
 have greater inequality. Using the Gini can help quantify differences in welfare and compensation
Living wage

Living wage is a term used to describe the minimum hourly wage necessary for a person to achieve some specific standard of living. In developed countries such as the United Kingdom or Switzerland, this standard generally means that a person working forty hours a week, with no additional income, should be able to afford a specified quality or...
 policies and philosophies. However it should be borne in mind that the Gini coefficient can be misleading when used to make political comparisons between large and small countries (see criticisms
Gini coefficient

The Gini coefficient is a Statistical_dispersion#Measures_of_statistical_dispersion most prominently used as a income inequality metrics or Wealth condensation....
 section).

The Gini index for the entire world has been estimated by various parties to be between 56 and 66.

Gini Since Wwii

Correlation with per-capita GDP

Poor countries (those with low per-capita GDP
List of countries by GDP (PPP) per capita

This article includes three lists of countries of the world sorted by their gross domestic product at purchasing power parity per capita, the value of all final goods and services produced within a nation in a given year divided by the average population for the same year....
) generally have higher Gini indices, spread between 40 and 65, with extremes at 25 and 71, while rich countries generally have lower Gini indices (under 40). The lowest Gini coefficients (under 30) can be found in continental Europe. Overall, there is a clear negative correlation between Gini coefficient and GDP per capita; although the U.S.A, Hong Kong. and Singapore are both rich and have high Gini coefficients.

In many of the former socialist countries and in-development capitalist countries (e.g., Brazil), the sizeable underground economy
Underground economy

The underground economy or black market is a market where all commerce is conducted without regard to taxation, law or regulations of trade....
 may hide income for many. In such a case, earning/wealth statistics over-represent certain income ranges (i.e., in lower-income regions), and may alter the Gini coefficient either up or down.

US income Gini indices over time

Gini indices for the United States at various times, according to the US Census Bureau
United States Census Bureau

The United States Census Bureau is the government agency that is responsible for the United States Census. It also gathers other national demographic and economic data....
:

  • 1929: 45.0 (estimated)
  • 1947: 37.6 (estimated)
  • 1967: 39.7 (first year reported)
  • 1968: 38.6 (lowest index reported)
  • 1970: 39.4
  • 1980: 40.3
  • 1990: 42.8
  • 2000: 46.2
  • 2005: 46.9
  • 2006: 47.0 (highest index reported)
  • 2007: 46.3


Advantages of Gini coefficient as a measure of inequality

  • The Gini coefficient's main advantage is that it is a measure of inequality by means of a ratio analysis, rather than a variable unrepresentative of most of the population, such as per capita income
    Per capita income

    Per capita income means how much each individual receives, in monetary terms, of the yearly income generated in the country. This is what each citizen is to receive if the yearly national income is divided equally among everyone....
     or gross domestic product
    Gross domestic product

    File:GDP nominal per capita world map IMF 2008.pngThe gross domestic product or gross domestic income is one of the measures of national income and output for a given country's economy....
    .


  • It can be used to compare income distributions across different population sectors as well as countries, for example the Gini coefficient for urban areas differs from that of rural areas in many countries (though the United States' urban and rural Gini coefficients are nearly identical).


  • It is sufficiently simple that it can be compared across countries and be easily interpreted. GDP statistics are often criticised as they do not represent changes for the whole population; the Gini coefficient demonstrates how income has changed for poor and rich. If the Gini coefficient is rising as well as GDP, poverty may not be improving for the majority of the population.


  • The Gini coefficient can be used to indicate how the distribution of income has changed within a country over a period of time, thus it is possible to see if inequality is increasing or decreasing.


  • The Gini coefficient satisfies four important principles:
    • Anonymity: it does not matter who the high and low earners are.
    • Scale independence: the Gini coefficient does not consider the size of the economy, the way it is measured, or whether it is a rich or poor country on average.
    • Population independence: it does not matter how large the population of the country is.
    • Transfer principle: if income (less than the difference), is transferred from a rich person to a poor person the resulting distribution is more equal.


Disadvantages of Gini coefficient as a measure of inequality

  • The Gini coefficient of different sets of people cannot be averaged to obtain the Gini coefficient of all the people in the sets: if a Gini coefficient were to be calculated for each person it would always be zero. For a large, economically diverse country, a much higher coefficient will be calculated for the country as a whole than will be calculated for each of its regions. (The coefficient is usually applied to measurable nominal income rather than local purchasing power
    Purchasing power

    Purchasing power is the number of goods/services that can be purchased with a unit of currency. For example, if you had taken one dollar to a store in the 1950s, you would have been able to buy a greater number of items than you would today, indicating that you would have had a greater purchasing power in the 1950s....
    , tending to increase the calculated coefficient across larger areas.)


For this reason, the scores calculated for individual countries within the EU
European Union

The European Union is an economic and political union of 27 European Union member state, located primarily in Europe. It was established by the Treaty of Maastricht on 1 November 1993 upon the foundations of the pre-existing European Economic Community....
 are difficult to compare with the score of the entire US: the overall value for the EU should be used in that case, 31.3, which is still much lower than the United States', 45. Using decomposable inequality measures (e.g. the Theil index
Theil index

The Theil index, derived by econometrics Henri Theil, is a statistic used to measure economic inequality....
  converted by into a inequality coefficient) averts such problems.


  • The Lorenz curve may understate the actual amount of inequality if richer households are able to use income more efficiently than lower income households. From another point of view, measured inequality may be the result of more or less efficient use of household incomes.


  • Economies with similar incomes and Gini coefficients can still have very different income distributions. This is because the Lorenz curves can have different shapes and yet still yield the same Gini coefficient.


  • It measures current income rather than lifetime income. A society in which everyone earned the same over a lifetime would appear unequal because of people at different stages in their life; a society in which students study rather than save can never have a coefficient of 0. However, Gini coefficient can also be calculated for any kind of distribution, e.g. for wealth.


Problems in using the Gini coefficient

  • Gini coefficients do include income gained from wealth; however, the Gini coefficient is used to measure net income more than net worth, which can be misinterpreted. For example, Sweden
    Sweden

    Sweden , officially the Kingdom of Sweden , is a Nordic countries on the Scandinavian Peninsula in Northern Europe. Sweden has land borders with Norway to the west and Finland to the northeast, and it is connected to Denmark by the ?resund Bridge in the south....
     has a low Gini coefficient for income distribution and a higher Gini coefficient for wealth (the wealth inequality is low by international standards, but still significant: 5% of Swedish household shareholders hold 77% of the share value owned by households). In other words, the Gini income coefficient should not be interpreted as measuring effective egalitarianism
    Egalitarianism

    Egalitarianism or Equalism is a political doctrine that holds that all people should be treated as equals and have the same political freedom, economic freedom, social justice, and civil rights rights....
    .


  • Too often only the Gini coefficient is quoted without describing the proportions of the quantiles used for measurement. As with other inequality coefficients, the Gini coefficient is influenced by the granularity of the measurements. For example, five 20% quantiles (low granularity) will usually yield a lower Gini coefficient than twenty 5% quantiles (high granularity) taken from the same distribution. This is an often encountered problem with measurements.


  • Care should be taken in using the Gini coefficient as a measure of egalitarianism, as it is properly a measure of income dispersion. Two equally egalitarian countries with different immigration policies may have different Gini coefficients.


  • The Gini coefficient is generally measured at a point in time, hence it potentially misses a lot of dynamic information about individual's lifetime income. Other factors, such as age distribution within a population and mobility within income classes are ignored. It is possible for a given economy to have a higher Gini coefficient at any one point in time than another economy, while the Gini coefficient calculated over individuals' lifetime income is actually lower (or even more higher) than the "more equal" (at a given point in time) economy's. Essentially, what matters is not just inequality in any particular year, but the composition of the distribution over time.


General problems of measurement

  • Comparing income distributions among countries may be difficult because benefits systems may differ. For example, some countries give benefits in the form of money while others give food stamps
    Food stamps

    Food stamps are government issued coupons that recipients exchange for food.For food stamps in the United States see Food Stamp Program....
    , which might not be counted by some economists and researchers as income in the Lorenz curve and therefore not taken into account in the Gini coefficient. The USA counts income before benefits, while France counts it after benefits, making the USA appear more unequal vis-a-vis France than it is.


  • The measure will give different results when applied to individuals instead of households. When different populations are not measured with consistent definitions, comparison is not meaningful.


  • As for all statistics, there may be systematic and random errors in the data. The meaning of the Gini coefficient decreases as the data become less accurate. Also, countries may collect data differently, making it difficult to compare statistics between countries.


As one result of this criticism, in addition to or in competition with the Gini coefficient entropy measures are frequently used (e.g. the Theil Index
Theil index

The Theil index, derived by econometrics Henri Theil, is a statistic used to measure economic inequality....
 and the index of Atkinson
Anthony Barnes Atkinson

Sir Anthony Barnes "Tony" Atkinson, FBA is a United Kingdom economist and has been a Senior Research Fellow of Nuffield College, Oxford since 2005....
). These measures attempt to compare the distribution of resources by intelligent agents in the market with a maximum entropy
Information entropy

In information theory, entropy is a measure of the uncertainty associated with a random variable. The term by itself in this context usually refers to the Shannon entropy, which quantifies, in the sense of an expected value, the self-information contained in a message, usually in units such as bits....
 random distribution, which would occur if these agents acted like non-intelligent particles in a closed system following the laws of statistical physics.

Credit risk


The Gini coefficient is also commonly used for the measurement of the discriminatory power of rating
Credit rating

A credit rating assesses the credit worthiness of an individual, corporation, or even a country. It is an evaluation made by credit bureaus of a borrower?s overall credit history....
 systems in credit risk
Credit risk

Credit risk is the risk of loss due to a debtor's non-payment of a loan or other line of credit ...
 management. Since Gini coefficient addresses wealth inequality it may be important to understand what a transformative asset
Transformative asset

Transformative assets are assets that may provide resources for social mobility and economic mobility. Examples of transformative assets include Owner-occupier and inheritances....
 is. Transformative assets increase the Gini coefficient as they provide a family or individual with a wealth advantage over most persons.

The discriminatory power refers to a credit risk model's ability to differentiate between defaulting and non-defaulting clients. The above formula may be used for the final model and also at individual model factor level, to quantify the discriminatory power of individual factors. This is as a result of too many non defaulting clients falling into the lower points scale e.g. factor has a 10 point scale and 30% of non defaulting clients are being assigned the lowest points available e.g. 0 or negative points. This indicates that the factor is behaving in a counter-intuitive manner and would require further investigation at the model development stage.

References: The Analytics of risk model validation

See also

  • Atkinson index
    Atkinson index

    The Atkinson index is a measure of economic income inequality developed by Anthony Barnes Atkinson. The distinguishing feature of the Atkinson index is its ability to gauge movements in different segments of the income distribution....
  • Human Poverty Index
    Human Poverty Index

    The Human Poverty Index is an indication of the standard of living in a country, developed by the United Nations . For highly developed countries, the UN considers that it can better reflect the extent of Poverty compared to the Human Development Index ....
  • Income inequality metrics
    Income inequality metrics

    The concept of inequality is distinct from that of poverty and fairness. Income inequality metrics or income distribution metrics are used by social scientists to measure the distribution of income, and economic inequality among the participants in a particular economy, such as that of a specific country or of the world in general....
  • List of countries by income equality
    List of countries by income equality

    This is a list of countries or dependencies by income inequality metrics, including Gini coefficients, according to the United Nations and the Central Intelligence Agency ....
  • List of countries by Human Development Index
    List of countries by Human Development Index

    File:2006nian Renlei Fazhan Zhishu.svgThis is a list of countries by Human Development Index as included in a United Nations Development Program's Human development Statistical Update released on December 18, 2008, compiled on the basis of data from 2006....
  • Pareto distribution
    Pareto distribution

    The Pareto distribution, named after the Italian economist Vilfredo Pareto, is a power law probability distribution that coincides with social sciences, scientific, geophysical, actuarial science, and many other types of observable phenomena....
  • Robin Hood index
    Robin Hood index

    The Hoover index is a measure of Income inequality metrics. It is equal to the portion of the total community income that would have to be redistributed for there to be perfect equality....
  • ROC analysis
  • Social welfare provision
    Social welfare provision

    A social welfare provision refers to any program which seeks to provide a minimum level of income, service or other support for many marginalized groups such as the poor, elderly, and disabled people....
  • Spreadsheet computations
    Income inequality metrics

    The concept of inequality is distinct from that of poverty and fairness. Income inequality metrics or income distribution metrics are used by social scientists to measure the distribution of income, and economic inequality among the participants in a particular economy, such as that of a specific country or of the world in general....
  • Suits index
    Suits index

    The Suits index of a public policy is a measure of collective progressivity, named for economist Daniel B. Suits. Similar to the Gini Coefficient, the Suits index is calculated by comparing the area under the Lorenz curve to the area under a proportional line....
  • Theil index
    Theil index

    The Theil index, derived by econometrics Henri Theil, is a statistic used to measure economic inequality....
  • Wealth condensation
    Wealth condensation

    Wealth condensation is a theoretical process by which, in certain conditions, newly-created wealth tends to become concentrated in the possession of already-wealthy individuals or entities, a form of preferential attachment....
  • Welfare economics
    Welfare economics

    Welfare economics is a branch of economics that uses microeconomics techniques to simultaneously determine allocative efficiency within an economy and the income Distribution associated with it....

Further reading


External links

  • Deutsche Bundesbank: , 2005 (on using e.g. the Gini coefficient for risc evaluation of loan portefolios)
  • (from internet archive)
  • , an application of the Gini coefficient to software
  • , online computation of examples: ,
  • Software:
    • , including code for computing Gini, Atkinson, Theil indexes and for plotting the Lorenz Curve. Many examples are available.
    • computes the Gini Coefficient, plots the Lorenz curve, and computes many other measures of concentration for any dataset
    • Free Calculator: and (Python
      Python (programming language)

      Python is a general-purpose high-level programming language. Its design philosophy emphasizes code readability. Python's core syntax and semantics are Minimalism , while the standard library is large and comprehensive....
       and Lua
      Lua programming language

      In computing, Lua is a lightweight languages, Reflection , imperative programming and functional programming programming language, designed as a scripting language with extension language semantics as a primary goal....
      ) for Atkinson, Gini, and Hoover inequalities
    • Users of the data analysis software can install the "" package which allows for computation of a variety of inequality indices including Gini, Atkinson, Theil.