
History of surface weather analysis
Encyclopedia
The history of surface weather analysis concerns the timetable of developments related to surface weather analysis. Initially a tool of study for the behavior of storms, surface weather analyses
became a work in progress to explain current weather and as an aid for short term weather forecasting
. Initial efforts to create surface weather analyses began in the mid-19th century by using surface weather observation
s to analyze isobars, isotherms, and display temperature and cloud cover. By the mid-20th century, much more information was being placed upon the station model
s plotted on weather maps and surface fronts, per the Norwegian cyclone model
, were being analyzed worldwide. Eventually, observation plotting went from a manual exercise to an automated task for computers and plotters. Surface analysis remains a manual and partially subjective
exercise, whether it be via hand and paper, or via a workstation.
, William Reid, Elias Loomis
, and Sir Francis Galton
, who created the first weather maps in order to devise a theory on storm systems. The invention of the telegraph in 1837 made it possible to gather weather information from multiple distant locations quickly enough to preserve its value for real-time applications. The Smithsonian Institution developed its network of observers over much of the central and eastern United States between the 1840s and 1860s once Joseph Henry
took the helm. Beginning in 1849, the Smithsonian started producing surface analyses on a daily basis using the 150 stations in their network. The U.S. Army Signal Corps inherited this network between 1870 and 1874 by an act of Congress, and expanded it to the west coast soon afterwards. Three times daily, all stations would telegraph in their observations to the central office which would then plot the information on a map upon which isobars, or lines of equal pressure, would be drawn which would identify centers of high and low pressure, as well as squall line
s. At first, all the data on the map was not taken at exactly the same time in the early days of these analyses because of a lack of time standardization. The first attempts at time standardization took hold in the Great Britain by 1855. However, in the United States, standard time did not come to pass until 1883, when time zone
s started to come into use across America for railroad use. The entire United States did not finally come under the influence of time zones until 1905, when Detroit finally established standard time.
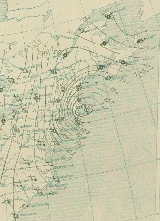
The earliest surface analyses from the United States featured a map of the continental U.S. with indications of cloud cover and wind direction arranged on an early form of what has become a station model
. A general indication of the weather for various cities around the country was also included on the bottom of the map. Within a short time, the Signal Corps added a tables showing eight-hour pressure change, 24-hour temperature change, relative humidity, and 24-hour precipitation. The Signal Office also added a general discussion of synoptic weather features and forecast, before adding isobars and isotherms onto the maps. By the end of 1872, the maps had established the format it would use until the introduction of frontal analysis. By the 20th century, most of the weather-related functions under the U. S. Signal Corps branched off into a new civilian agency known as the U. S. Weather Bureau, the forerunner of today's National Weather Service
.
Internationally, other countries followed the lead of the United States, in regards to taking simultaneous weather observations, starting in 1873. Other countries then began preparing surface analyses. In Australia
, the first weather map showed up in print media in 1877. Japan
's Tokyo Meteorological Observatory, the forerunner of the Japan Meteorological Agency
, began constructing surface weather maps in 1883.
 The use of frontal zones on weather maps did not appear until the introduction of the Norwegian cyclone model
in the late 1910s, despite Loomis' earlier attempt at a similar notion in 1841. Since the leading edge of air mass changes bore resemblance to the military fronts of World War I
, the term "front" came into use to represent these lines.
Despite the introduction of the Norwegian cyclone
model just after World War I, the United States did not formally analyze fronts on surface analyses until August 1, 1941, just before the WBAN Analysis Center opened in downtown Washington, D.C.
. The effort to automate map plotting began in the United States in 1969, with the process complete in the 1970s. Hong Kong
completed their process of automated surface plotting by 1987. By 1999, computer systems and software had finally become sophisticated enough to allow for the ability to underlay on the same workstation satellite imagery, radar imagery, and model-derived fields such as atmospheric thickness and frontogenesis in combination with surface observations to make for the best possible surface analysis. In the United States, this development was achieved when Intergraph workstations were replaced by n-AWIPS
workstations.
 By 2001, the various surface analyses done within the National Weather Service were combined into the Unified Surface Analysis, which is issued every six hours and combines the analyses of four different centers. Recent advances in both the fields of meteorology
and geographic information system
s have made it possible to devise finely tailored products that take us from the traditional weather map into an entirely new realm. Weather information can quickly be matched to relevant geographical detail. For instance, icing conditions can be mapped onto the road network. This will likely continue to lead to changes in the way surface analyses are created and displayed over the next several years.
Surface weather analysis
Surface weather analysis is a special type of weather map that provides a view of weather elements over a geographical area at a specified time based on information from ground-based weather stations...
became a work in progress to explain current weather and as an aid for short term weather forecasting
Weather forecasting
Weather forecasting is the application of science and technology to predict the state of the atmosphere for a given location. Human beings have attempted to predict the weather informally for millennia, and formally since the nineteenth century...
. Initial efforts to create surface weather analyses began in the mid-19th century by using surface weather observation
Surface weather observation
Surface weather observations are the fundamental data used for safety as well as climatological reasons to forecast weather and issue warnings worldwide. They can be taken manually, by a weather observer, by computer through the use of automated weather stations, or in a hybrid scheme using...
s to analyze isobars, isotherms, and display temperature and cloud cover. By the mid-20th century, much more information was being placed upon the station model
Station model
A station model is a symbolic illustration showing the weather occurring at a given reporting station. Meteorologists created the station model to plot a number of weather elements in a small space on weather maps...
s plotted on weather maps and surface fronts, per the Norwegian cyclone model
Norwegian cyclone model
The older of the models of extratropical cyclone development is known as the Norwegian Cyclone Model, developed during and shortly after World War I within the Bergen School of Meteorology. In this theory, cyclones develop as they move up and along a frontal boundary, eventually occluding and...
, were being analyzed worldwide. Eventually, observation plotting went from a manual exercise to an automated task for computers and plotters. Surface analysis remains a manual and partially subjective
Subjectivity
Subjectivity refers to the subject and his or her perspective, feelings, beliefs, and desires. In philosophy, the term is usually contrasted with objectivity.-Qualia:...
exercise, whether it be via hand and paper, or via a workstation.
Nineteenth century
The use of weather charts in a modern sense began in the middle portion of the 19th century. Weather map pioneers include William Charles RedfieldWilliam Charles Redfield
William Charles Redfield was one of the founders and the first President of the American Association for the Advancement of Science formed in 1848....
, William Reid, Elias Loomis
Elias Loomis
- Life and work :Loomis was born in Willington, Connecticut in 1811. He graduated at Yale College in 1830, was a tutor there for three years , and then spent the next year in scientific investigation in Paris. On his return, Loomis was appointed professor of mathematics in the Western Reserve...
, and Sir Francis Galton
Francis Galton
Sir Francis Galton /ˈfrɑːnsɪs ˈgɔːltn̩/ FRS , cousin of Douglas Strutt Galton, half-cousin of Charles Darwin, was an English Victorian polymath: anthropologist, eugenicist, tropical explorer, geographer, inventor, meteorologist, proto-geneticist, psychometrician, and statistician...
, who created the first weather maps in order to devise a theory on storm systems. The invention of the telegraph in 1837 made it possible to gather weather information from multiple distant locations quickly enough to preserve its value for real-time applications. The Smithsonian Institution developed its network of observers over much of the central and eastern United States between the 1840s and 1860s once Joseph Henry
Joseph Henry
Joseph Henry was an American scientist who served as the first Secretary of the Smithsonian Institution, as well as a founding member of the National Institute for the Promotion of Science, a precursor of the Smithsonian Institution. During his lifetime, he was highly regarded...
took the helm. Beginning in 1849, the Smithsonian started producing surface analyses on a daily basis using the 150 stations in their network. The U.S. Army Signal Corps inherited this network between 1870 and 1874 by an act of Congress, and expanded it to the west coast soon afterwards. Three times daily, all stations would telegraph in their observations to the central office which would then plot the information on a map upon which isobars, or lines of equal pressure, would be drawn which would identify centers of high and low pressure, as well as squall line
Squall line
A squall line is a line of severe thunderstorms that can form along or ahead of a cold front. In the early 20th century, the term was used as a synonym for cold front. It contains heavy precipitation, hail, frequent lightning, strong straight-line winds, and possibly tornadoes and waterspouts....
s. At first, all the data on the map was not taken at exactly the same time in the early days of these analyses because of a lack of time standardization. The first attempts at time standardization took hold in the Great Britain by 1855. However, in the United States, standard time did not come to pass until 1883, when time zone
Time zone
A time zone is a region on Earth that has a uniform standard time for legal, commercial, and social purposes. In order for the same clock time to always correspond to the same portion of the day as the Earth rotates , different places on the Earth need to have different clock times...
s started to come into use across America for railroad use. The entire United States did not finally come under the influence of time zones until 1905, when Detroit finally established standard time.
The earliest surface analyses from the United States featured a map of the continental U.S. with indications of cloud cover and wind direction arranged on an early form of what has become a station model
Station model
A station model is a symbolic illustration showing the weather occurring at a given reporting station. Meteorologists created the station model to plot a number of weather elements in a small space on weather maps...
. A general indication of the weather for various cities around the country was also included on the bottom of the map. Within a short time, the Signal Corps added a tables showing eight-hour pressure change, 24-hour temperature change, relative humidity, and 24-hour precipitation. The Signal Office also added a general discussion of synoptic weather features and forecast, before adding isobars and isotherms onto the maps. By the end of 1872, the maps had established the format it would use until the introduction of frontal analysis. By the 20th century, most of the weather-related functions under the U. S. Signal Corps branched off into a new civilian agency known as the U. S. Weather Bureau, the forerunner of today's National Weather Service
National Weather Service
The National Weather Service , once known as the Weather Bureau, is one of the six scientific agencies that make up the National Oceanic and Atmospheric Administration of the United States government...
.
Internationally, other countries followed the lead of the United States, in regards to taking simultaneous weather observations, starting in 1873. Other countries then began preparing surface analyses. In Australia
Australia
Australia , officially the Commonwealth of Australia, is a country in the Southern Hemisphere comprising the mainland of the Australian continent, the island of Tasmania, and numerous smaller islands in the Indian and Pacific Oceans. It is the world's sixth-largest country by total area...
, the first weather map showed up in print media in 1877. Japan
Japan
Japan is an island nation in East Asia. Located in the Pacific Ocean, it lies to the east of the Sea of Japan, China, North Korea, South Korea and Russia, stretching from the Sea of Okhotsk in the north to the East China Sea and Taiwan in the south...
's Tokyo Meteorological Observatory, the forerunner of the Japan Meteorological Agency
Japan Meteorological Agency
The or JMA, is the Japanese government's weather service. Charged with gathering and reporting weather data and forecasts in Japan, it is a semi-autonomous part of the Ministry of Land, Infrastructure and Transport...
, began constructing surface weather maps in 1883.
Twentieth century
Norwegian cyclone model
The older of the models of extratropical cyclone development is known as the Norwegian Cyclone Model, developed during and shortly after World War I within the Bergen School of Meteorology. In this theory, cyclones develop as they move up and along a frontal boundary, eventually occluding and...
in the late 1910s, despite Loomis' earlier attempt at a similar notion in 1841. Since the leading edge of air mass changes bore resemblance to the military fronts of World War I
World War I
World War I , which was predominantly called the World War or the Great War from its occurrence until 1939, and the First World War or World War I thereafter, was a major war centred in Europe that began on 28 July 1914 and lasted until 11 November 1918...
, the term "front" came into use to represent these lines.
Despite the introduction of the Norwegian cyclone
Cyclone
In meteorology, a cyclone is an area of closed, circular fluid motion rotating in the same direction as the Earth. This is usually characterized by inward spiraling winds that rotate anticlockwise in the Northern Hemisphere and clockwise in the Southern Hemisphere of the Earth. Most large-scale...
model just after World War I, the United States did not formally analyze fronts on surface analyses until August 1, 1941, just before the WBAN Analysis Center opened in downtown Washington, D.C.
Washington, D.C.
Washington, D.C., formally the District of Columbia and commonly referred to as Washington, "the District", or simply D.C., is the capital of the United States. On July 16, 1790, the United States Congress approved the creation of a permanent national capital as permitted by the U.S. Constitution....
. The effort to automate map plotting began in the United States in 1969, with the process complete in the 1970s. Hong Kong
Hong Kong
Hong Kong is one of two Special Administrative Regions of the People's Republic of China , the other being Macau. A city-state situated on China's south coast and enclosed by the Pearl River Delta and South China Sea, it is renowned for its expansive skyline and deep natural harbour...
completed their process of automated surface plotting by 1987. By 1999, computer systems and software had finally become sophisticated enough to allow for the ability to underlay on the same workstation satellite imagery, radar imagery, and model-derived fields such as atmospheric thickness and frontogenesis in combination with surface observations to make for the best possible surface analysis. In the United States, this development was achieved when Intergraph workstations were replaced by n-AWIPS
Advanced Weather Interactive Processing System
The Advanced Weather Interactive Processing System is a technologically-advanced processing, display, and telecommunications system that is the cornerstone of the United States National Weather Service's operations....
workstations.
Twenty-First century
Meteorology
Meteorology is the interdisciplinary scientific study of the atmosphere. Studies in the field stretch back millennia, though significant progress in meteorology did not occur until the 18th century. The 19th century saw breakthroughs occur after observing networks developed across several countries...
and geographic information system
Geographic Information System
A geographic information system, geographical information science, or geospatial information studies is a system designed to capture, store, manipulate, analyze, manage, and present all types of geographically referenced data...
s have made it possible to devise finely tailored products that take us from the traditional weather map into an entirely new realm. Weather information can quickly be matched to relevant geographical detail. For instance, icing conditions can be mapped onto the road network. This will likely continue to lead to changes in the way surface analyses are created and displayed over the next several years.