

Surface weather analysis
Encyclopedia
Weather map
A weather map displays various meteorological features across a particular area at a particular point in time. Such maps have been in use since the mid-19th century and are used for research and weather forecasting purposes. Maps using isotherms show temperature gradients, which can help locate...
that provides a view of weather
Weather
Weather is the state of the atmosphere, to the degree that it is hot or cold, wet or dry, calm or stormy, clear or cloudy. Most weather phenomena occur in the troposphere, just below the stratosphere. Weather refers, generally, to day-to-day temperature and precipitation activity, whereas climate...
elements over a geographical area at a specified time based on information from ground-based weather stations. Weather maps are created by plotting or tracing the values of relevant quantities such as sea level pressure, temperature
Temperature
Temperature is a physical property of matter that quantitatively expresses the common notions of hot and cold. Objects of low temperature are cold, while various degrees of higher temperatures are referred to as warm or hot...
, and cloud cover
Cloud cover
Cloud cover refers to the fraction of the sky obscured by clouds when observed from a particular location...
onto a geographical map to help find synoptic scale features such as weather fronts.
The first weather maps in the 19th century were drawn well after the fact to help devise a theory on storm systems. After the advent of the telegraph, simultaneous surface weather observation
Surface weather observation
Surface weather observations are the fundamental data used for safety as well as climatological reasons to forecast weather and issue warnings worldwide. They can be taken manually, by a weather observer, by computer through the use of automated weather stations, or in a hybrid scheme using...
s became possible for the first time, and beginning in the late 1840s, the Smithsonian Institution
Smithsonian Institution
The Smithsonian Institution is an educational and research institute and associated museum complex, administered and funded by the government of the United States and by funds from its endowment, contributions, and profits from its retail operations, concessions, licensing activities, and magazines...
became the first organization to draw real-time surface analyses. Use of surface analyses began first in the United States, spreading worldwide during the 1870s. Use of the Norwegian cyclone model
Norwegian cyclone model
The older of the models of extratropical cyclone development is known as the Norwegian Cyclone Model, developed during and shortly after World War I within the Bergen School of Meteorology. In this theory, cyclones develop as they move up and along a frontal boundary, eventually occluding and...
for frontal analysis began in the late 1910s across Europe, with its use finally spreading to the United States during World War II
World War II
World War II, or the Second World War , was a global conflict lasting from 1939 to 1945, involving most of the world's nations—including all of the great powers—eventually forming two opposing military alliances: the Allies and the Axis...
.
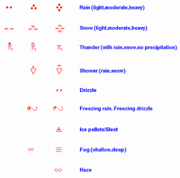
Surface weather analyses have special symbols that show frontal systems, cloud cover, precipitation
Precipitation (meteorology)
In meteorology, precipitation In meteorology, precipitation In meteorology, precipitation (also known as one of the classes of hydrometeors, which are atmospheric water phenomena is any product of the condensation of atmospheric water vapor that falls under gravity. The main forms of precipitation...
, or other important information. For example, an H may represent high pressure, implying good and fair weather. An L on the other hand may represent low pressure, which frequently accompanies precipitation. Various symbols are used not just for frontal zones and other surface boundaries on weather maps, but also to depict the present weather at various locations on the weather map. Areas of precipitation help determine the frontal type and location.
History of surface analysis
The use of weather charts in a modern sense began in the middle portion of the 19th century in order to devise a theory on storm systems. The development of a telegraph network by 1845 made it possible to gather weather information from multiple distant locations quickly enough to preserve its value for real-time applications. The Smithsonian Institution developed its network of observers over much of the central and eastern United States between the 1840s and 1860s once Joseph Henry took the helm. The U.S. Army Signal Corps inherited this network between 1870 and 1874 by an act of Congress, and expanded it to the west coast soon afterwards.At first, all the data on the map was not taken from these analyses because of a lack of time standardization. The first attempts at time standardization took hold in Great Britain by 1855. The entire United States did not finally come under the influence of time zones until 1905, when Detroit finally established standard time. Other countries followed the lead of the United States in taking simultaneous weather observations, starting in 1873. Other countries then began preparing surface analyses. The use of frontal zones on weather maps did not appear until the introduction of the Norwegian cyclone model
Norwegian cyclone model
The older of the models of extratropical cyclone development is known as the Norwegian Cyclone Model, developed during and shortly after World War I within the Bergen School of Meteorology. In this theory, cyclones develop as they move up and along a frontal boundary, eventually occluding and...
in the late 1910s, despite Loomis' earlier attempt at a similar notion in 1841. Since the leading edge of air mass changes bore resemblance to the military fronts of World War I
World War I
World War I , which was predominantly called the World War or the Great War from its occurrence until 1939, and the First World War or World War I thereafter, was a major war centred in Europe that began on 28 July 1914 and lasted until 11 November 1918...
, the term "front" came into use to represent these lines.
Cyclone
In meteorology, a cyclone is an area of closed, circular fluid motion rotating in the same direction as the Earth. This is usually characterized by inward spiraling winds that rotate anticlockwise in the Northern Hemisphere and clockwise in the Southern Hemisphere of the Earth. Most large-scale...
model just after World War I, the United States did not formally analyze fronts on surface analyses until late 1942, when the WBAN Analysis Center opened in downtown Washington, D.C.
Washington, D.C.
Washington, D.C., formally the District of Columbia and commonly referred to as Washington, "the District", or simply D.C., is the capital of the United States. On July 16, 1790, the United States Congress approved the creation of a permanent national capital as permitted by the U.S. Constitution....
. The effort to automate map plotting began in the United States in 1969, with the process complete in the 1970s. Hong Kong
Hong Kong
Hong Kong is one of two Special Administrative Regions of the People's Republic of China , the other being Macau. A city-state situated on China's south coast and enclosed by the Pearl River Delta and South China Sea, it is renowned for its expansive skyline and deep natural harbour...
completed their process of automated surface plotting by 1987. By 1999, computer systems and software had finally become sophisticated enough to allow for the ability to underlay on the same workstation satellite imagery, radar imagery, and model-derived fields such as atmospheric thickness and frontogenesis in combination with surface observations to make for the best possible surface analysis. In the United States, this development was achieved when Intergraph workstations were replaced by n-AWIPS
Advanced Weather Interactive Processing System
The Advanced Weather Interactive Processing System is a technologically-advanced processing, display, and telecommunications system that is the cornerstone of the United States National Weather Service's operations....
workstations. By 2001, the various surface analyses done within the National Weather Service were combined into the Unified Surface Analysis, which is issued every six hours and combines the analyses of four different centers. Recent advances in both the fields of meteorology
Meteorology
Meteorology is the interdisciplinary scientific study of the atmosphere. Studies in the field stretch back millennia, though significant progress in meteorology did not occur until the 18th century. The 19th century saw breakthroughs occur after observing networks developed across several countries...
and geographic information system
Geographic Information System
A geographic information system, geographical information science, or geospatial information studies is a system designed to capture, store, manipulate, analyze, manage, and present all types of geographically referenced data...
s have made it possible to devise finely tailored products that take us from the traditional weather map into an entirely new realm. Weather information can quickly be matched to relevant geographical detail. For instance, icing conditions can be mapped onto the road network. This will likely continue to lead to changes in the way surface analyses are created and displayed over the next several years.
Station model used on weather maps

Celsius
Celsius is a scale and unit of measurement for temperature. It is named after the Swedish astronomer Anders Celsius , who developed a similar temperature scale two years before his death...
. Each full flag on the Wind Barb represents 10 knots (20 km/h) of wind, each half flag represents 5 knots (10 km/h). When winds reach 50 knots (98 km/h), a filled in triangle is used for each 50 knots (98 km/h) of wind. In the United States, rainfall plotted in the corner of the station model are in English units, inch
Inch
An inch is the name of a unit of length in a number of different systems, including Imperial units, and United States customary units. There are 36 inches in a yard and 12 inches in a foot...
es. The international standard rainfall measurement unit is the millimeter. Once a map has a field of station models plotted, the analyzing isobars (lines of equal pressure), isallobars (lines of equal pressure change), isotherms (lines of equal temperature), and isotachs (lines of equal wind speed) can be easily accomplished. The abstract present weather symbols used on surface weather analyses for obstructions to visibility, precipitation, and thunderstorms were devised to take up the least room possible on weather maps.
Synoptic scale features
A synoptic scale feature is one whose dimensions are large in scale, more than several hundred kilometers in length. Migratory pressure systems and frontal zones exist on this scale.Pressure centers
Low pressure
Low-pressure systems, also known as cycloneCyclone
In meteorology, a cyclone is an area of closed, circular fluid motion rotating in the same direction as the Earth. This is usually characterized by inward spiraling winds that rotate anticlockwise in the Northern Hemisphere and clockwise in the Southern Hemisphere of the Earth. Most large-scale...
s, are located in minima in the pressure field. Rotation is inward and counterclockwise in the northern hemisphere
Northern Hemisphere
The Northern Hemisphere is the half of a planet that is north of its equator—the word hemisphere literally means “half sphere”. It is also that half of the celestial sphere north of the celestial equator...
as opposed to inward and clockwise in the southern hemisphere
Southern Hemisphere
The Southern Hemisphere is the part of Earth that lies south of the equator. The word hemisphere literally means 'half ball' or "half sphere"...
due to the coriolis force. Weather is normally unsettled in the vicinity of a cyclone, with increased cloudiness, increased winds, increased temperatures, and upward motion in the atmosphere, which leads to an increased chance of precipitation. Polar low
Polar low
A polar low is a small-scale, long-lived atmospheric low pressure system that is found over the ocean areas poleward of the main polar front in both the Northern and Southern Hemispheres. The systems usually have a horizontal length scale of less than and exist for no more than a couple of days. ...
s can form over relatively mild ocean waters when cold air sweeps in from the ice cap, leading to upward motion and convection, usually in the form of snow. Tropical cyclones and winter storms are intense varieties of low pressure. Over land, thermal low
Thermal low
Thermal lows, or heat lows, are non-frontal low-pressure areas that occur over the continents in the subtropics such as near the Sonoran Desert, the Mexican plateau, Sahara, South America over northwest Argentina, Australia, the Iberian peninsula, and Tibetan plateau during the warm season as the...
s are indicative of hot weather during the summer.
High pressure
High-pressure systems, also known as anticycloneAnticyclone
An anticyclone is a weather phenomenon defined by the United States' National Weather Service's glossary as "[a] large-scale circulation of winds around a central region of high atmospheric pressure, clockwise in the Northern Hemisphere, counterclockwise in the Southern Hemisphere"...
s, rotate outward and clockwise in the northern hemisphere as opposed to outward and counterclockwise in the southern hemisphere. Under surface highs, sinking motion leads to skies that are clearer, winds that are lighter, and there is a reduced chance of precipitation. There is normally a greater range between high and low temperature due to the drier air mass present. If high pressure persists, air pollution will build up due to pollutants trapped near the surface caused by the subsiding motion associated with the high.
Fronts
Air mass
In meteorology, an air mass is a volume of air defined by its temperature and water vapor content. Air masses cover many hundreds or thousands of square miles, and adopt the characteristics of the surface below them. They are classified according to latitude and their continental or maritime...
es with different density (e.g., air temperature and/or humidity
Humidity
Humidity is a term for the amount of water vapor in the air, and can refer to any one of several measurements of humidity. Formally, humid air is not "moist air" but a mixture of water vapor and other constituents of air, and humidity is defined in terms of the water content of this mixture,...
). When a front passes over an area, it is marked by changes in temperature, moisture, wind
Wind
Wind is the flow of gases on a large scale. On Earth, wind consists of the bulk movement of air. In outer space, solar wind is the movement of gases or charged particles from the sun through space, while planetary wind is the outgassing of light chemical elements from a planet's atmosphere into space...
speed and direction, atmospheric pressure, and often a change in the precipitation pattern. Cold front
Cold front
A cold front is defined as the leading edge of a cooler mass of air, replacing a warmer mass of air.-Development of cold front:The cooler and denser air wedges under the less-dense warmer air, lifting it...
s are closely associated with low pressure systems, normally lying at the leading edge of high-pressure systems and, in the case of the polar front, at approximately the equatorward edge of the high-level polar jet. Fronts are guided by winds aloft, but they normally move at lesser speeds. In the northern hemisphere, they usually travel from west to east (though they can move in a north-south direction as well). Movement is due to the pressure gradient force
Pressure gradient force
The pressure gradient force is not actually a 'force' but the acceleration of air due to pressure difference . It is usually responsible for accelerating a parcel of air from a high atmospheric pressure region to a low pressure region, resulting in wind...
(horizontal differences in atmospheric pressure) and the Coriolis effect
Coriolis effect
In physics, the Coriolis effect is a deflection of moving objects when they are viewed in a rotating reference frame. In a reference frame with clockwise rotation, the deflection is to the left of the motion of the object; in one with counter-clockwise rotation, the deflection is to the right...
, caused by the earth
Earth
Earth is the third planet from the Sun, and the densest and fifth-largest of the eight planets in the Solar System. It is also the largest of the Solar System's four terrestrial planets...
spinning about its axis. Frontal zones can be contorted by geographic features like mountains and large bodies of water.
Cold front
A cold front's location is at the leading edge of the temperature drop off, which in an isotherm analysis shows up as the leading edge of the isotherm gradient, and it normally lies within a sharp surface troughTrough (meteorology)
A trough is an elongated region of relatively low atmospheric pressure, often associated with fronts.Unlike fronts, there is not a universal symbol for a trough on a weather chart. The weather charts in some countries or regions mark troughs by a line. In the United States, a trough may be marked...
. Cold fronts can move up to twice as fast as warm fronts and produce sharper changes in weather
Weather
Weather is the state of the atmosphere, to the degree that it is hot or cold, wet or dry, calm or stormy, clear or cloudy. Most weather phenomena occur in the troposphere, just below the stratosphere. Weather refers, generally, to day-to-day temperature and precipitation activity, whereas climate...
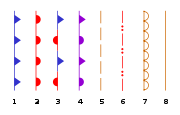
, since cold air is denser than warm air and rapidly replaces the warm air preceding the boundary. Cold fronts are typically accompanied by a narrow band of showers and thunderstorms. On weather maps, the surface position of the cold front is marked with the symbol of a blue line of triangles/spikes (pips) pointing in the direction of travel, and it is placed at the leading edge of the cooler air mass.
Warm front
Warm frontWarm front
A warm front is a density discontinuity located at the leading edge of a homogeneous warm air mass, and is typically located on the equator-facing edge of an isotherm gradient...
s are at the trailing edge of the temperature increase, which is located on the equatorward edge of the gradient in isotherms, and lie within broader troughs of low pressure than cold fronts. Warm fronts move more slowly than the cold front that usually follows because cold air is denser, and harder to displace from the Earth's surface. This also forces temperature differences across warm fronts to be broader in scale. Clouds ahead of the warm front are mostly stratiform and rainfall gradually increases as the front approaches. Fog
Fog
Fog is a collection of water droplets or ice crystals suspended in the air at or near the Earth's surface. While fog is a type of stratus cloud, the term "fog" is typically distinguished from the more generic term "cloud" in that fog is low-lying, and the moisture in the fog is often generated...
can also occur preceding a warm frontal passage. Clearing and warming is usually rapid after frontal passage. If the warm air mass is unstable, thunderstorms may be embedded among the stratiform clouds ahead of the front, and after frontal passage, thundershowers may continue. On weather maps, the surface location of a warm front is marked with a red line of half circles pointing in the direction of travel.
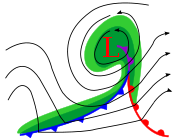
Occluded front
Occluded front
An occluded front is formed during the process of cyclogenesis when a cold front overtakes a warm front. When this occurs, the warm air is separated from the cyclone center at the Earth's surface...
is formed during the process of cyclogenesis when a cold front overtakes a warm front. The cold and warm fronts curve naturally poleward into the point of occlusion, which is also known as the triple point in meteorology
Meteorology
Meteorology is the interdisciplinary scientific study of the atmosphere. Studies in the field stretch back millennia, though significant progress in meteorology did not occur until the 18th century. The 19th century saw breakthroughs occur after observing networks developed across several countries...
. It lies within a sharp trough, but the air mass behind the boundary can be either warm or cold. In a cold occlusion, the air mass overtaking the warm front is cooler than the cool air ahead of the warm front, and plows under both air masses. In a warm occlusion, the air mass overtaking the warm front is not as cool as the cold air ahead of the warm front, and rides over the colder air mass while lifting the warm air. A wide variety of weather can be found along an occluded front, with thunderstorms possible, but usually their passage is associated with a drying of the air mass. Occluded fronts are indicated on a weather map by a purple line with alternating half-circles and triangles pointing in direction of travel. Occluded fronts usually form around mature low pressure areas.
Stationary fronts and shearlines
A stationary front is a non-moving boundary between two different air masses, neither of which is strong enough to replace the other. They tend to remain in the same area for long periods of time, usually moving in waves. There is normally a broad temperature gradient behind the boundary with more widely spaced isotherm packing. A wide variety of weather can be found along a stationary front, but usually clouds and prolonged precipitation are found there. Stationary fronts will either dissipate after several days or devolve into shear lines, but can change into a cold or warm front if conditions aloft change. Stationary fronts are marked on weather maps with alternating red half-circles and blue spikes pointing in opposite directions, indicating no significant movement.When stationary fronts become smaller in scale, degenerating to a narrow zone where wind direction changes over a short distance, they become known as shear lines. If the shear line becomes active with thunderstorms, it may support formation of a tropical storm or a regeneration of the feature back into a stationary front. A shear line is depicted as a line of red dots and dashes.
Mesoscale features
MesoscaleMesoscale meteorology
Mesoscale meteorology is the study of weather systems smaller than synoptic scale systems but larger than microscale and storm-scale cumulus systems. Horizontal dimensions generally range from around 5 kilometers to several hundred kilometers...
features are smaller than synoptic scale systems like fronts, but larger than storm-scale
Storm-scale
Storm-scale is a scale of sizes of weather systems on the order of individual thunderstorms.-See also:* Synoptic scale meteorology* Mesoscale meteorology* Microscale meteorology* Misoscale meteorology...
systems like thunderstorms. Horizontal dimensions generally range from around 50 mile
Mile
A mile is a unit of length, most commonly 5,280 feet . The mile of 5,280 feet is sometimes called the statute mile or land mile to distinguish it from the nautical mile...
s to several hundred miles.
Dry line
The dry lineDry line
A dry line separates moist air from the Gulf of Mexico and dry desert air from the south-western states . The dry line is an important factor in severe weather frequency in the Great Plains of North America...
is the boundary between dry and moist air masses east of mountain ranges with similar orientation to the Rockies
Rocky Mountains
The Rocky Mountains are a major mountain range in western North America. The Rocky Mountains stretch more than from the northernmost part of British Columbia, in western Canada, to New Mexico, in the southwestern United States...
, depicted at the leading edge of the dew point
Dew point
The dew point is the temperature to which a given parcel of humid air must be cooled, at constant barometric pressure, for water vapor to condense into liquid water. The condensed water is called dew when it forms on a solid surface. The dew point is a saturation temperature.The dew point is...
, or moisture, gradient. Near the surface, warm moist air is denser than dry air of greater temperature, and thus the warm moist air wedges under the drier air like a cold front. At higher altitudes, the warm moist air is less dense than the cooler, drier air and the boundary slope reverses. In the vicinity of the reversal aloft, severe weather is possible, especially when a triple point is formed with a cold front.
During daylight hours, drier air from aloft drifts down to the surface, causing an apparent movement of the dryline eastward. At night, the boundary reverts back to the west as there is no longer any sunshine to help mix the lower atmosphere. If enough moisture converges upon the dryline, it can be the focus of afternoon and evening thunderstorms. A dry line is depicted on United States surface analyses as a brown line with scallops, or bumps, facing into the moist sector. Dry lines are one of the few surface fronts where the special shapes along the drawn boundary do not necessarily reflect the boundary's direction of motion.
Outflow boundaries and squall lines
Mesoscale Convective System
A mesoscale convective system is a complex of thunderstorms that becomes organized on a scale larger than the individual thunderstorms but smaller than extratropical cyclones, and normally persists for several hours or more...
(MCS) forms at the point of the upper level split in the wind pattern in the area of best low level inflow. The convection then moves east and equatorward into the warm sector, parallel to low-level thickness lines. When the convection is strong and linear or curved, the MCS is called a squall line, with the feature placed at the leading edge of the significant wind shift and pressure rise. Even weaker and less organized areas of thunderstorms will lead to locally cooler air and higher pressures, and outflow boundaries exist ahead of this type of activity, "SQLN" or "SQUALL LINE", while outflow boundaries are depicted as troughs with a label of "OUTFLOW BOUNDARY" or "OUTFLOW BNDRY".
Sea and land breeze fronts
Sea breeze
A sea-breeze is a wind from the sea that develops over land near coasts. It is formed by increasing temperature differences between the land and water; these create a pressure minimum over the land due to its relative warmth, and forces higher pressure, cooler air from the sea to move inland...
fronts occur mainly on sunny days when the landmass warms up above the water temperature. Similar boundaries form downwind on lakes and rivers during the day, as well as offshore landmasses at night. Since the specific heat of water is so high, there is little diurnal change in bodies of water, even on the sunniest days. The water temperature varies less than 1 °C
Celsius
Celsius is a scale and unit of measurement for temperature. It is named after the Swedish astronomer Anders Celsius , who developed a similar temperature scale two years before his death...
(1 to 2 °F
Fahrenheit
Fahrenheit is the temperature scale proposed in 1724 by, and named after, the German physicist Daniel Gabriel Fahrenheit . Within this scale, the freezing of water into ice is defined at 32 degrees, while the boiling point of water is defined to be 212 degrees...
). By contrast, the land, with a lower specific heat, can vary several degrees in a matter of hours.
During the afternoon, air pressure decreases over the land as temperature rises. The relatively cooler air over the sea rushes in to fill the gap. The result is a relatively cool onshore wind
Wind
Wind is the flow of gases on a large scale. On Earth, wind consists of the bulk movement of air. In outer space, solar wind is the movement of gases or charged particles from the sun through space, while planetary wind is the outgassing of light chemical elements from a planet's atmosphere into space...
. This process usually reverses at night where the water temperature is higher relative to the landmass, leading to an offshore land breeze. However, if water temperatures are colder than the land at night, the sea breeze may continue, only somewhat abated. This is typically the case along the California
California
California is a state located on the West Coast of the United States. It is by far the most populous U.S. state, and the third-largest by land area...
coast, for example.
If enough moisture exists, thunderstorms can form along sea breeze fronts that then can send out outflow boundaries. This causes chaotic wind/pressure regimes if the steering flow is light. Like all other surface features, sea breeze fronts lie inside troughs of low pressure.
See also
- American Practical NavigatorBowditch's American Practical NavigatorThe American Practical Navigator , originally written by Nathaniel Bowditch, is an encyclopedia of navigation. It serves as a valuable handbook on oceanography and meteorology, and contains useful tables and a maritime glossary...
- Cyclogenesis
- Extratropical cycloneExtratropical cycloneExtratropical cyclones, sometimes called mid-latitude cyclones or wave cyclones, are a group of cyclones defined as synoptic scale low pressure weather systems that occur in the middle latitudes of the Earth having neither tropical nor polar characteristics, and are connected with fronts and...
- Synoptic scale
- Weather fronts
- Weather mapWeather mapA weather map displays various meteorological features across a particular area at a particular point in time. Such maps have been in use since the mid-19th century and are used for research and weather forecasting purposes. Maps using isotherms show temperature gradients, which can help locate...
- Outline of meteorology
External links
- "The Mid-Latitude Cyclone"
- Norwegian Cyclone Model — NWS
- Unified Surface Analysis Manual — NWS
- Unified Surface Analysis — NWS
- Glossary of Meteorology
- Cold Front Page
- Diana : A Free Meteorological Visualisation Tool