

Beta coefficient
Encyclopedia
In finance
, the Beta (β) of a stock
or portfolio
is a number describing the relation of its returns with those of the financial market
as a whole.
An asset has a Beta of zero if its returns change independently of changes in the market's returns. A positive beta means that the asset's returns generally follow the market's returns, in the sense that they both tend to be above their respective averages together, or both tend to be below their respective averages together. A negative beta means that the asset's returns generally move opposite the market's returns: one will tend to be above its average when the other is below its average.
The beta coefficient is a key parameter in the capital asset pricing model
(CAPM). It measures the part of the asset's statistical variance
that cannot be removed by the diversification
provided by the portfolio of many risky assets, because of the correlation
of its returns with the returns of the other assets that are in the portfolio. Beta can be estimated for individual companies using regression analysis
against a stock market index
.
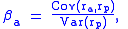
where ra measures the rate of return
of the asset, rp measures the rate of return of the portfolio, and cov(ra,rp) is the covariance
between the rates of return. The portfolio of interest in the CAPM formulation is the market portfolio that contains all risky assets, and so the rp terms in the formula are replaced by rm, the rate of return of the market.
Beta is also referred to as financial elasticity
or correlated relative volatility
, and can be referred to as a measure of the sensitivity of the asset
's returns to market returns, its non-diversifiable risk
, its systematic risk
, or market risk. On an individual asset level, measuring beta can give clues to volatility
and liquidity in the marketplace. In fund management, measuring beta is thought to separate a manager's skill from his or her willingness to take risk.
The beta coefficient was born out of linear regression
analysis. It is linked to a regression analysis of the returns of a portfolio (such as a stock index) (x-axis) in a specific period versus the returns of an individual asset (y-axis) in a specific year. The regression line is then called the Security characteristic Line
(SCL).

 is called the asset's alpha and
  is called the asset's beta coefficient. Both coefficients have an important role in Modern portfolio theory
.
For an example, in a year where the broad market or benchmark
index returns 25% above the risk free rate, suppose two managers gain 50% above the risk free rate. Because this higher return is theoretically possible merely by taking a leverage
d position in the broad market to double the beta so it is exactly 2.0, we would expect a skilled portfolio manager to have built the outperforming portfolio with a beta somewhat less than 2, such that the excess return not explained by the beta is positive. If one of the managers' portfolios has an average beta of 3.0, and the other's has a beta of only 1.5, then the CAPM simply states that the extra return of the first manager is not sufficient to compensate us for that manager's risk, whereas the second manager has done more than expected given the risk. Whether investors can expect the second manager to duplicate that performance in future periods is of course a different question.
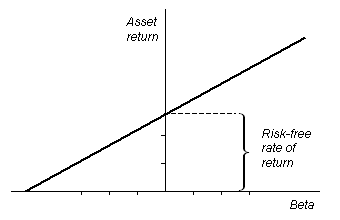
The SML
graphs the results from the capital asset pricing model (CAPM) formula. The x-axis represents the risk (beta), and the y-axis represents the expected return. The market risk premium is determined from the slope of the SML.
The relationship between β and required return is plotted on the security market line (SML) which shows expected return as a function of β. The intercept is the nominal risk-free rate available for the market, while the slope is E(Rm)− Rf. The security market line can be regarded as representing a single-factor model of the asset price, where Beta is exposure to changes in value of the Market. The equation of the SML is thus:

It is a useful tool in determining if an asset being considered for a portfolio offers a reasonable expected return for risk. Individual securities are plotted on the SML graph. If the security's risk versus expected return is plotted above the SML, it is undervalued because the investor can expect a greater return for the inherent risk. A security plotted below the SML is overvalued because the investor would be accepting a lower return for the amount of risk assumed.
 ), the relative volatility of the security (
 ), the correlation of returns (
 ) and the market volatility (
 ) is
) is

For example, if one stock has low volatility and high correlation, and the other stock has low correlation and high volatility, beta can compare their correlated volatility.
This also leads to an inequality (because is not greater than one):

In other words, beta sets a floor on volatility. For example, if market volatility is 10%, any stock (or fund) with a beta of 1 must have volatility of at least 10%.
Another way of distinguishing between beta and correlation is to think about direction and magnitude. If the market is always up 10% and a stock is always up 20%, the correlation is one (correlation measures direction, not magnitude). However, beta takes into account both direction and magnitude, so in the same example the beta would be 2 (the stock is up twice as much as the market).
such as S&P 500
as a benchmark. The benchmark should be chosen to be similar to the other assets chosen by the investor. Other choices may be an international index such as the MSCI EAFE
. The ideal index would match the portfolio; for example, for a person who owns S&P 500 index funds and gold bars, the index would combine the S&P 500 and the price of gold. In practice a standard index is used. The choice of the index need not reflect the portfolio under question; e.g., beta for gold bars compared to the S&P 500 may be low or negative carrying the information that gold does not track stocks and may provide a mechanism for reducing risk. The restriction to stocks as a benchmark is somewhat arbitrary. A model portfolio may be stocks plus bonds. Sometimes the market is defined as "all investable assets" (see Roll's critique); unfortunately, this includes lots of things for which returns may be hard to measure.
is sometimes used as a proxy for the market as a whole). A stock whose returns vary more than the market's returns over time can have a beta whose absolute value
is greater than 1.0 (whether it is, in fact, greater than 1.0 will depend on the correlation of the stock's returns and the market's returns). A stock whose returns vary less than the market's returns has a beta with an absolute value less than 1.0.
A stock with a beta of 2 has returns that change, on average, by twice the magnitude of the overall market's returns; when the market's return falls or rises by 3%, the stock's return will fall or rise (respectively) by 6% on average. (However, because beta also depends on the correlation of returns, there can be considerable variance about that average; the higher the correlation, the less variance; the lower the correlation, the higher the variance.) Beta can also be negative, meaning the stock's returns tend to move in the opposite direction of the market's returns. A stock with a beta of -3 would see its return decline 9% (on average) when the market's return goes up 3%, and would see its return climb 9% (on average) if the market's return falls by 3%.
Higher-beta stocks tend to be more volatile and therefore riskier, but provide the potential for higher returns. Lower-beta stocks pose less risk but generally offer lower returns. Some have challenged this idea, claiming that the data show little relation between beta and potential reward, or even that lower-beta stocks are both less risky and more profitable (contradicting CAPM). In the same way a stock's beta shows its relation to market shifts, it is also an indicator for required returns on investment
(ROI). Given a risk-free rate of 2%, for example, if the market (with a beta of 1) has an expected return
of 8%, a stock with a beta of 1.5 should return 11% (= 2% + 1.5(8% - 2%)).
). Further, highly rational investors should consider correlated volatility (beta) instead of simple volatility (sigma). Theoretically, a negative beta equity is possible; for example, an inverse ETF
should have negative beta to the relevant index. Also, a short position should have opposite beta.
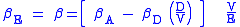
This expected return on equity, or equivalently, a firm's cost of equity
, can be estimated using the Capital Asset Pricing Model
(CAPM). According to the model, the expected return on equity is a function of a firm's equity beta (βE) which, in turn, is a function of both leverage and asset risk (βA):
where:
because:
and
An indication of the systematic riskiness attaching to the returns on ordinary shares. It equates to the asset Beta for an ungeared firm, or is adjusted upwards to reflect the extra riskiness of shares in a geared firm., i.e. the Geared Beta.
(APT) has multiple betas in its model. In contrast to the CAPM that has only one risk factor
, namely the overall market, APT has multiple risk factors. Each risk factor has a corresponding beta indicating the responsiveness of the asset being priced to that risk factor.
Multiple-factor models contradict CAPM by claiming that some other factors can return, therefore one may find two stocks (or funds) with equal beta, but one may be a better investment.
. The slope of the fitted line from the linear least-squares
calculation is the estimated Beta. The y-intercept is the alpha.
Myron Scholes
and Joseph Williams (1977) provided a model for estimating betas from nonsynchronous data.
Beta is commonly misexplained as asset volatility relative to market volatility. If that were the case it should simply be the ratio of these volatilities. In fact, the standard estimation uses the slope of the least squares regression line—this gives a slope which is less than the volatility ratio. Specifically it gives the volatility ratio multiplied by the correlation of the plotted data. To take an extreme example, something may have a beta of zero even though it is highly volatile, provided it is uncorrelated with the market. Tofallis (2008) provides a discussion of this, together with a real example involving AT&T
. The graph showing monthly returns from AT&T is visibly more volatile than the
index and yet the standard estimate of beta for this is less than one.
The relative volatility ratio described above is actually known as Total Beta (at least by appraisers who practice business valuation). Total Beta is equal to the identity: Beta/R or the standard deviation of the stock/standard deviation of the market (note: the relative volatility). Total Beta captures the security's risk as a stand-alone asset (because the correlation coefficient, R, has been removed from Beta), rather than part of a well-diversified portfolio. Because appraisers frequently value closely held companies as stand-alone assets, Total Beta is gaining acceptance in the business valuation industry. Appraisers can now use Total Beta in the following equation: Total Cost of Equity (TCOE) = risk-free rate + Total Beta*Equity Risk Premium. Once appraisers have a number of TCOE benchmarks, they can compare/contrast the risk factors present in these publicly traded benchmarks and the risks in their closely held company to better defend/support their valuations.
of the Baupost group wrote in Margin of Safety
:
"I find it preposterous that a single number reflecting past price fluctuations could be thought to completely describe the risk in a security. Beta views risk solely from the perspective of market prices, failing to take into consideration specific business
fundamentals or economic developments. The price level is also ignored, as if IBM selling at 50 dollars per share would
not be a lower-risk investment than the same IBM at 100 dollars per share. Beta fails to allow for the influence that investors
themselves can exert on the riskiness of their holdings through such efforts as proxy contests, shareholder resolutions, communications with management, or the ultimate purchase of sufficient stock to gain corporate control and with it direct access to
underlying value. Beta also assumes that the upside potential and downside risk of any investment are essentially equal,
being simply a function of that investment's volatility compared with that of the market as a whole. This too is inconsistent
with the world as we know it. The reality is that past security price volatility does not reliably predict future investment
performance (or even future volatility) and therefore is a poor measure of risk."
Finance
"Finance" is often defined simply as the management of money or “funds” management Modern finance, however, is a family of business activity that includes the origination, marketing, and management of cash and money surrogates through a variety of capital accounts, instruments, and markets created...
, the Beta (β) of a stock
Stock
The capital stock of a business entity represents the original capital paid into or invested in the business by its founders. It serves as a security for the creditors of a business since it cannot be withdrawn to the detriment of the creditors...
or portfolio
Portfolio (finance)
Portfolio is a financial term denoting a collection of investments held by an investment company, hedge fund, financial institution or individual.-Definition:The term portfolio refers to any collection of financial assets such as stocks, bonds and cash...
is a number describing the relation of its returns with those of the financial market
Financial market
In economics, a financial market is a mechanism that allows people and entities to buy and sell financial securities , commodities , and other fungible items of value at low transaction costs and at prices that reflect supply and demand.Both general markets and...
as a whole.
An asset has a Beta of zero if its returns change independently of changes in the market's returns. A positive beta means that the asset's returns generally follow the market's returns, in the sense that they both tend to be above their respective averages together, or both tend to be below their respective averages together. A negative beta means that the asset's returns generally move opposite the market's returns: one will tend to be above its average when the other is below its average.
The beta coefficient is a key parameter in the capital asset pricing model
Capital asset pricing model
In finance, the capital asset pricing model is used to determine a theoretically appropriate required rate of return of an asset, if that asset is to be added to an already well-diversified portfolio, given that asset's non-diversifiable risk...
(CAPM). It measures the part of the asset's statistical variance
Variance
In probability theory and statistics, the variance is a measure of how far a set of numbers is spread out. It is one of several descriptors of a probability distribution, describing how far the numbers lie from the mean . In particular, the variance is one of the moments of a distribution...
that cannot be removed by the diversification
Diversification (finance)
In finance, diversification means reducing risk by investing in a variety of assets. If the asset values do not move up and down in perfect synchrony, a diversified portfolio will have less risk than the weighted average risk of its constituent assets, and often less risk than the least risky of...
provided by the portfolio of many risky assets, because of the correlation
Correlation
In statistics, dependence refers to any statistical relationship between two random variables or two sets of data. Correlation refers to any of a broad class of statistical relationships involving dependence....
of its returns with the returns of the other assets that are in the portfolio. Beta can be estimated for individual companies using regression analysis
Regression analysis
In statistics, regression analysis includes many techniques for modeling and analyzing several variables, when the focus is on the relationship between a dependent variable and one or more independent variables...
against a stock market index
Stock market index
A stock market index is a method of measuring a section of the stock market. Many indices are cited by news or financial services firms and are used as benchmarks, to measure the performance of portfolios such as mutual funds....
.
Definition
The formula for the beta of an asset within a portfolio iswhere ra measures the rate of return
Rate of return
In finance, rate of return , also known as return on investment , rate of profit or sometimes just return, is the ratio of money gained or lost on an investment relative to the amount of money invested. The amount of money gained or lost may be referred to as interest, profit/loss, gain/loss, or...
of the asset, rp measures the rate of return of the portfolio, and cov(ra,rp) is the covariance
Covariance
In probability theory and statistics, covariance is a measure of how much two variables change together. Variance is a special case of the covariance when the two variables are identical.- Definition :...
between the rates of return. The portfolio of interest in the CAPM formulation is the market portfolio that contains all risky assets, and so the rp terms in the formula are replaced by rm, the rate of return of the market.
Beta is also referred to as financial elasticity
Elasticity (economics)
In economics, elasticity is the measurement of how changing one economic variable affects others. For example:* "If I lower the price of my product, how much more will I sell?"* "If I raise the price, how much less will I sell?"...
or correlated relative volatility
Volatility (finance)
In finance, volatility is a measure for variation of price of a financial instrument over time. Historic volatility is derived from time series of past market prices...
, and can be referred to as a measure of the sensitivity of the asset
Asset
In financial accounting, assets are economic resources. Anything tangible or intangible that is capable of being owned or controlled to produce value and that is held to have positive economic value is considered an asset...
's returns to market returns, its non-diversifiable risk
Risk
Risk is the potential that a chosen action or activity will lead to a loss . The notion implies that a choice having an influence on the outcome exists . Potential losses themselves may also be called "risks"...
, its systematic risk
Systematic risk
In finance, systematic risk, sometimes called market risk, aggregate risk, or undiversifiable risk, is the risk associated with aggregate market returns....
, or market risk. On an individual asset level, measuring beta can give clues to volatility
Volatility (finance)
In finance, volatility is a measure for variation of price of a financial instrument over time. Historic volatility is derived from time series of past market prices...
and liquidity in the marketplace. In fund management, measuring beta is thought to separate a manager's skill from his or her willingness to take risk.
The beta coefficient was born out of linear regression
Linear regression
In statistics, linear regression is an approach to modeling the relationship between a scalar variable y and one or more explanatory variables denoted X. The case of one explanatory variable is called simple regression...
analysis. It is linked to a regression analysis of the returns of a portfolio (such as a stock index) (x-axis) in a specific period versus the returns of an individual asset (y-axis) in a specific year. The regression line is then called the Security characteristic Line
Security characteristic line
Security characteristic line is a regression line, plotting performance of a particular security or portfolio against that of the market portfolio at every point in time. The SCL is plotted on a graph where the Y-axis is the excess return on a security over the risk-free return and the X-axis is...
(SCL).
is called the asset's alpha and is called the asset's beta coefficient. Both coefficients have an important role in Modern portfolio theoryModern portfolio theory
Modern portfolio theory is a theory of investment which attempts to maximize portfolio expected return for a given amount of portfolio risk, or equivalently minimize risk for a given level of expected return, by carefully choosing the proportions of various assets...
.
For an example, in a year where the broad market or benchmark
Benchmark (surveying)
The term bench mark, or benchmark, originates from the chiseled horizontal marks that surveyors made in stone structures, into which an angle-iron could be placed to form a "bench" for a leveling rod, thus ensuring that a leveling rod could be accurately repositioned in the same place in the future...
index returns 25% above the risk free rate, suppose two managers gain 50% above the risk free rate. Because this higher return is theoretically possible merely by taking a leverage
Leverage (finance)
In finance, leverage is a general term for any technique to multiply gains and losses. Common ways to attain leverage are borrowing money, buying fixed assets and using derivatives. Important examples are:* A public corporation may leverage its equity by borrowing money...
d position in the broad market to double the beta so it is exactly 2.0, we would expect a skilled portfolio manager to have built the outperforming portfolio with a beta somewhat less than 2, such that the excess return not explained by the beta is positive. If one of the managers' portfolios has an average beta of 3.0, and the other's has a beta of only 1.5, then the CAPM simply states that the extra return of the first manager is not sufficient to compensate us for that manager's risk, whereas the second manager has done more than expected given the risk. Whether investors can expect the second manager to duplicate that performance in future periods is of course a different question.
Security market line
 |
The SML
Security market line
Security market line is the graphical representation of the Capital asset pricing model. It displays the expected rate of return of an individual security as a function of systematic, non-diversifiable risk .-See also:...
graphs the results from the capital asset pricing model (CAPM) formula. The x-axis represents the risk (beta), and the y-axis represents the expected return. The market risk premium is determined from the slope of the SML.
The relationship between β and required return is plotted on the security market line (SML) which shows expected return as a function of β. The intercept is the nominal risk-free rate available for the market, while the slope is E(Rm)− Rf. The security market line can be regarded as representing a single-factor model of the asset price, where Beta is exposure to changes in value of the Market. The equation of the SML is thus:
It is a useful tool in determining if an asset being considered for a portfolio offers a reasonable expected return for risk. Individual securities are plotted on the SML graph. If the security's risk versus expected return is plotted above the SML, it is undervalued because the investor can expect a greater return for the inherent risk. A security plotted below the SML is overvalued because the investor would be accepting a lower return for the amount of risk assumed.
Beta, volatility and correlation
A misconception about beta is that it measures the volatility of a security relative to the volatility of the market. If this were true, then a security with a beta of 1 would have the same volatility of returns as the volatility of market returns. In fact, this is not the case, because beta also incorporates the correlation of returns between the security and the market. By the definition of beta, the formula relating beta (), the relative volatility of the security (), the correlation of returns () and the market volatility () isFor example, if one stock has low volatility and high correlation, and the other stock has low correlation and high volatility, beta can compare their correlated volatility.
This also leads to an inequality (because
is not greater than one):In other words, beta sets a floor on volatility. For example, if market volatility is 10%, any stock (or fund) with a beta of 1 must have volatility of at least 10%.
Another way of distinguishing between beta and correlation is to think about direction and magnitude. If the market is always up 10% and a stock is always up 20%, the correlation is one (correlation measures direction, not magnitude). However, beta takes into account both direction and magnitude, so in the same example the beta would be 2 (the stock is up twice as much as the market).
Choice of benchmark
Published betas typically use a stock market indexStock market index
A stock market index is a method of measuring a section of the stock market. Many indices are cited by news or financial services firms and are used as benchmarks, to measure the performance of portfolios such as mutual funds....
such as S&P 500
S&P 500
The S&P 500 is a free-float capitalization-weighted index published since 1957 of the prices of 500 large-cap common stocks actively traded in the United States. The stocks included in the S&P 500 are those of large publicly held companies that trade on either of the two largest American stock...
as a benchmark. The benchmark should be chosen to be similar to the other assets chosen by the investor. Other choices may be an international index such as the MSCI EAFE
MSCI EAFE
The MSCI EAFE Index is a stock market index that is designed to measure the equity market performance of developed markets outside of the U.S. & Canada...
. The ideal index would match the portfolio; for example, for a person who owns S&P 500 index funds and gold bars, the index would combine the S&P 500 and the price of gold. In practice a standard index is used. The choice of the index need not reflect the portfolio under question; e.g., beta for gold bars compared to the S&P 500 may be low or negative carrying the information that gold does not track stocks and may provide a mechanism for reducing risk. The restriction to stocks as a benchmark is somewhat arbitrary. A model portfolio may be stocks plus bonds. Sometimes the market is defined as "all investable assets" (see Roll's critique); unfortunately, this includes lots of things for which returns may be hard to measure.
Investing
By definition, the market itself has a beta of 1.0, and individual stocks are ranked according to how much they deviate from the macro market (for simplicity purposes, the S&P 500S&P 500
The S&P 500 is a free-float capitalization-weighted index published since 1957 of the prices of 500 large-cap common stocks actively traded in the United States. The stocks included in the S&P 500 are those of large publicly held companies that trade on either of the two largest American stock...
is sometimes used as a proxy for the market as a whole). A stock whose returns vary more than the market's returns over time can have a beta whose absolute value
Absolute value
In mathematics, the absolute value |a| of a real number a is the numerical value of a without regard to its sign. So, for example, the absolute value of 3 is 3, and the absolute value of -3 is also 3...
is greater than 1.0 (whether it is, in fact, greater than 1.0 will depend on the correlation of the stock's returns and the market's returns). A stock whose returns vary less than the market's returns has a beta with an absolute value less than 1.0.
A stock with a beta of 2 has returns that change, on average, by twice the magnitude of the overall market's returns; when the market's return falls or rises by 3%, the stock's return will fall or rise (respectively) by 6% on average. (However, because beta also depends on the correlation of returns, there can be considerable variance about that average; the higher the correlation, the less variance; the lower the correlation, the higher the variance.) Beta can also be negative, meaning the stock's returns tend to move in the opposite direction of the market's returns. A stock with a beta of -3 would see its return decline 9% (on average) when the market's return goes up 3%, and would see its return climb 9% (on average) if the market's return falls by 3%.
Higher-beta stocks tend to be more volatile and therefore riskier, but provide the potential for higher returns. Lower-beta stocks pose less risk but generally offer lower returns. Some have challenged this idea, claiming that the data show little relation between beta and potential reward, or even that lower-beta stocks are both less risky and more profitable (contradicting CAPM). In the same way a stock's beta shows its relation to market shifts, it is also an indicator for required returns on investment
Rate of return
In finance, rate of return , also known as return on investment , rate of profit or sometimes just return, is the ratio of money gained or lost on an investment relative to the amount of money invested. The amount of money gained or lost may be referred to as interest, profit/loss, gain/loss, or...
(ROI). Given a risk-free rate of 2%, for example, if the market (with a beta of 1) has an expected return
Expected return
The expected return is the weighted-average outcome in gambling, probability theory, economics or finance.It isthe average of a probability distribution of possible returns, calculated by using the following formula:...
of 8%, a stock with a beta of 1.5 should return 11% (= 2% + 1.5(8% - 2%)).
Academic theory
Academic theory claims that higher-risk investments should have higher returns over the long-term. Wall Street has a saying that "higher return requires higher risk", not that a risky investment will automatically do better. Some things may just be poor investments (e.g., playing rouletteRoulette
Roulette is a casino game named after a French diminutive for little wheel. In the game, players may choose to place bets on either a single number or a range of numbers, the colors red or black, or whether the number is odd or even....
). Further, highly rational investors should consider correlated volatility (beta) instead of simple volatility (sigma). Theoretically, a negative beta equity is possible; for example, an inverse ETF
Inverse exchange-traded fund
An inverse exchange-traded fund is an exchange-traded fund , traded on a public stock market, which is designed to perform as the inverse of whatever index or benchmark it is designed to track...
should have negative beta to the relevant index. Also, a short position should have opposite beta.
This expected return on equity, or equivalently, a firm's cost of equity
Cost of equity
In finance, the cost of equity is the return a firm theoretically pays to its equity investors, i.e., shareholders, to compensate for the risk they undertake by investing their capital. Firms need to acquire capital from others to operate and grow...
, can be estimated using the Capital Asset Pricing Model
Capital asset pricing model
In finance, the capital asset pricing model is used to determine a theoretically appropriate required rate of return of an asset, if that asset is to be added to an already well-diversified portfolio, given that asset's non-diversifiable risk...
(CAPM). According to the model, the expected return on equity is a function of a firm's equity beta (βE) which, in turn, is a function of both leverage and asset risk (βA):

where:
- KE = firm's cost of equity
- RF = risk-free rateRisk-free interest rateRisk-free interest rate is the theoretical rate of return of an investment with no risk of financial loss. The risk-free rate represents the interest that an investor would expect from an absolutely risk-free investment over a given period of time....
(the rate of return on a "risk free investment"; e.g., U.S. Treasury Bonds) - RM = return on the market portfolio
-
because:

and
- Firm Value (V) + Cash and Risk-Free Securities = Debt Value (D) + Equity Value (E)
An indication of the systematic riskiness attaching to the returns on ordinary shares. It equates to the asset Beta for an ungeared firm, or is adjusted upwards to reflect the extra riskiness of shares in a geared firm., i.e. the Geared Beta.
Multiple beta model
The arbitrage pricing theoryArbitrage pricing theory
In finance, arbitrage pricing theory is a general theory of asset pricing that holds that the expected return of a financial asset can be modeled as a linear function of various macro-economic factors or theoretical market indices, where sensitivity to changes in each factor is represented by a...
(APT) has multiple betas in its model. In contrast to the CAPM that has only one risk factor
Risk factor
In epidemiology, a risk factor is a variable associated with an increased risk of disease or infection. Sometimes, determinant is also used, being a variable associated with either increased or decreased risk.-Correlation vs causation:...
, namely the overall market, APT has multiple risk factors. Each risk factor has a corresponding beta indicating the responsiveness of the asset being priced to that risk factor.
Multiple-factor models contradict CAPM by claiming that some other factors can return, therefore one may find two stocks (or funds) with equal beta, but one may be a better investment.
Estimation of beta
To estimate beta, one needs a list of returns for the asset and returns for the index; these returns can be daily, weekly or any period. Then one uses standard formulas from linear regressionLinear regression
In statistics, linear regression is an approach to modeling the relationship between a scalar variable y and one or more explanatory variables denoted X. The case of one explanatory variable is called simple regression...
. The slope of the fitted line from the linear least-squares
Linear least squares
In statistics and mathematics, linear least squares is an approach to fitting a mathematical or statistical model to data in cases where the idealized value provided by the model for any data point is expressed linearly in terms of the unknown parameters of the model...
calculation is the estimated Beta. The y-intercept is the alpha.
Myron Scholes
Myron Scholes
Myron Samuel Scholes is a Canadian-born American financial economist who is best known as one of the authors of the Black–Scholes equation. In 1997 he was awarded the Nobel Memorial Prize in Economic Sciences for a method to determine the value of derivatives...
and Joseph Williams (1977) provided a model for estimating betas from nonsynchronous data.
Beta is commonly misexplained as asset volatility relative to market volatility. If that were the case it should simply be the ratio of these volatilities. In fact, the standard estimation uses the slope of the least squares regression line—this gives a slope which is less than the volatility ratio. Specifically it gives the volatility ratio multiplied by the correlation of the plotted data. To take an extreme example, something may have a beta of zero even though it is highly volatile, provided it is uncorrelated with the market. Tofallis (2008) provides a discussion of this, together with a real example involving AT&T
AT&T
AT&T Inc. is an American multinational telecommunications corporation headquartered in Whitacre Tower, Dallas, Texas, United States. It is the largest provider of mobile telephony and fixed telephony in the United States, and is also a provider of broadband and subscription television services...
. The graph showing monthly returns from AT&T is visibly more volatile than the
index and yet the standard estimate of beta for this is less than one.
The relative volatility ratio described above is actually known as Total Beta (at least by appraisers who practice business valuation). Total Beta is equal to the identity: Beta/R or the standard deviation of the stock/standard deviation of the market (note: the relative volatility). Total Beta captures the security's risk as a stand-alone asset (because the correlation coefficient, R, has been removed from Beta), rather than part of a well-diversified portfolio. Because appraisers frequently value closely held companies as stand-alone assets, Total Beta is gaining acceptance in the business valuation industry. Appraisers can now use Total Beta in the following equation: Total Cost of Equity (TCOE) = risk-free rate + Total Beta*Equity Risk Premium. Once appraisers have a number of TCOE benchmarks, they can compare/contrast the risk factors present in these publicly traded benchmarks and the risks in their closely held company to better defend/support their valuations.
Extreme and interesting cases
- Beta has no upper or lower bound, and betas as large as 3 or 4 will occur with highly volatile stocks.
- Beta can be zero. Some zero-beta assets are risk-free, such as treasury bonds and cash. However, simply because a beta is zero does not mean that it is risk-free. A beta can be zero simply because the correlation between that item's returns and the market's returns is zero. An example would be betting on horse racing. The correlation with the market will be zero, but it is certainly not a risk-free endeavor.
- A negative beta simply means that the stock is inversely correlated with the market.
- A negative beta might occur even when both the benchmark index and the stock under consideration have positive returns. It is possible that lower positive returns of the index coincide with higher positive returns of the stock, or vice versa. The slope of the regression line in such a case will be negative.
- If it were possible to invest in an asset with positive returns and beta −1 as well as in the market portfolio (which by definition has beta 1), it would be possible to achieve a risk-free profit. With the use of leverage, this profit would be unlimited. Of course, in practice it is impossible to find an asset with beta −1 that does not introduce additional costs or risks.
- Using beta as a measure of relative risk has its own limitations. Most analyses consider only the magnitude of beta. Beta is a statistical variable and should be considered with its statistical significance (R square value of the regression line). Higher R square value implies higher correlationCorrelationIn statistics, dependence refers to any statistical relationship between two random variables or two sets of data. Correlation refers to any of a broad class of statistical relationships involving dependence....
and a stronger relationship between returns of the asset and benchmark index. - If beta is a result of regression of one stock against the market where it is quoted, betas from different countries are not comparable.
- Staple stocks are thought to be less affected by cycles and usually have lower beta. Procter & GambleProcter & GambleProcter & Gamble is a Fortune 500 American multinational corporation headquartered in downtown Cincinnati, Ohio and manufactures a wide range of consumer goods....
, which makes soap, is a classic example. Other similar ones are Philip MorrisAltria GroupAltria Group, Inc. is based in Henrico County, Virginia, and is the parent company of Philip Morris USA, John Middleton, Inc., U.S. Smokeless Tobacco Company, Inc., Philip Morris Capital Corporation, and Chateau Ste. Michelle Wine Estates. It is one of the world's largest tobacco corporations...
(tobacco) and Johnson & JohnsonJohnson & JohnsonJohnson & Johnson is an American multinational pharmaceutical, medical devices and consumer packaged goods manufacturer founded in 1886. Its common stock is a component of the Dow Jones Industrial Average and the company is listed among the Fortune 500....
(Health & Consumer Goods). Utility stocks are thought to be less cyclical and have lower beta as well, for similar reasons. - 'Tech' stocks typically have higher beta. An example is the dot-com bubbleDot-com bubbleThe dot-com bubble was a speculative bubble covering roughly 1995–2000 during which stock markets in industrialized nations saw their equity value rise rapidly from growth in the more...
. Although tech did very well in the late 1990s, it also fell sharply in the early 2000s, much worse than the decline of the overall market. - Foreign stocks may provide some diversification. World benchmarks such as S&P Global 100S&P Global 100The S&P Global 100 Index is a stock market index of global stocks from Standard & Poor's.The S&P Global 100 measures the performance of 100 multi-national companies. It includes 100 large-cap companies from the S&P Global 1200 whose businesses are global in nature, and that derive a substantial...
have slightly lower betas than comparable US-only benchmarks such as S&P 100S&P 100The S&P 100 Index is a stock market index of United States stocks maintained by Standard & Poor's.Index options on the S&P 100 are traded with the ticker symbol "OEX". Because of the popularity of these options, investors often refer to the index by its ticker symbol.The S&P 100, a subset of the...
. However, this effect is not as good as it used to be; the various markets are now fairly correlated, especially the US and Western Europe.
Criticism
Seth KlarmanSeth Klarman
Seth Klarman is the founder and president of the Baupost Group, a Boston-based private investment partnership, and the author of a book on value investing.-Career:...
of the Baupost group wrote in Margin of Safety
Margin of safety
Margin of safety is the difference between the intrinsic value of a stock and its market price..Another definition: In Break even analysis , margin of safety is how much output or sales level can fall before a business reaches its breakeven point.-History:Benjamin Graham and David Dodd, founders...
:
"I find it preposterous that a single number reflecting past price fluctuations could be thought to completely describe the risk in a security. Beta views risk solely from the perspective of market prices, failing to take into consideration specific business
fundamentals or economic developments. The price level is also ignored, as if IBM selling at 50 dollars per share would
not be a lower-risk investment than the same IBM at 100 dollars per share. Beta fails to allow for the influence that investors
themselves can exert on the riskiness of their holdings through such efforts as proxy contests, shareholder resolutions, communications with management, or the ultimate purchase of sufficient stock to gain corporate control and with it direct access to
underlying value. Beta also assumes that the upside potential and downside risk of any investment are essentially equal,
being simply a function of that investment's volatility compared with that of the market as a whole. This too is inconsistent
with the world as we know it. The reality is that past security price volatility does not reliably predict future investment
performance (or even future volatility) and therefore is a poor measure of risk."
See also
- Alpha (finance)
- Capital asset pricing modelCapital asset pricing modelIn finance, the capital asset pricing model is used to determine a theoretically appropriate required rate of return of an asset, if that asset is to be added to an already well-diversified portfolio, given that asset's non-diversifiable risk...
- CSS Theory - Beta
- Cost of capitalCost of capitalThe cost of capital is a term used in the field of financial investment to refer to the cost of a company's funds , or, from an investor's point of view "the shareholder's required return on a portfolio of all the company's existing securities"...
- Hamada's equationHamada's EquationIn corporate finance, Hamada’s equation, named after Professor Robert Hamada, is used to separate the financial risk of a levered firm from its business risk. The equation combines the Modigliani-Miller theorem with the capital asset pricing model...
- Treynor ratioTreynor ratioThe Treynor ratio , named after Jack L. Treynor, is a measurement of the returns earned in excess of that which could have been earned on an investment that has no diversifiable risk , per each unit of market risk assumed.The Treynor ratio relates...
- WACCWeighted average cost of capitalThe weighted average cost of capital is the rate that a company is expected to pay on average to all its security holders to finance its assets....
- Beta Coefficient via Wikinvest
External links
- ETFs & Diversification: A Study of Correlations on indexuniverse.com
- The Beta Brief Commentary/analysis on matters related to beta including ETFs.
- Paper describing the effect of leverage and default risk on beta