
Regression analysis
Overview
Statistics
Statistics is the study of the collection, organization, analysis, and interpretation of data. It deals with all aspects of this, including the planning of data collection in terms of the design of surveys and experiments....
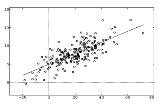
, regression analysis includes many techniques for modeling and analyzing several variables, when the focus is on the relationship between a dependent variable and one or more independent variable
Independent variable
The terms "dependent variable" and "independent variable" are used in similar but subtly different ways in mathematics and statistics as part of the standard terminology in those subjects...
s. More specifically, regression analysis helps one understand how the typical value of the dependent variable changes when any one of the independent variables is varied, while the other independent variables are held fixed.
Unanswered Questions
Discussions