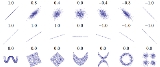
Probability theory is the branch of mathematics concerned with analysis of Statistical randomness phenomena. The central objects of probability theory are random variables, stochastic processes, and event s: mathematical abstractions of determinism events or measured quantities that may either be single occurrences or evolve over time in an a... and statistics
Statistics
Statistics is a Mathematics pertaining to the collection, analysis, interpretation or explanation, and presentation of data. It also provides tools for prediction and forecasting based on data.... , correlation (often measured as a correlation coefficient) indicates the strength and direction of a linear relationship between two random variables. That is in contrast with the usage of the term in colloquial speech, denoting any relationship, not necessarily linear. In general statistical usage, correlation or co-relation refers to the departure of two random variables from independence.
Probability theory is the branch of mathematics concerned with analysis of Statistical randomness phenomena. The central objects of probability theory are random variables, stochastic processes, and event s: mathematical abstractions of determinism events or measured quantities that may either be single occurrences or evolve over time in an a... and statistics
Statistics
Statistics is a Mathematics pertaining to the collection, analysis, interpretation or explanation, and presentation of data. It also provides tools for prediction and forecasting based on data.... , correlation (often measured as a correlation coefficient) indicates the strength and direction of a linear relationship between two random variables. That is in contrast with the usage of the term in colloquial speech, denoting any relationship, not necessarily linear. In general statistical usage, correlation or co-relation refers to the departure of two random variables from independence. In this broad sense there are several coefficients, measuring the degree of correlation, adapted to the nature of the data.
In statistics, the Karl Pearson product-moment correlation coefficient is a common measure of the correlation between two variables X and Y.... , which is obtained by dividing the covariance
Covariance
In probability theory and statistics, covariance is a measure of how much two variables change together .If two variables tend to vary together , then the covariance between the two variables will be positive.... of the two variables by the product of their standard deviation
Standard deviation
In statistics, standard deviation is a simple measure of the variability or statistical dispersion of a data set. A low standard deviation indicates that all of the data points are very close to the same value , while high standard deviation indicates that the data are ?spread out? over a large range of values.... s. Despite its name, it was first introduced by Francis Galton
Francis Galton
Sir Francis Galton Fellow of the Royal Society , Cousin#Half_cousins of Charles Darwin, was an England Victorian era polymath, anthropologist, Eugenics, tropical List of explorers, geographer, inventor, meteorologist, proto-geneticist, Psychometrics, and statistician.... .
Pearson's product-moment coefficient
Mathematical properties
The correlation coefficient ?X, Y between two random variables X and Y with expected value
Expected value
In probability theory and statistics, the expected value of a random variable is the Lebesgue integral of the random variable with respect to its probability measure.... s µX and µY and standard deviation
Standard deviation
In statistics, standard deviation is a simple measure of the variability or statistical dispersion of a data set. A low standard deviation indicates that all of the data points are very close to the same value , while high standard deviation indicates that the data are ?spread out? over a large range of values.... s sX and sY is defined as:
In probability theory and statistics, the expected value of a random variable is the Lebesgue integral of the random variable with respect to its probability measure.... operator and cov means covariance
Covariance
In probability theory and statistics, covariance is a measure of how much two variables change together .If two variables tend to vary together , then the covariance between the two variables will be positive.... . A widely used alternative notation is
Since µX = E(X),
sX2 = E[(X - E(X))2] = E(X2) − E2(X) and
likewise for Y, we may also write
The correlation is defined only if both of the standard deviations are finite and both of them are nonzero. It is a corollary of the Cauchy-Schwarz inequality that the correlation cannot exceed 1 in absolute value
Absolute value
In mathematics, the absolute value of a real number is its numerical value without regard to its Negative and non-negative numbers. So, for example, 3 is the absolute value of both 3 and -3.... .
The correlation is 1 in the case of an increasing linear relationship, −1 in the case of a decreasing linear relationship, and some value in between in all other cases, indicating the degree of linear dependence between the variables. The closer the coefficient is to either −1 or 1, the stronger the correlation between the variables.
In probability theory, to say that two event s are independent intuitively means that the occurrence of one event makes it neither more nor less probable that the other occurs.... then the correlation is 0, but the converse is not true because the correlation coefficient detects only linear dependencies between two variables. Here is an example: Suppose the random variable X is uniformly distributed on the interval from −1 to 1, and Y = X2. Then Y is completely determined by X, so that X and Y are dependent, but their correlation is zero; they are uncorrelated
Uncorrelated
In probability theory and statistics, two real-valued random variables are said to be uncorrelated if their covariance is zero.Uncorrelated random variables have a correlation of zero, except in the trivial case when both variables have variance zero .... . However, in the special case when X and Y are jointly normal, uncorrelatedness is equivalent to independence.
A correlation between two variables is diluted in the presence of measurement error around estimates of one or both variables, in which case disattenuation
Disattenuation
In measurement and statistics, disattenuation of a correlation between two sets of parameters or measures is the estimation of the correlation in a manner that accounts for measurement error contained within the estimator of those parameters.... provides a more accurate coefficient.
In statistics, the Karl Pearson product-moment correlation coefficient is a common measure of the correlation between two variables X and Y.... can be used to estimate the correlation of X and Y . The Pearson coefficient is
also known as the "sample correlation coefficient". The Pearson correlation coefficient is then the best estimate of the correlation of X and Y . The Pearson correlation coefficient is written:
In mathematics and statistics, the arithmetic mean of a list of numbers is the sum of all of the list divided by the number of items in the list.... s of X and Y , sx and sy are the sample standard deviation
Standard deviation
In statistics, standard deviation is a simple measure of the variability or statistical dispersion of a data set. A low standard deviation indicates that all of the data points are very close to the same value , while high standard deviation indicates that the data are ?spread out? over a large range of values.... s of X and Y and the sum is from i = 1 to n. As with the population correlation, we may rewrite this as
Again, as is true with the population correlation, the absolute value of the sample correlation must be less than or equal to 1. Though the above formula conveniently suggests a single-pass algorithm for calculating sample correlations, it is notorious for its numerical instability
Numerical stability
In the mathematics subfield of numerical analysis, numerical stability is a desirable property of numerical algorithms. The precise definition of stability depends on the context, but it is related to the accuracy of the algorithm.... (see below for something more accurate).
In statistics, the coefficient of determination, R2 is used in the context of statistical models whose main purpose is the prediction of future outcomes on the basis of other related information.... , is the fraction of the variance in yi that is accounted for by a linear fit of xi to yi . This is written
In statistics, linear regression is used for two things;Linear regression is a form of regression analysis in which the relationship between one or more independent variables and another variable, called the dependent variable, is modeled by a least squares function, called linear regression equation.... of xi on yi by the equation
Equation
An equation is a mathematics Proposition, in table of mathematical symbols, that two things are exactly the same . Equations are written with an equal sign, as in... y = a + bx:
and sy2 is just the variance of y:
Note that since the sample correlation coefficient is symmetric in xi and yi , we will get the same value for a fit of yi to xi :
This equation also gives an intuitive idea of the correlation coefficient for higher dimension
Dimension
In mathematics, the dimension of a space is roughly defined as the minimum number of coordinates needed to specify every point within it. For example: a point on the unit circle in the plane can be specified by two Cartesian coordinates but one can make do with a single coordinate , so the circle is 1-dimensional even though it exists in... s. Just as the above described sample correlation coefficient is the fraction of variance accounted for by the fit of a 1-dimensional linear submanifold
Euclidean space
Around 300 Before Christ, the Ancient Greece mathematician Euclid undertook a study of relationships among distances and angles, first in a plane and then in space.... to a set of 2-dimensional vectors (xi , yi ), so we can define a correlation coefficient for a fit of an m-dimensional linear submanifold to a set of n-dimensional vectors. For example, if we fit a plane z = a + bx + cy to a set of data (xi , yi , zi ) then the correlation coefficient of z to x and y is
The distribution of the correlation coefficient has been examined by R. A. Fisher
and A. K. Gayen.
Geometric Interpretation of correlation
For centered data (i.e., data which have been shifted by the sample mean so as to have an average of zero), the correlation coefficient can also be viewed as the cosine of the angle
Angle
In geometry and trigonometry, an angle is the figure formed by two Ray sharing a common endpoint, called the vertex of the angle . The magnitude of the angle is the "amount of rotation" that separates the two rays, and can be measured by considering the length of circular arc swept out when one ray is rotated about the vertex to coincide... between the two vectors of samples drawn from the two random variables.
Some practitioners prefer an uncentered (non-Pearson-compliant) correlation coefficient. See the example below for a comparison.
As an example, suppose five countries are found to have gross national products of 1, 2, 3, 5, and 8 billion dollars, respectively. Suppose these same five countries (in the same order) are found to have 11%, 12%, 13%, 15%, and 18% poverty. Then let x and y be ordered 5-element vectors containing the above data: x = (1, 2, 3, 5, 8) and y = (0.11, 0.12, 0.13, 0.15, 0.18).
By the usual procedure for finding the angle between two vectors (see dot product
Dot product
In mathematics, the dot product, also known as the scalar product, is an operation which takes two vector over the real numbers R and returns a real-valued scalar quantity.... ), the uncentered correlation coefficient is:
Note that the above data were deliberately chosen to be perfectly correlated: y = 0.10 + 0.01 x. The Pearson correlation coefficient must therefore be exactly one. Centering the data (shifting x by E(x) = 3.8 and y by E(y) = 0.138) yields x = (−2.8, −1.8, −0.8, 1.2, 4.2) and y = (−0.028, −0.018, −0.008, 0.012, 0.042), from which
as expected.
Motivation for the form of the coefficient of correlation
Another motivation for correlation comes from inspecting the method of simple linear regression
Linear regression
In statistics, linear regression is used for two things;Linear regression is a form of regression analysis in which the relationship between one or more independent variables and another variable, called the dependent variable, is modeled by a least squares function, called linear regression equation.... . As above, X is the vector of independent variables, , and Y of the dependent variables, , and a simple linear relationship between X and Y is sought, through a least-squares method on the estimate of Y:
Then, the equation of the least-squares line can be derived to be of the form:
which can be rearranged in the form:
where r has the familiar form mentioned above
Interpretation of the size of a correlation
Correlation
Negative
Positive
Small
−0.3 to −0.1
0.1 to 0.3
Medium
−0.5 to −0.3
0.3 to 0.5
Large
−1.0 to −0.5
0.5 to 1.0
Several authors have offered guidelines for the interpretation of a correlation coefficient. Cohen (1988), has observed, however, that all such criteria are in some ways arbitrary and should not be observed too strictly. This is because the interpretation of a correlation coefficient depends on the context and purposes. A correlation of 0.9 may be very low if one is verifying a physical law using high-quality instruments, but may be regarded as very high in the social sciences where there may be a greater contribution from complicating factors.
Along this vein, it is important to remember that "large" and "small" should not be taken as synonyms for "good" and "bad" in terms of determining that a correlation is of a certain size. For example, a correlation of 1.0 or −1.0 indicates that the two variables analyzed are equivalent modulo scaling. Scientifically, this more frequently indicates a trivial result than a profound one. For example, consider discovering a correlation of 1.0 between how many feet tall a group of people are and the number of inches from the bottom of their feet to the top of their heads.
Parametric statistics is a branch of statistics that assumes data come from a type of probability distribution and makes inference about the parameters of the distribution.... and when distributions are not normal it may be less useful than non-parametric
Non-parametric statistics
Non-parametric statistics uses distribution free methods which do not rely on assumptions that the data are drawn from a given probability distribution.... correlation methods, such as Chi-square
Chi-square test
A chi-square test is any statistical hypothesis test in which the test statistic has a chi-square distribution when the null hypothesis is true, or any in which the probability distribution of the test statistic can be made to approximate a chi-square distribution as closely as desired by making the sample size large enough.... , Point biserial correlation
Point-biserial correlation coefficient
The point biserial correlation coefficient is a correlation coefficient used when one variable is dichotomy; Y can either be 'naturally' dichotomous, like gender, or an artificially dichotomized variable.... , Spearman's ρ
Spearman's rank correlation coefficient
In statistics, Spearman's rank correlation coefficient or Spearman's rho, named after Charles Spearman and often denoted by the Greek letter rho or as , is a non-parametric statistics measure of correlation – that is, it assesses how well an arbitrary monotonic function could describe the relationship between two variables, witho... , Kendall's τ, and Goodman and Kruskal's lambda
Goodman and Kruskal's lambda
In probability theory and statistics, Goodman & Kruskal's lambda is a measure of proportional reduction in error in cross tabulation analysis. For any sample with a level of measurement#Nominal_measurement independent variable and dependent variable , it indicates the extent to which the modal categories and frequencies for each value of the... . They are a little less powerful
Statistical power
The power of aStatistical hypothesis testing is the probability that the test will reject a false null hypothesis . As power increases, the chances of a Type II error decrease.... than parametric methods if the assumptions underlying the latter are met, but are less likely to give distorted results when the assumptions fail.
Other measures of dependence among random variables
The information given by a correlation coefficient is not enough to define the dependence structure between random variables. The correlation coefficient completely defines the dependence structure only in very particular cases, for example when the cumulative distribution function
Cumulative distribution function
In probability theory and statistics, the cumulative distribution function or just distribution function, completely describes the probability distribution of a real-valued random variable X.... s are the multivariate normal distribution
Multivariate normal distribution
In probability theory and statistics, a multivariate normal distribution, sometimes also called a multivariate Gaussian distribution, is a generalization of the one-dimensional normal distribution to higher dimensions.... s. (See diagram above.) In the case of elliptic distributions it characterizes the (hyper-)ellipses of equal density, however, it does not completely characterize the dependence structure (for example, the a multivariate t-distribution's degrees of freedom determine the level of tail dependence).
To get a measure for more general dependencies in the data (also nonlinear) it is better to use the correlation ratio
Correlation ratio
In statistics, the correlation ratio is a measure of the relationship between the statistical dispersion within individual categories and the dispersion across the whole population or sample.... which is able to detect almost any functional dependency, or the entropy
Information entropy
In information theory, entropy is a measure of the uncertainty associated with a random variable. The term by itself in this context usually refers to the Shannon entropy, which quantifies, in the sense of an expected value, the self-information contained in a message, usually in units such as bits.... -based mutual information
Mutual information
In probability theory and information theory, the mutual information of two random variables is a quantity that measures the mutual dependence of the two variables.... /total correlation
Total correlation
In probability theory and in particular in information theory, total correlation is one of several generalizations of the mutual information. It is also known as the multivariate constraint or multiinformation .... which is capable of detecting even more general dependencies. The latter are sometimes referred to as multi-moment correlation measures, in comparison to those that consider only 2nd moment (pairwise or quadratic) dependence.
In statistics, polychoric correlation is a technique for estimating the correlation between two theorised normal distribution continuous latent variables, from two observed level of measurements.... is another correlation applied to ordinal data that aims to estimate the correlation between theorised latent variables.
One way to capture a more complete view of dependence structure is to consider a copula
Copula (statistics)
In statistics, a copula is used as a general way of formulating a Joint probability distribution#Multidimensional distributions in such a way that various general types of dependence can be represented.... between them.
Correlation matrices
The correlation matrix of n random variables X1, ..., Xn is the n × n matrix whose i,j entry is corr(Xi, Xj). If the measures of correlation used are product-moment coefficients, the correlation matrix is the same as the covariance matrix
Covariance matrix
In statistics and probability theory, the covariance matrix is a matrix of covariances between elements of a vector. It is the natural generalization to higher dimensions of the concept of the variance of a scalar -valued random variable.... of the standardized random variables Xi /SD(Xi) for i = 1, ..., n. Consequently it is necessarily a positive-semidefinite matrix.
The correlation matrix is symmetric because the correlation between and is the same as the correlation between and .
Removing correlation
It is always possible to remove the correlation between zero-mean random variables with a linear transformation, even if the relationship between the variables is nonlinear. Suppose a vector of n random variables is sampled m times. Let X be a matrix where is the jth variable of sample i. Let be an r by c matrix with every element 1. Then D is the data transformed so every random variable has zero mean, and T is the data transformed so all variables have zero mean, unit variance, and zero correlation with all other variables. The transformed variables will be uncorrelated, even though they may not be independent
Statistical independence
In probability theory, to say that two event s are independent intuitively means that the occurrence of one event makes it neither more nor less probable that the other occurs.... .
where an exponent of -1/2 represents the matrix square root of the inverse of a matrix. The covariance matrix of T will be the identity matrix. If a new data sample x is a row vector of n elements, then the same transform can be applied to x to get the transformed vectors d and t:
Common misconceptions about correlation
Correlation and causality
The conventional dictum that "correlation does not imply causation" means that correlation cannot be validly used to infer a causal relationship between the variables. This dictum should not be taken to mean that correlations cannot indicate causal relations. However, the causes underlying the correlation, if any, may be indirect and unknown. Consequently, establishing a correlation between two variables is not a sufficient condition to establish a causal relationship (in either direction).
A correlation between age and height in children is fairly causally transparent, but a correlation between mood and health in people is less so. Does improved mood lead to improved health; or does good health lead to good mood; or both? Or does some other factor underlie both? Or is it pure coincidence? In other words, a correlation can be taken as evidence for a possible causal relationship, but cannot indicate what the causal relationship, if any, might be.
Correlation and linearity
While Pearson correlation indicates the strength of a linear relationship between two variables, its value alone may not be sufficient to evaluate this relationship, especially in the case where the assumption of normality is incorrect.
A scatter plot is a type of display using Cartesian coordinates to display values for two variables for a set of data.The data is displayed as a collection of points, each having the value of one variable determining the position on the horizontal axis and the value of the other variable determining the position on the vertical axis.... s of Anscombe's quartet
Anscombe's quartet
Anscombe's quartet comprises four datasets which have identical simple statistical properties, yet which are revealed to be very different when inspected graphically.... , a set of four different pairs of variables created by Francis Anscombe
Francis Anscombe
Francis John Anscombe was an England statistician. Born in Hove, he was educated at Cambridge University. After wartime service, he joined Rothamsted Experimental Station for two years before returning to Cambridge to lecture.... . The four variables have the same mean (7.5), standard deviation (4.12), correlation (0.81) and regression line . However, as can be seen on the plots, the distribution of the variables is very different. The first one (top left) seems to be distributed normally, and corresponds to what one would expect when considering two variables correlated and following the assumption of normality. The second one (top right) is not distributed normally; while an obvious relationship between the two variables can be observed, it is not linear, and the Pearson correlation coefficient is not relevant. In the third case (bottom left), the linear relationship is perfect, except for one outlier
Outlier
In statistics, an outlier is an observation that is numerically distant from the rest of the data set.They can occur by chance in any distribution, but they are often indicative either of measurement error or that the population has a heavy-tailed distribution.... which exerts enough influence to lower the correlation coefficient from 1 to 0.81. Finally, the fourth example (bottom right) shows another example when one outlier is enough to produce a high correlation coefficient, even though the relationship between the two variables is not linear.
These examples indicate that the correlation coefficient, as a summary statistic, cannot replace the individual examination of the data.
Pseudocode is a compact and informal high-level description of a computer programming algorithm that uses the structural conventions of some programming language, but is intended for human reading rather than machine reading.... ) will calculate Pearson
Pearson product-moment correlation coefficient
In statistics, the Karl Pearson product-moment correlation coefficient is a common measure of the correlation between two variables X and Y.... correlation with good numerical stability in a single pass.
The factual accuracy, computational accuracy and appropriateness of this section is the subject of some dispute: see the discussion pages.
Suppose observations to be correlated have differing degrees of importance that can be expressed with a weight vector . To calculate the correlation between vectors and with the weight vector (all of length ),
Weighted Mean:
Weighted Covariance
Weighted Correlation
See also
Further reading
Cohen, J., Cohen P., West, S.G., & Aiken, L.S. (2003). Applied multiple regression/correlation analysis for the behavioral sciences. (3rd ed.) Hillsdale, NJ: Lawrence Erlbaum Associates.
External links
- gives basic history and references.
- Introductory material by a U. of Hawaii Prof.
- How to calculate it quickly
- The distribution of the correlation coefficient
- A useful website if one wants to compare two correlation values.