

Z-test
Encyclopedia
A Z-test is any statistical
test
for which the distribution
of the test statistic
under the null hypothesis
can be approximated by a normal distribution. Due to the central limit theorem
, many test statistics are approximately normally distributed for large samples. Therefore, many statistical tests can be performed as approximate Z-tests if the sample size is large.
A statistical test used to determine whether two population means are different when the variances are known and the sample size is large. The test statistic is assumed to have a normal distribution and nuisance parameters such as standard deviation should be known in order for an accurate z-test to be performed. [SR Editor's]
, such that the sampling distribution
of the statistic is approximately normal under the null hypothesis
. Statistics that are averages (or approximate averages) of approximately independent data values are generally well-approximated by a normal distribution. An example of a statistic that would not be well-approximated by a normal distribution would be an extreme value such as the sample maximum.
If T is a statistic that is approximately normally distributed under the null hypothesis, the next step in performing a Z-test is to determine the expected value
θ of T under the null hypothesis, and then obtain an estimate s of the standard deviation
of T. We then calculate the standard score
Z = (T − θ) / s, from which one-tailed and two-tailed p-values can be calculated as Φ(−|Z|) and 2Φ(−|Z|), respectively, where Φ is the standard normal cumulative distribution function
.
comparing the mean of a set of measurements to a given constant. If the observed data X1, ..., Xn are (i) uncorrelated, (ii) have a common mean μ, and (iii) have a common variance σ2, then the sample average X has mean μ and variance σ2 / n. If our null hypothesis is that the mean value of the population is a given number μ0, we can use X −μ0 as a test-statistic, rejecting the null hypothesis if X −μ0 is large.
To calculate the standardized statistic Z = (X − μ0) / s, we need to either know or have an approximate value for σ2, from which we can calculate s2 = σ2 / n. In some applications, σ2 is known, but this is uncommon. If the sample size is moderate or large, we can substitute the sample variance for σ2, giving a plug-in test. The resulting test will not be an exact Z-test since the uncertainty in the sample variance is not accounted for — however, it will be a good approximation unless the sample size is small. A t-test can be used to account for the uncertainty in the sample variance when the sample size is small and the data are exactly normal. There is no universal constant at which the sample size is generally considered large enough to justify use of the plug-in test. Typical rules of thumb range from 20 to 50 samples. For larger sample sizes, the t-test procedure gives almost identical p-values as the Z-test procedure.
Other location tests that can be performed as Z-tests are the two-sample location test and the paired difference test
.
If estimates of nuisance parameters are plugged in as discussed above, it is important to use estimates appropriate for the way the data were sampled
. In the special case of Z-tests for the one or two sample location problem, the usual sample standard deviation
is only appropriate if the data were collected as an independent sample.
In some situations, it is possible to devise a test that properly accounts for the variation in plug-in estimates of nuisance parameters. In the case of one and two sample location problems, a t-test
does this.
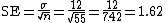
We begin by calculating the standard error
of the mean:
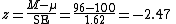
Next we calculate the z-score
, which is the distance from the sample mean to the population mean in units of the standard error:
In this example, we treat the population mean and variance as known, which would be appropriate either if all students in the region were tested, or if a large random sample were used to estimate the population mean and variance with minimal estimation error.
The classroom mean score is 96, which is −2.47 standard error units from the population mean of 100. Looking up the z-score in a table of the standard normal distribution, we find that the probability of observing a standard normal value below -2.47 is approximately 0.5 - 0.4932 = 0.0068. This is the one-sided p-value
for the null hypothesis that the 55 students are comparable to a simple random sample from the population of all test-takers. The two-sided p-value is approximately 0.014 (twice the one-sided p-value).
Another way of stating things is that with probability 1 − 0.014 = 0.986, a simple random sample of 55 students would have a mean test score within 4 units of the population mean. We could also say that with 98.6% confidence we reject the null hypothesis
that the 55 test takers are comparable to a simple random sample from the population of test-takers.
The Z-test tells us that the 55 students of interest have an unusually low mean test score compared to most simple random samples of similar size from the population of test-takers. A deficiency of this analysis is that it does not consider whether the effect size
of 4 points is meaningful. If instead of a classroom, we considered a subregion containing 900 students whose mean score was 99, nearly the same z-score and p-value would be observed. This shows that if the sample size is large enough, very small differences from the null value can be highly statistically significant. See statistical hypothesis testing
for further discussion of this issue.
estimation of the parameter
s in a parametric
statistical model
. Maximum likelihood estimates are approximately normal under certain conditions, and their asymptotic variance can be calculated in terms of the Fisher information
. The maximum likelihood estimate divided by its standard error can be used as a test statistic for the null hypothesis that the population value of the parameter equals zero. More generally, if is the maximum likelihood estimate of a parameter θ, and θ0 is the value of θ under the null hypothesis,
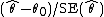
can be used as a Z-test statistic.
When using a Z-test for maximum likelihood estimates, it is important to be aware that the normal approximation may be poor if the sample size is not sufficiently large. Although there is no simple, universal rule stating how large the sample size must be to use a Z-test, simulation
can give a good idea as to whether a Z-test is appropriate in a given situation.
Z-tests are employed whenever it can be argued that a test statistic follows a normal distribution under the null hypothesis of interest. Many non-parametric
test statistics, such as U statistics, are approximately normal for large enough sample sizes, and hence are often performed as Z-tests.
Statistics
Statistics is the study of the collection, organization, analysis, and interpretation of data. It deals with all aspects of this, including the planning of data collection in terms of the design of surveys and experiments....
test
Statistical hypothesis testing
A statistical hypothesis test is a method of making decisions using data, whether from a controlled experiment or an observational study . In statistics, a result is called statistically significant if it is unlikely to have occurred by chance alone, according to a pre-determined threshold...
for which the distribution
Probability distribution
In probability theory, a probability mass, probability density, or probability distribution is a function that describes the probability of a random variable taking certain values....
of the test statistic
Test statistic
In statistical hypothesis testing, a hypothesis test is typically specified in terms of a test statistic, which is a function of the sample; it is considered as a numerical summary of a set of data that...
under the null hypothesis
Null hypothesis
The practice of science involves formulating and testing hypotheses, assertions that are capable of being proven false using a test of observed data. The null hypothesis typically corresponds to a general or default position...
can be approximated by a normal distribution. Due to the central limit theorem
Central limit theorem
In probability theory, the central limit theorem states conditions under which the mean of a sufficiently large number of independent random variables, each with finite mean and variance, will be approximately normally distributed. The central limit theorem has a number of variants. In its common...
, many test statistics are approximately normally distributed for large samples. Therefore, many statistical tests can be performed as approximate Z-tests if the sample size is large.
A statistical test used to determine whether two population means are different when the variances are known and the sample size is large. The test statistic is assumed to have a normal distribution and nuisance parameters such as standard deviation should be known in order for an accurate z-test to be performed. [SR Editor's]
General form
The most general way to obtain a Z-test is to define a numerical test statistic that can be calculated from a collection of dataData
The term data refers to qualitative or quantitative attributes of a variable or set of variables. Data are typically the results of measurements and can be the basis of graphs, images, or observations of a set of variables. Data are often viewed as the lowest level of abstraction from which...
, such that the sampling distribution
Sampling distribution
In statistics, a sampling distribution or finite-sample distribution is the probability distribution of a given statistic based on a random sample. Sampling distributions are important in statistics because they provide a major simplification on the route to statistical inference...
of the statistic is approximately normal under the null hypothesis
Null hypothesis
The practice of science involves formulating and testing hypotheses, assertions that are capable of being proven false using a test of observed data. The null hypothesis typically corresponds to a general or default position...
. Statistics that are averages (or approximate averages) of approximately independent data values are generally well-approximated by a normal distribution. An example of a statistic that would not be well-approximated by a normal distribution would be an extreme value such as the sample maximum.
If T is a statistic that is approximately normally distributed under the null hypothesis, the next step in performing a Z-test is to determine the expected value
Expected value
In probability theory, the expected value of a random variable is the weighted average of all possible values that this random variable can take on...
θ of T under the null hypothesis, and then obtain an estimate s of the standard deviation
Standard deviation
Standard deviation is a widely used measure of variability or diversity used in statistics and probability theory. It shows how much variation or "dispersion" there is from the average...
of T. We then calculate the standard score
Standard score
In statistics, a standard score indicates how many standard deviations an observation or datum is above or below the mean. It is a dimensionless quantity derived by subtracting the population mean from an individual raw score and then dividing the difference by the population standard deviation...
Z = (T − θ) / s, from which one-tailed and two-tailed p-values can be calculated as Φ(−|Z|) and 2Φ(−|Z|), respectively, where Φ is the standard normal cumulative distribution function
Cumulative distribution function
In probability theory and statistics, the cumulative distribution function , or just distribution function, describes the probability that a real-valued random variable X with a given probability distribution will be found at a value less than or equal to x. Intuitively, it is the "area so far"...
.
Use in location testing
The term Z-test is often used to refer specifically to the one-sample location testLocation test
A location test is a statistical hypothesis test that compares the location parameter of a statistical population to a given constant, or that compares the location parameters of two statistical populations to each other...
comparing the mean of a set of measurements to a given constant. If the observed data X1, ..., Xn are (i) uncorrelated, (ii) have a common mean μ, and (iii) have a common variance σ2, then the sample average X has mean μ and variance σ2 / n. If our null hypothesis is that the mean value of the population is a given number μ0, we can use X −μ0 as a test-statistic, rejecting the null hypothesis if X −μ0 is large.
To calculate the standardized statistic Z = (X − μ0) / s, we need to either know or have an approximate value for σ2, from which we can calculate s2 = σ2 / n. In some applications, σ2 is known, but this is uncommon. If the sample size is moderate or large, we can substitute the sample variance for σ2, giving a plug-in test. The resulting test will not be an exact Z-test since the uncertainty in the sample variance is not accounted for — however, it will be a good approximation unless the sample size is small. A t-test can be used to account for the uncertainty in the sample variance when the sample size is small and the data are exactly normal. There is no universal constant at which the sample size is generally considered large enough to justify use of the plug-in test. Typical rules of thumb range from 20 to 50 samples. For larger sample sizes, the t-test procedure gives almost identical p-values as the Z-test procedure.
Other location tests that can be performed as Z-tests are the two-sample location test and the paired difference test
Paired difference test
In statistics, a paired difference test is a type of location test that is used when comparing two sets of measurements to assess whether their population means differ...
.
Conditions
For the Z-test to be applicable, certain conditions must be met.- Nuisance parameters should be known, or estimated with high accuracy (an example of a nuisance parameter would be the standard deviationStandard deviationStandard deviation is a widely used measure of variability or diversity used in statistics and probability theory. It shows how much variation or "dispersion" there is from the average...
in a one-sample location test). Z-tests focus on a single parameter, and treat all other unknown parameters as being fixed at their true values. In practice, due to Slutsky's theoremSlutsky's theoremIn probability theory, Slutsky’s theorem extends some properties of algebraic operations on convergent sequences of real numbers to sequences of random variables.The theorem was named after Eugen Slutsky. Slutsky’s theorem is also attributed to Harald Cramér....
, "plugging in" consistentConsistent estimatorIn statistics, a sequence of estimators for parameter θ0 is said to be consistent if this sequence converges in probability to θ0...
estimates of nuisance parameters can be justified. However if the sample size is not large enough for these estimates to be reasonably accurate, the Z-test may not perform well.
- The test statistic should follow a normal distribution. Generally, one appeals to the central limit theorem to justify assuming that a test statistic varies normally. There is a great deal of statistical research on the question of when a test statistic varies approximately normally. If the variation of the test statistic is strongly non-normal, a Z-test should not be used.
If estimates of nuisance parameters are plugged in as discussed above, it is important to use estimates appropriate for the way the data were sampled
Sampling (statistics)
In statistics and survey methodology, sampling is concerned with the selection of a subset of individuals from within a population to estimate characteristics of the whole population....
. In the special case of Z-tests for the one or two sample location problem, the usual sample standard deviation
Standard deviation
Standard deviation is a widely used measure of variability or diversity used in statistics and probability theory. It shows how much variation or "dispersion" there is from the average...
is only appropriate if the data were collected as an independent sample.
In some situations, it is possible to devise a test that properly accounts for the variation in plug-in estimates of nuisance parameters. In the case of one and two sample location problems, a t-test
Student's t-test
A t-test is any statistical hypothesis test in which the test statistic follows a Student's t distribution if the null hypothesis is supported. It is most commonly applied when the test statistic would follow a normal distribution if the value of a scaling term in the test statistic were known...
does this.
Example
Suppose that in a particular geographic region, the mean and standard deviation of scores on a reading test are 100 points, and 12 points, respectively. Our interest is in the scores of 55 students in a particular school who received a mean score of 96. We can ask whether this mean score is significantly lower than the regional mean — that is, are the students in this school comparable to a simple random sample of 55 students from the region as a whole, or are their scores surprisingly low?We begin by calculating the standard error
Standard error (statistics)
The standard error is the standard deviation of the sampling distribution of a statistic. The term may also be used to refer to an estimate of that standard deviation, derived from a particular sample used to compute the estimate....
of the mean:
Next we calculate the z-score
Standard score
In statistics, a standard score indicates how many standard deviations an observation or datum is above or below the mean. It is a dimensionless quantity derived by subtracting the population mean from an individual raw score and then dividing the difference by the population standard deviation...
, which is the distance from the sample mean to the population mean in units of the standard error:
In this example, we treat the population mean and variance as known, which would be appropriate either if all students in the region were tested, or if a large random sample were used to estimate the population mean and variance with minimal estimation error.
The classroom mean score is 96, which is −2.47 standard error units from the population mean of 100. Looking up the z-score in a table of the standard normal distribution, we find that the probability of observing a standard normal value below -2.47 is approximately 0.5 - 0.4932 = 0.0068. This is the one-sided p-value
P-value
In statistical significance testing, the p-value is the probability of obtaining a test statistic at least as extreme as the one that was actually observed, assuming that the null hypothesis is true. One often "rejects the null hypothesis" when the p-value is less than the significance level α ,...
for the null hypothesis that the 55 students are comparable to a simple random sample from the population of all test-takers. The two-sided p-value is approximately 0.014 (twice the one-sided p-value).
Another way of stating things is that with probability 1 − 0.014 = 0.986, a simple random sample of 55 students would have a mean test score within 4 units of the population mean. We could also say that with 98.6% confidence we reject the null hypothesis
Null hypothesis
The practice of science involves formulating and testing hypotheses, assertions that are capable of being proven false using a test of observed data. The null hypothesis typically corresponds to a general or default position...
that the 55 test takers are comparable to a simple random sample from the population of test-takers.
The Z-test tells us that the 55 students of interest have an unusually low mean test score compared to most simple random samples of similar size from the population of test-takers. A deficiency of this analysis is that it does not consider whether the effect size
Effect size
In statistics, an effect size is a measure of the strength of the relationship between two variables in a statistical population, or a sample-based estimate of that quantity...
of 4 points is meaningful. If instead of a classroom, we considered a subregion containing 900 students whose mean score was 99, nearly the same z-score and p-value would be observed. This shows that if the sample size is large enough, very small differences from the null value can be highly statistically significant. See statistical hypothesis testing
Statistical hypothesis testing
A statistical hypothesis test is a method of making decisions using data, whether from a controlled experiment or an observational study . In statistics, a result is called statistically significant if it is unlikely to have occurred by chance alone, according to a pre-determined threshold...
for further discussion of this issue.
Z-tests other than location tests
Location tests are the most familiar t-tests. Another class of Z-tests arises in maximum likelihoodMaximum likelihood
In statistics, maximum-likelihood estimation is a method of estimating the parameters of a statistical model. When applied to a data set and given a statistical model, maximum-likelihood estimation provides estimates for the model's parameters....
estimation of the parameter
Parameter
Parameter from Ancient Greek παρά also “para” meaning “beside, subsidiary” and μέτρον also “metron” meaning “measure”, can be interpreted in mathematics, logic, linguistics, environmental science and other disciplines....
s in a parametric
Parametric statistics
Parametric statistics is a branch of statistics that assumes that the data has come from a type of probability distribution and makes inferences about the parameters of the distribution. Most well-known elementary statistical methods are parametric....
statistical model
Statistical model
A statistical model is a formalization of relationships between variables in the form of mathematical equations. A statistical model describes how one or more random variables are related to one or more random variables. The model is statistical as the variables are not deterministically but...
. Maximum likelihood estimates are approximately normal under certain conditions, and their asymptotic variance can be calculated in terms of the Fisher information
Fisher information
In mathematical statistics and information theory, the Fisher information is the variance of the score. In Bayesian statistics, the asymptotic distribution of the posterior mode depends on the Fisher information and not on the prior...
. The maximum likelihood estimate divided by its standard error can be used as a test statistic for the null hypothesis that the population value of the parameter equals zero. More generally, if
is the maximum likelihood estimate of a parameter θ, and θ0 is the value of θ under the null hypothesis,can be used as a Z-test statistic.
When using a Z-test for maximum likelihood estimates, it is important to be aware that the normal approximation may be poor if the sample size is not sufficiently large. Although there is no simple, universal rule stating how large the sample size must be to use a Z-test, simulation
Monte Carlo method
Monte Carlo methods are a class of computational algorithms that rely on repeated random sampling to compute their results. Monte Carlo methods are often used in computer simulations of physical and mathematical systems...
can give a good idea as to whether a Z-test is appropriate in a given situation.
Z-tests are employed whenever it can be argued that a test statistic follows a normal distribution under the null hypothesis of interest. Many non-parametric
Non-parametric statistics
In statistics, the term non-parametric statistics has at least two different meanings:The first meaning of non-parametric covers techniques that do not rely on data belonging to any particular distribution. These include, among others:...
test statistics, such as U statistics, are approximately normal for large enough sample sizes, and hence are often performed as Z-tests.