

Summary statistics
Encyclopedia
Descriptive statistics
Descriptive statistics quantitatively describe the main features of a collection of data. Descriptive statistics are distinguished from inferential statistics , in that descriptive statistics aim to summarize a data set, rather than use the data to learn about the population that the data are...
, summary statistics are used to summarize a set of observations, in order to communicate the largest amount as simply as possible. Statisticians commonly try to describe the observations in
- a measure of location, or central tendencyCentral tendencyIn statistics, the term central tendency relates to the way in which quantitative data is clustered around some value. A measure of central tendency is a way of specifying - central value...
, such as the arithmetic meanArithmetic meanIn mathematics and statistics, the arithmetic mean, often referred to as simply the mean or average when the context is clear, is a method to derive the central tendency of a sample space... - a measure of statistical dispersionStatistical dispersionIn statistics, statistical dispersion is variability or spread in a variable or a probability distribution...
like the standard deviationStandard deviationStandard deviation is a widely used measure of variability or diversity used in statistics and probability theory. It shows how much variation or "dispersion" there is from the average... - a measure of the shape of the distribution like skewnessSkewnessIn probability theory and statistics, skewness is a measure of the asymmetry of the probability distribution of a real-valued random variable. The skewness value can be positive or negative, or even undefined...
or kurtosisKurtosisIn probability theory and statistics, kurtosis is any measure of the "peakedness" of the probability distribution of a real-valued random variable... - if more than one variable is measured, a measure of statistical dependence such as a correlation coefficientPearson product-moment correlation coefficientIn statistics, the Pearson product-moment correlation coefficient is a measure of the correlation between two variables X and Y, giving a value between +1 and −1 inclusive...
A common collection of order statistics used as summary statistics are the five-number summary
Five-number summary
The five-number summary is a descriptive statistic that provides information about a set of observations. It consists of the five most important sample percentiles:# the sample minimum # the lower quartile or first quartile...
, sometimes extended to a seven-number summary
Seven-number summary
In descriptive statistics, the seven-number summary is a collection of seven summary statistics, and is a modification or extension of the five-number summary...
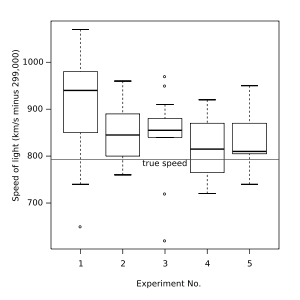
, and the associated box plot
Box plot
In descriptive statistics, a box plot or boxplot is a convenient way of graphically depicting groups of numerical data through their five-number summaries: the smallest observation , lower quartile , median , upper quartile , and largest observation...
.
Entries in an analysis of variance
Analysis of variance
In statistics, analysis of variance is a collection of statistical models, and their associated procedures, in which the observed variance in a particular variable is partitioned into components attributable to different sources of variation...
table can also be regarded as summary statistics.
Example
The following example using R is the standard summary statistics of a randomly sampled normal distribution, with a mean of 0, standard deviationStandard deviation
Standard deviation is a widely used measure of variability or diversity used in statistics and probability theory. It shows how much variation or "dispersion" there is from the average...
of 1, and a population of 50:
> x <- rnorm(n=50, mean=0, sd=1)
> summary(x)
Min. 1st Qu. Median Mean 3rd Qu. Max.
-1.72700 -0.49650 -0.05157 0.07981 0.67640 2.46700
Location
Common measures of location, or central tendencyCentral tendency
In statistics, the term central tendency relates to the way in which quantitative data is clustered around some value. A measure of central tendency is a way of specifying - central value...
, are the arithmetic mean
Arithmetic mean
In mathematics and statistics, the arithmetic mean, often referred to as simply the mean or average when the context is clear, is a method to derive the central tendency of a sample space...
, median
Median
In probability theory and statistics, a median is described as the numerical value separating the higher half of a sample, a population, or a probability distribution, from the lower half. The median of a finite list of numbers can be found by arranging all the observations from lowest value to...
, mode
Mode (statistics)
In statistics, the mode is the value that occurs most frequently in a data set or a probability distribution. In some fields, notably education, sample data are often called scores, and the sample mode is known as the modal score....
, and interquartile mean
Interquartile mean
The interquartile mean is a statistical measure of central tendency, much like the mean , the median, and the mode....
.
Spread
Common measures of statistical dispersionStatistical dispersion
In statistics, statistical dispersion is variability or spread in a variable or a probability distribution...
are the standard deviation
Standard deviation
Standard deviation is a widely used measure of variability or diversity used in statistics and probability theory. It shows how much variation or "dispersion" there is from the average...
, variance
Variance
In probability theory and statistics, the variance is a measure of how far a set of numbers is spread out. It is one of several descriptors of a probability distribution, describing how far the numbers lie from the mean . In particular, the variance is one of the moments of a distribution...
, range
Range (statistics)
In the descriptive statistics, the range is the length of the smallest interval which contains all the data. It is calculated by subtracting the smallest observation from the greatest and provides an indication of statistical dispersion.It is measured in the same units as the data...
, interquartile range
Interquartile range
In descriptive statistics, the interquartile range , also called the midspread or middle fifty, is a measure of statistical dispersion, being equal to the difference between the upper and lower quartiles...
, absolute deviation
Absolute deviation
In statistics, the absolute deviation of an element of a data set is the absolute difference between that element and a given point. Typically the point from which the deviation is measured is a measure of central tendency, most often the median or sometimes the mean of the data set.D_i = |x_i-m|...
and the distance standard deviation. Measures that assess spread in comparison to the typical size of data values include the coefficient of variation
Coefficient of variation
In probability theory and statistics, the coefficient of variation is a normalized measure of dispersion of a probability distribution. It is also known as unitized risk or the variation coefficient. The absolute value of the CV is sometimes known as relative standard deviation , which is...
.
The Gini coefficient
Gini coefficient
The Gini coefficient is a measure of statistical dispersion developed by the Italian statistician and sociologist Corrado Gini and published in his 1912 paper "Variability and Mutability" ....
was originally developed to measure income inequality and is equivalent to one of the L-moment
L-moment
In statistics, L-moments are statistics used to summarize the shape of a probability distribution. They are analogous to conventional moments in that they can be used to calculate quantities analogous to standard deviation, skewness and kurtosis, termed the L-scale, L-skewness and L-kurtosis...
s.
Shape
Common measures of the shape of a distribution are skewnessSkewness
In probability theory and statistics, skewness is a measure of the asymmetry of the probability distribution of a real-valued random variable. The skewness value can be positive or negative, or even undefined...
or kurtosis
Kurtosis
In probability theory and statistics, kurtosis is any measure of the "peakedness" of the probability distribution of a real-valued random variable...
, while alternatives can be based on L-moment
L-moment
In statistics, L-moments are statistics used to summarize the shape of a probability distribution. They are analogous to conventional moments in that they can be used to calculate quantities analogous to standard deviation, skewness and kurtosis, termed the L-scale, L-skewness and L-kurtosis...
s. A different measure is the Distance skewness, for which a value of zero implies central symmetry.
Percentiles
A simple summary of a dataset is sometimes given by quoting particular order statistics as approximations to selected percentiles of a distribution.Dependence
The common measure of dependence between paired random variables is the Pearson product-moment correlation coefficientPearson product-moment correlation coefficient
In statistics, the Pearson product-moment correlation coefficient is a measure of the correlation between two variables X and Y, giving a value between +1 and −1 inclusive...
, while a common alternative summary statistic is Spearman's rank correlation coefficient
Spearman's rank correlation coefficient
In statistics, Spearman's rank correlation coefficient or Spearman's rho, named after Charles Spearman and often denoted by the Greek letter \rho or as r_s, is a non-parametric measure of statistical dependence between two variables. It assesses how well the relationship between two variables can...
. Distance correlation
Distance correlation
In statistics and in probability theory, distance correlation is a measure of statistical dependence between two random variables or two random vectors of arbitrary, not necessarily equal dimension. Its important property is that this measure of dependence is zero if and only if the random...
equals zero implies independence.