

Kurtosis
Encyclopedia
In probability theory
and statistics
, kurtosis (from the Greek word κυρτός, kyrtos or kurtos, meaning bulging) is any measure of the "peakedness" of the probability distribution
of a real
-valued random variable
. In a similar way to the concept of skewness
, kurtosis is a descriptor of the shape of a probability distribution and, just as for skewness, there are different ways of quantifying it for a theoretical distribution and corresponding ways of estimating it from a sample from a population.
One common measure of kurtosis, originating with Pearson, is based on a scaled version of the fourth moment of the data or population, but it has been argued that this measure really measures heavy tails, and not peakedness. For this measure, higher kurtosis means more of the variance
is the result of infrequent extreme deviations
, as opposed to frequent modestly sized deviations. An alternative measure, the L-kurtosis is a scaled version of of the fourth L-moment
.

where μ4 is the fourth moment about the mean and σ is the standard deviation
. This is sometimes used as the definition of kurtosis in older works, but is not the definition used here.
Kurtosis is more commonly defined as the fourth cumulant
divided by the square of the second cumulant, which is equal to the fourth moment around the mean divided by the square of the variance
of the probability distribution minus 3,

which is also known as excess kurtosis. The "minus 3" at the end of this formula is often explained as a correction to make the kurtosis of the normal distribution equal to zero. Another reason can be seen by looking at the formula for the kurtosis of the sum of random variables. Suppose that Y is the sum of n identically distributed independent
random variables all with the same distribution as X. Then

This formula would be much more complicated if kurtosis were defined just as μ4 / σ4 (without the minus 3).
More generally, if X1, ..., Xn are independent random variables, not necessarily identically distributed, but all having the same variance, then

whereas this identity would not hold if the definition did not include the subtraction of 3.
The fourth standardized moment must be at least 1, so the excess kurtosis must be −2 or more. This lower bound is realized by the Bernoulli distribution with p = ½, or "coin toss". There is no upper limit to the excess kurtosis and it may be infinite.
Distributions with zero excess kurtosis are called mesokurtic, or mesokurtotic. The most prominent example of a mesokurtic distribution is the normal distribution family, regardless of the values of its parameter
s. A few other well-known distributions can be mesokurtic, depending on parameter values: for example the binomial distribution is mesokurtic for .
.
A distribution with positive excess kurtosis is called leptokurtic, or leptokurtotic. "Lepto-" means "slender"http://medical-dictionary.thefreedictionary.com/lepto-. In terms of shape, a leptokurtic distribution has a more acute peak around the mean
and fatter tails
. Examples of leptokurtic distributions include the Cauchy distribution
, Student's t-distribution, Rayleigh distribution, Laplace distribution, exponential distribution
, Poisson distribution
and the logistic distribution. Such distributions are sometimes termed super Gaussian.
 A distribution with negative excess kurtosis is called platykurtic, or platykurtotic. "Platy-" means "broad"http://www.yourdictionary.com/platy-prefix. In terms of shape, a platykurtic distribution has a lower, wider peak around the mean and thinner tails. Examples of platykurtic distributions include the continuous or discrete uniform distribution
s, and the raised cosine distribution. The most platykurtic distribution of all is the Bernoulli distribution with p = ½ (for example the number of times one obtains "heads" when flipping a coin once, a coin toss), for which the excess kurtosis is −2. Such distributions are sometimes termed sub Gaussian.
 The effects of kurtosis are illustrated using a parametric family
of distributions whose kurtosis can be adjusted while their lower-order moments and cumulants remain constant. Consider the Pearson type VII family
, which is a special case of the Pearson type IV family
restricted to symmetric densities. The probability density function is given by

where a is a scale parameter
and m is a shape parameter
.
All densities in this family are symmetric. The kth moment exists provided m > (k + 1)/2. For the kurtosis to exist, we require m > 5/2. Then the mean and skewness
exist and are both identically zero. Setting a2 = 2m − 3 makes the variance equal to unity. Then the only free parameter is m, which controls the fourth moment (and cumulant) and hence the kurtosis. One can reparameterize with , where
  is the kurtosis as defined above. This yields a one-parameter leptokurtic family with zero mean, unit variance, zero skewness, and arbitrary positive kurtosis. The reparameterized density is

In the limit as one obtains the density

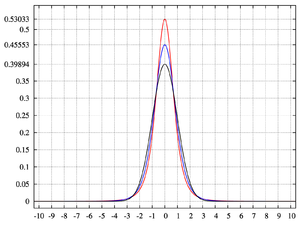
which is shown as the red curve in the images on the right.
In the other direction as one obtains the standard normal density as the limiting distribution, shown as the black curve.
In the images on the right, the blue curve represents the density with kurtosis of 2. The top image shows that leptokurtic densities in this family have a higher peak than the mesokurtic normal density. The comparatively fatter tails of the leptokurtic densities are illustrated in the second image, which plots the natural logarithm of the Pearson type VII densities: the black curve is the logarithm of the standard normal density, which is a parabola
. One can see that the normal density allocates little probability mass to the regions far from the mean ("has thin tails"), compared with the blue curve of the leptokurtic Pearson type VII density with kurtosis of 2. Between the blue curve and the black are other Pearson type VII densities with γ2 = 1, 1/2, 1/4, 1/8, and 1/16. The red curve again shows the upper limit of the Pearson type VII family, with (which, strictly speaking, means that the fourth moment does not exist). The red curve decreases the slowest as one moves outward from the origin ("has fat tails").
Note that in these cases the platykurtic densities have bounded support
, whereas the densities with positive or zero excess kurtosis are supported on the whole real line
.
There exist platykurtic densities with infinite support,
and there exist leptokurtic densities with finite support.
of n values the sample kurtosis is

where m4 is the fourth sample moment about the mean, m2 is the second sample moment about the mean (that is, the sample variance), xi is the ith value, and is the sample mean.
/SAS
, Minitab
, PSPP
/SPSS
, and Excel
but not by BMDP
) is G2, defined as follows:
Probability theory
Probability theory is the branch of mathematics concerned with analysis of random phenomena. The central objects of probability theory are random variables, stochastic processes, and events: mathematical abstractions of non-deterministic events or measured quantities that may either be single...
and statistics
Statistics
Statistics is the study of the collection, organization, analysis, and interpretation of data. It deals with all aspects of this, including the planning of data collection in terms of the design of surveys and experiments....
, kurtosis (from the Greek word κυρτός, kyrtos or kurtos, meaning bulging) is any measure of the "peakedness" of the probability distribution
Probability distribution
In probability theory, a probability mass, probability density, or probability distribution is a function that describes the probability of a random variable taking certain values....
of a real
Real number
In mathematics, a real number is a value that represents a quantity along a continuum, such as -5 , 4/3 , 8.6 , √2 and π...
-valued random variable
Random variable
In probability and statistics, a random variable or stochastic variable is, roughly speaking, a variable whose value results from a measurement on some type of random process. Formally, it is a function from a probability space, typically to the real numbers, which is measurable functionmeasurable...
. In a similar way to the concept of skewness
Skewness
In probability theory and statistics, skewness is a measure of the asymmetry of the probability distribution of a real-valued random variable. The skewness value can be positive or negative, or even undefined...
, kurtosis is a descriptor of the shape of a probability distribution and, just as for skewness, there are different ways of quantifying it for a theoretical distribution and corresponding ways of estimating it from a sample from a population.
One common measure of kurtosis, originating with Pearson, is based on a scaled version of the fourth moment of the data or population, but it has been argued that this measure really measures heavy tails, and not peakedness. For this measure, higher kurtosis means more of the variance
Variance
In probability theory and statistics, the variance is a measure of how far a set of numbers is spread out. It is one of several descriptors of a probability distribution, describing how far the numbers lie from the mean . In particular, the variance is one of the moments of a distribution...
is the result of infrequent extreme deviations
Deviation (statistics)
In mathematics and statistics, deviation is a measure of difference for interval and ratio variables between the observed value and the mean. The sign of deviation , reports the direction of that difference...
, as opposed to frequent modestly sized deviations. An alternative measure, the L-kurtosis is a scaled version of of the fourth L-moment
L-moment
In statistics, L-moments are statistics used to summarize the shape of a probability distribution. They are analogous to conventional moments in that they can be used to calculate quantities analogous to standard deviation, skewness and kurtosis, termed the L-scale, L-skewness and L-kurtosis...
.
Pearson moments
The fourth standardized moment is defined aswhere μ4 is the fourth moment about the mean and σ is the standard deviation
Standard deviation
Standard deviation is a widely used measure of variability or diversity used in statistics and probability theory. It shows how much variation or "dispersion" there is from the average...
. This is sometimes used as the definition of kurtosis in older works, but is not the definition used here.
Kurtosis is more commonly defined as the fourth cumulant
Cumulant
In probability theory and statistics, the cumulants κn of a probability distribution are a set of quantities that provide an alternative to the moments of the distribution. The moments determine the cumulants in the sense that any two probability distributions whose moments are identical will have...
divided by the square of the second cumulant, which is equal to the fourth moment around the mean divided by the square of the variance
Variance
In probability theory and statistics, the variance is a measure of how far a set of numbers is spread out. It is one of several descriptors of a probability distribution, describing how far the numbers lie from the mean . In particular, the variance is one of the moments of a distribution...
of the probability distribution minus 3,
which is also known as excess kurtosis. The "minus 3" at the end of this formula is often explained as a correction to make the kurtosis of the normal distribution equal to zero. Another reason can be seen by looking at the formula for the kurtosis of the sum of random variables. Suppose that Y is the sum of n identically distributed independent
Statistical independence
In probability theory, to say that two events are independent intuitively means that the occurrence of one event makes it neither more nor less probable that the other occurs...
random variables all with the same distribution as X. Then
This formula would be much more complicated if kurtosis were defined just as μ4 / σ4 (without the minus 3).
More generally, if X1, ..., Xn are independent random variables, not necessarily identically distributed, but all having the same variance, then
whereas this identity would not hold if the definition did not include the subtraction of 3.
The fourth standardized moment must be at least 1, so the excess kurtosis must be −2 or more. This lower bound is realized by the Bernoulli distribution with p = ½, or "coin toss". There is no upper limit to the excess kurtosis and it may be infinite.
Terminology and examples
A high kurtosis distribution has a sharper peak and longer, fatter tails, while a low kurtosis distribution has a more rounded peak and shorter, thinner tails.Distributions with zero excess kurtosis are called mesokurtic, or mesokurtotic. The most prominent example of a mesokurtic distribution is the normal distribution family, regardless of the values of its parameter
Parameter
Parameter from Ancient Greek παρά also “para” meaning “beside, subsidiary” and μέτρον also “metron” meaning “measure”, can be interpreted in mathematics, logic, linguistics, environmental science and other disciplines....
s. A few other well-known distributions can be mesokurtic, depending on parameter values: for example the binomial distribution is mesokurtic for
.A distribution with positive excess kurtosis is called leptokurtic, or leptokurtotic. "Lepto-" means "slender"http://medical-dictionary.thefreedictionary.com/lepto-. In terms of shape, a leptokurtic distribution has a more acute peak around the mean
Mean
In statistics, mean has two related meanings:* the arithmetic mean .* the expected value of a random variable, which is also called the population mean....
and fatter tails
Fat tail
A fat-tailed distribution is a probability distribution that has the property, along with the heavy-tailed distributions, that they exhibit extremely large skewness or kurtosis. This comparison is often made relative to the ubiquitous normal distribution, which itself is an example of an...
. Examples of leptokurtic distributions include the Cauchy distribution
Cauchy distribution
The Cauchy–Lorentz distribution, named after Augustin Cauchy and Hendrik Lorentz, is a continuous probability distribution. As a probability distribution, it is known as the Cauchy distribution, while among physicists, it is known as the Lorentz distribution, Lorentz function, or Breit–Wigner...
, Student's t-distribution, Rayleigh distribution, Laplace distribution, exponential distribution
Exponential distribution
In probability theory and statistics, the exponential distribution is a family of continuous probability distributions. It describes the time between events in a Poisson process, i.e...
, Poisson distribution
Poisson distribution
In probability theory and statistics, the Poisson distribution is a discrete probability distribution that expresses the probability of a given number of events occurring in a fixed interval of time and/or space if these events occur with a known average rate and independently of the time since...
and the logistic distribution. Such distributions are sometimes termed super Gaussian.
Uniform distribution
-Probability theory:* Discrete uniform distribution* Continuous uniform distribution-Other:* "Uniform distribution modulo 1", see Equidistributed sequence*Uniform distribution , a type of species distribution* Distribution of military uniforms...
s, and the raised cosine distribution. The most platykurtic distribution of all is the Bernoulli distribution with p = ½ (for example the number of times one obtains "heads" when flipping a coin once, a coin toss), for which the excess kurtosis is −2. Such distributions are sometimes termed sub Gaussian.
The Pearson type VII family
Parametric family
In mathematics and its applications, a parametric family or a parameterized family is a family of objects whose definitions depend on a set of parameters....
of distributions whose kurtosis can be adjusted while their lower-order moments and cumulants remain constant. Consider the Pearson type VII family
Pearson distribution
The Pearson distribution is a family of continuous probability distributions. It was first published by Karl Pearson in 1895 and subsequently extended by him in 1901 and 1916 in a series of articles on biostatistics.- History :...
, which is a special case of the Pearson type IV family
Pearson distribution
The Pearson distribution is a family of continuous probability distributions. It was first published by Karl Pearson in 1895 and subsequently extended by him in 1901 and 1916 in a series of articles on biostatistics.- History :...
restricted to symmetric densities. The probability density function is given by
where a is a scale parameter
Scale parameter
In probability theory and statistics, a scale parameter is a special kind of numerical parameter of a parametric family of probability distributions...
and m is a shape parameter
Shape parameter
In probability theory and statistics, a shape parameter is a kind of numerical parameter of a parametric family of probability distributions.- Definition :...
.
All densities in this family are symmetric. The kth moment exists provided m > (k + 1)/2. For the kurtosis to exist, we require m > 5/2. Then the mean and skewness
Skewness
In probability theory and statistics, skewness is a measure of the asymmetry of the probability distribution of a real-valued random variable. The skewness value can be positive or negative, or even undefined...
exist and are both identically zero. Setting a2 = 2m − 3 makes the variance equal to unity. Then the only free parameter is m, which controls the fourth moment (and cumulant) and hence the kurtosis. One can reparameterize with
, where is the kurtosis as defined above. This yields a one-parameter leptokurtic family with zero mean, unit variance, zero skewness, and arbitrary positive kurtosis. The reparameterized density isIn the limit as
one obtains the densitywhich is shown as the red curve in the images on the right.
In the other direction as
one obtains the standard normal density as the limiting distribution, shown as the black curve.In the images on the right, the blue curve represents the density
with kurtosis of 2. The top image shows that leptokurtic densities in this family have a higher peak than the mesokurtic normal density. The comparatively fatter tails of the leptokurtic densities are illustrated in the second image, which plots the natural logarithm of the Pearson type VII densities: the black curve is the logarithm of the standard normal density, which is a parabolaParabola
In mathematics, the parabola is a conic section, the intersection of a right circular conical surface and a plane parallel to a generating straight line of that surface...
. One can see that the normal density allocates little probability mass to the regions far from the mean ("has thin tails"), compared with the blue curve of the leptokurtic Pearson type VII density with kurtosis of 2. Between the blue curve and the black are other Pearson type VII densities with γ2 = 1, 1/2, 1/4, 1/8, and 1/16. The red curve again shows the upper limit of the Pearson type VII family, with
(which, strictly speaking, means that the fourth moment does not exist). The red curve decreases the slowest as one moves outward from the origin ("has fat tails").Kurtosis of well-known distributions
In this example we compare several well-known distributions from different parametric families. All densities considered here are unimodal and symmetric. Each has a mean and skewness of zero. Parameters were chosen to result in a variance of unity in each case. The images on the right show curves for the following seven densities, on a linear scale and logarithmic scale:- D: Laplace distribution, a.k.a. double exponential distribution, red curve (two straight lines in the log-scale plot), excess kurtosis = 3
- S: hyperbolic secant distribution, orange curve, excess kurtosis = 2
- L: logistic distribution, green curve, excess kurtosis = 1.2
- N: normal distribution, black curve (inverted parabola in the log-scale plot), excess kurtosis = 0
- C: raised cosine distribution, cyan curve, excess kurtosis = −0.593762...
- W: Wigner semicircle distribution, blue curve, excess kurtosis = −1
- U: uniform distributionUniform distribution (continuous)In probability theory and statistics, the continuous uniform distribution or rectangular distribution is a family of probability distributions such that for each member of the family, all intervals of the same length on the distribution's support are equally probable. The support is defined by...
, magenta curve (shown for clarity as a rectangle in both images), excess kurtosis = −1.2.
Note that in these cases the platykurtic densities have bounded support
Support (mathematics)
In mathematics, the support of a function is the set of points where the function is not zero, or the closure of that set . This concept is used very widely in mathematical analysis...
, whereas the densities with positive or zero excess kurtosis are supported on the whole real line
Real line
In mathematics, the real line, or real number line is the line whose points are the real numbers. That is, the real line is the set of all real numbers, viewed as a geometric space, namely the Euclidean space of dimension one...
.
There exist platykurtic densities with infinite support,
- e.g., exponential power distributions with sufficiently large shape parameter b
and there exist leptokurtic densities with finite support.
- e.g., a distribution that is uniform between −3 and −0.3, between −0.3 and 0.3, and between 0.3 and 3, with the same density in the (−3, −0.3) and (0.3, 3) intervals, but with 20 times more density in the (−0.3, 0.3) interval
Sample kurtosis
For a sampleSample (statistics)
In statistics, a sample is a subset of a population. Typically, the population is very large, making a census or a complete enumeration of all the values in the population impractical or impossible. The sample represents a subset of manageable size...
of n values the sample kurtosis is
where m4 is the fourth sample moment about the mean, m2 is the second sample moment about the mean (that is, the sample variance), xi is the ith value, and
is the sample mean.Estimators of population kurtosis
Given a sub-set of samples from a population, the sample kurtosis above is a biased estimator of the population kurtosis. The usual estimator of the population kurtosis (used in DAPDAP (software)
Dap is a statistics and graphics program, that performs data management, analysis, and graphical visualization tasks which are commonly required in statistical consulting practice....
/SAS
SAS System
SAS is an integrated system of software products provided by SAS Institute Inc. that enables programmers to perform:* retrieval, management, and mining* report writing and graphics* statistical analysis...
, Minitab
Minitab
Minitab is a statistics package. It was developed at the Pennsylvania State University by researchers Barbara F. Ryan, Thomas A. Ryan, Jr., and Brian L. Joiner in 1972...
, PSPP
PSPP
PSPP is a free software application for analysis of sampled data. It has a graphical user interface and conventional command line interface. It is written in C, uses GNU Scientific Library for its mathematical routines, and plotutils for generating graphs....
/SPSS
SPSS
SPSS is a computer program used for survey authoring and deployment , data mining , text analytics, statistical analysis, and collaboration and deployment ....
, and Excel
Microsoft Excel
Microsoft Excel is a proprietary commercial spreadsheet application written and distributed by Microsoft for Microsoft Windows and Mac OS X. It features calculation, graphing tools, pivot tables, and a macro programming language called Visual Basic for Applications...
but not by BMDP
BMDP
BMDP is a statistical package developed in 1961 at UCLA. Based on the older BIMED program for biomedical applications, it used keyword parameters in the input instead of fixed-format cards, so the letter P was added to the letters BMD, although the name was later defined as being an abbreviation...
) is G2, defined as follows:
-

where k4 is the unique symmetric unbiasedBias of an estimatorIn statistics, bias of an estimator is the difference between this estimator's expected value and the true value of the parameter being estimated. An estimator or decision rule with zero bias is called unbiased. Otherwise the estimator is said to be biased.In ordinary English, the term bias is...
estimator of the fourth cumulantCumulantIn probability theory and statistics, the cumulants κn of a probability distribution are a set of quantities that provide an alternative to the moments of the distribution. The moments determine the cumulants in the sense that any two probability distributions whose moments are identical will have...
, k2 is the unbiased estimator of the population variance, m4 is the fourth sample moment about the mean, m2 is the sample variance, xi is the ith value, and is the sample mean. Unfortunately,
  is itself generally biased. For the normal distribution it is unbiased.
Applications
D'Agostino's K-squared testD'Agostino's K-squared testIn statistics, D’Agostino’s K2 test is a goodness-of-fit measure of departure from normality, that is the test aims to establish whether or not the given sample comes from a normally distributed population...
is a goodness-of-fit normality testNormality testIn statistics, normality tests are used to determine whether a data set is well-modeled by a normal distribution or not, or to compute how likely an underlying random variable is to be normally distributed....
based on a combination of the sample skewness and sample kurtosis, as is the Jarque-Bera test for normality.
Other measures of kurtosis
A different measure of "kurtosis", that is of the "peakedness" of a distribution, is provided by using L-momentL-momentIn statistics, L-moments are statistics used to summarize the shape of a probability distribution. They are analogous to conventional moments in that they can be used to calculate quantities analogous to standard deviation, skewness and kurtosis, termed the L-scale, L-skewness and L-kurtosis...
s instead of the ordinary moments.
See also
- Algorithms for calculating higher-order statistics
- Kurtosis riskKurtosis riskKurtosis risk in statistics and decision theory denotes the fact that observations are spread in a wider fashion than the normal distribution entails...
Further reading
- Joanes, D. N. & Gill, C. A. (1998) Comparing measures of sample skewness and kurtosis. Journal of the Royal Statistical SocietyJournal of the Royal Statistical SocietyThe Journal of the Royal Statistical Society is a series of three peer-reviewed statistics journals published by Blackwell Publishing for the London-based Royal Statistical Society.- History :...
(Series D): The Statistician 47 (1), 183–189.
- Kim, Tae-Hwan; & White, Halbert. (2003/4). "On More Robust Estimation of Skewness and Kurtosis: Simulation and Application to the S&P500 Index". Finance Research Letters, 1, 56-70 Alternative source (Comparison of kurtosis estimators)
- Seier, E. & Bonett, D.G. (2003). Two families of kurtosis measures. Metrika, 58, 59-70.
External links
- Free Online Software (Calculator) computes various types of skewness and kurtosis statistics for any dataset (includes small and large sample tests)..
- Kurtosis on the Earliest known uses of some of the words of mathematics
- Celebrating 100 years of Kurtosis a history of the topic, with different measures of kurtosis.