
Interquartile range
Encyclopedia
In descriptive statistics
, the interquartile range (IQR), also called the midspread or middle fifty, is a measure of statistical dispersion
, being equal to the difference between the upper and lower quartile
s. IQR = Q3 − Q1
, the interquartile range is a robust statistic, having a breakdown point of 25%, and is thus often preferred to the total range.
The IQR is used to build box plot
s, simple graphical representations of a probability distribution
.
For a symmetric distribution (so the median equals the midhinge
, the average of the first and third quartiles), half the IQR equals the median absolute deviation
(MAD).
The median
is the corresponding measure of central tendency
.
For the data in this table the interquartile range is IQR = 115 − 105 = 10.
For the data set in this box plot
:
Descriptive statistics
Descriptive statistics quantitatively describe the main features of a collection of data. Descriptive statistics are distinguished from inferential statistics , in that descriptive statistics aim to summarize a data set, rather than use the data to learn about the population that the data are...
, the interquartile range (IQR), also called the midspread or middle fifty, is a measure of statistical dispersion
Statistical dispersion
In statistics, statistical dispersion is variability or spread in a variable or a probability distribution...
, being equal to the difference between the upper and lower quartile
Quartile
In descriptive statistics, the quartiles of a set of values are the three points that divide the data set into four equal groups, each representing a fourth of the population being sampled...
s. IQR = Q3 − Q1
Use
Unlike (total) rangeRange (statistics)
In the descriptive statistics, the range is the length of the smallest interval which contains all the data. It is calculated by subtracting the smallest observation from the greatest and provides an indication of statistical dispersion.It is measured in the same units as the data...
, the interquartile range is a robust statistic, having a breakdown point of 25%, and is thus often preferred to the total range.
The IQR is used to build box plot
Box plot
In descriptive statistics, a box plot or boxplot is a convenient way of graphically depicting groups of numerical data through their five-number summaries: the smallest observation , lower quartile , median , upper quartile , and largest observation...
s, simple graphical representations of a probability distribution
Probability distribution
In probability theory, a probability mass, probability density, or probability distribution is a function that describes the probability of a random variable taking certain values....
.
For a symmetric distribution (so the median equals the midhinge
Midhinge
In statistics, the midhinge is the average of the first and third quartiles and is thus a measure of location.Equivalently, it is the 25% trimmed mid-range; it is an L-estimator....
, the average of the first and third quartiles), half the IQR equals the median absolute deviation
Median absolute deviation
In statistics, the median absolute deviation is a robust measure of the variability of a univariate sample of quantitative data. It can also refer to the population parameter that is estimated by the MAD calculated from a sample....
(MAD).
The median
Median
In probability theory and statistics, a median is described as the numerical value separating the higher half of a sample, a population, or a probability distribution, from the lower half. The median of a finite list of numbers can be found by arranging all the observations from lowest value to...
is the corresponding measure of central tendency
Central tendency
In statistics, the term central tendency relates to the way in which quantitative data is clustered around some value. A measure of central tendency is a way of specifying - central value...
.
Examples
Data set in a table
| i | x[i] | Quartile |
|---|---|---|
| 1 | 102 | |
| 2 | 104 | |
| 3 | 105 | Q1 |
| 4 | 107 | |
| 5 | 108 | |
| 6 | 109 | Q2 (median) |
| 7 | 110 | |
| 8 | 112 | |
| 9 | 115 | Q3 |
| 10 | 116 | |
| 11 | 118 |
For the data in this table the interquartile range is IQR = 115 − 105 = 10.
Data set in a plain-text box plot
                             +-----+-+

   o           *     |-------|     | |---|

                             +-----+-+


 +---+---+---+---+---+---+---+---+---+---+---+---+   number line

 0   1   2   3   4   5   6   7   8   9   10  11  12
For the data set in this box plot
Box plot
In descriptive statistics, a box plot or boxplot is a convenient way of graphically depicting groups of numerical data through their five-number summaries: the smallest observation , lower quartile , median , upper quartile , and largest observation...
:
- lower (first) quartile (


where CDF−1 is the quantile functionQuantile functionIn probability and statistics, the quantile function of the probability distribution of a random variable specifies, for a given probability, the value which the random variable will be at, or below, with that probability...
.
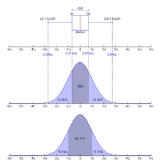
The interquartile range and median of some common distributions are shown below
Distribution Median IQR Normal μ 2 Φ−1(0.75) ≈ 1.349 
Laplace μ 2b ln(2) Cauchy Cauchy distributionThe Cauchy–Lorentz distribution, named after Augustin Cauchy and Hendrik Lorentz, is a continuous probability distribution. As a probability distribution, it is known as the Cauchy distribution, while among physicists, it is known as the Lorentz distribution, Lorentz function, or Breit–Wigner...μ 
Interquartile range test for normality of distribution
The IQR, meanMeanIn statistics, mean has two related meanings:* the arithmetic mean .* the expected value of a random variable, which is also called the population mean....
, and standard deviationStandard deviationStandard deviation is a widely used measure of variability or diversity used in statistics and probability theory. It shows how much variation or "dispersion" there is from the average...
of a population P can be used in a simply test of whether or not P is normally distributed, or Gaussian. If P is normally distributed, then the standard scoreStandard scoreIn statistics, a standard score indicates how many standard deviations an observation or datum is above or below the mean. It is a dimensionless quantity derived by subtracting the population mean from an individual raw score and then dividing the difference by the population standard deviation...
of the first quartile, z1, is -0.67, and the standard score of the third quartile, z3, is +0.67. Given mean = X and standard deviation = σ for P, if P is normally distributed, the first quartile

and the third quartile

If the actual values of the first or third quartiles differ substantially from the calculated values, P is not normally distributed.
See also
- MidhingeMidhingeIn statistics, the midhinge is the average of the first and third quartiles and is thus a measure of location.Equivalently, it is the 25% trimmed mid-range; it is an L-estimator....
- Interdecile rangeInterdecile rangeIn statistics, the interdecile range is the difference between the first and the ninth deciles . The interdecile range is a measure of statistical dispersion of the values in a set of data, similar to the range and the interquartile range....
- Robust measures of scaleRobust measures of scaleIn statistics, a robust measure of scale is a robust statistic that quantifies the statistical dispersion in a set of quantitative data. Robust measures of scale are used to complement or replace conventional estimates of scale such as the sample variance or sample standard deviation...
- OutlierOutlierIn statistics, an outlier is an observation that is numerically distant from the rest of the data. Grubbs defined an outlier as: An outlying observation, or outlier, is one that appears to deviate markedly from other members of the sample in which it occurs....
- Midhinge