

IQ and Global Inequality
Encyclopedia
Richard Lynn
Richard Lynn is a British Professor Emeritus of Psychology at the University of Ulster who is known for his views on racial and ethnic differences. Lynn argues that there are hereditary differences in intelligence based on race and sex....
and political scientist Tatu Vanhanen
Tatu Vanhanen
Tatu Vanhanen is a Professor Emeritus of Political Science at the University of Tampere in Tampere, Finland...
. IQ and Global Inequality is follow-up to their 2002 book IQ and the Wealth of Nations
IQ and the Wealth of Nations
IQ and the Wealth of Nations is a controversial 2002 book by Dr. Richard Lynn, Professor Emeritus of Psychology at the University of Ulster, Northern Ireland, and Dr. Tatu Vanhanen, Professor Emeritus of Political Science at the University of Tampere, Tampere, Finland...
, an expansion of the argument that international differences in current economic development are due in part to differences in average national intelligence as indicated by national IQ estimates, and a response to critics. The book was published by the Washington Summit Publishers
Washington Summit Publishers
Washington Summit Publishers produces and sells books in the categories of anthropology, evolution, genetics, psychology, philosophy, and current events....
.
Lynn and Vanhanen's research on national IQs has attracted academic attention from several fields with both praise and criticism. Various authors have cited the book to reach further conclusions from the book's statements or to criticize or find support for the book's scores, methodology, and conclusions. Several other data sets of estimated average national cognitive ability exist as explained in nations and intelligence
Nations and intelligence
The relationship between nations and intelligence has been researched from various aspects. Estimates of average national cognitive abilities have been done in several literature reviews of worldwide IQ testing and of international student assessment studies. Especially the IQ data collections...
.
Summary
- Chapter 1 summarizes theories of economic growthEconomic growthIn economics, economic growth is defined as the increasing capacity of the economy to satisfy the wants of goods and services of the members of society. Economic growth is enabled by increases in productivity, which lowers the inputs for a given amount of output. Lowered costs increase demand...
. - Chapter 2 defines and describes intelligenceIntelligenceIntelligence has been defined in different ways, including the abilities for abstract thought, understanding, communication, reasoning, learning, planning, emotional intelligence and problem solving....
. - Chapter 3 argues that the scientific literature indicates that intelligence is a determinant of incomes and related phenomena among individuals within a number of countries.
- Chapter 4 describes the collection and determination of national IQ, presenting calculated IQs for 113 countries and estimated IQs for an additional 79 countries. This represents all countries with population greater than 40,000.
- Chapter 5 introduces a new statistic, the quality of human condition index (QHC) and 12 alternative variables that measure human conditions.
- Chapter 7 focuses on the relationship between national IQ and QHC, which Lynn and Vanhanen report to be strongly correlated.
- Chapter 8 examines the relationship between national IQ and 12 alternative variables, which Lynn and Vanhanen report are also correlated with national IQ.
- Chapter 9 discusses the genetic and environmental contributions to differences in national intelligence, and argues that racial composition of the population is a major factor.
- Chapter 10 considers the causal relationship between national IQ and important variables related to global inequality.
- Chapter 11 discusses and responds to criticisms made to Lynn and Vanhanen's theory by reviewers.
- Chapter 12 summarizes the book and discusses policy recommendations.
Significant correlations with higher national IQ were found for a number of factors: higher GDP/capita, higher adult literacy
Literacy
Literacy has traditionally been described as the ability to read for knowledge, write coherently and think critically about printed material.Literacy represents the lifelong, intellectual process of gaining meaning from print...
rate, higher gross tertiary education
Tertiary education
Tertiary education, also referred to as third stage, third level, and post-secondary education, is the educational level following the completion of a school providing a secondary education, such as a high school, secondary school, university-preparatory school...
enrollment ratio, higher life expectancy
Life expectancy
Life expectancy is the expected number of years of life remaining at a given age. It is denoted by ex, which means the average number of subsequent years of life for someone now aged x, according to a particular mortality experience...
at birth, higher level of democratization
Democratization
Democratization is the transition to a more democratic political regime. It may be the transition from an authoritarian regime to a full democracy, a transition from an authoritarian political system to a semi-democracy or transition from a semi-authoritarian political system to a democratic...
2002 (Tatu Vanhanen's Index of Democratization), higher Human Development Index
Human Development Index
The Human Development Index is a composite statistic used to rank countries by level of "human development" and separate "very high human development", "high human development", "medium human development", and "low human development" countries...
, higher Gender-related Development Index
Gender-related Development Index
The Gender-related Development Index and the Gender Empowerment Measure were introduced in 1995 in the Human Development Report written by the United Nations Development Program. The aim of these measurements was to add a gender-sensitive dimension to the HDI. The first measurement that they...
, higher economic growth
Economic growth
In economics, economic growth is defined as the increasing capacity of the economy to satisfy the wants of goods and services of the members of society. Economic growth is enabled by increases in productivity, which lowers the inputs for a given amount of output. Lowered costs increase demand...
rate, lower Gini index of inequality in income or consumption, lower population below the $2 a day international poverty line, lower measures of undernourishment, lower maternal mortality ratio, lower infant mortality
Infant mortality
Infant mortality is defined as the number of infant deaths per 1000 live births. Traditionally, the most common cause worldwide was dehydration from diarrhea. However, the spreading information about Oral Re-hydration Solution to mothers around the world has decreased the rate of children dying...
rate, higher Corruption Perceptions Index
Corruption Perceptions Index
Since 1995, Transparency International publishes the Corruption Perceptions Index annually ranking countries "by their perceived levels of corruption, as determined by expert assessments and opinion surveys." The CPI generally defines corruption as "the misuse of public power for private...
, higher Economic Freedom of the World ratings, higher Index of Economic Freedom
Index of Economic Freedom
The Index of Economic Freedom is a series of 10 economic measurements created by The Heritage Foundation and The Wall Street Journal. Its stated objective is to measure the degree of economic freedom in the world's nations....
ratings, and more narrow population pyramid
Population pyramid
A population pyramid, also called an age structure diagram, is a graphical illustration that shows the distribution of various age groups in a population , which forms the shape of a pyramid when the population is growing...
(MU Index).
Reception
The book received a mixed reception ranging from praise to dismissal.In a review J. Philippe Rushton
J. Philippe Rushton
Jean Philippe Rushton is a Canadian psychology professor at the University of Western Ontario who is most widely known for his work on racial group differences, such as research on race and intelligence, race and crime, and the application of r/K selection theory to humans in his book Race,...
, President of the Pioneer fund
Pioneer Fund
The Pioneer Fund is an American non-profit foundation established in 1937 "to advance the scientific study of heredity and human differences." Currently headed by psychology professor J. Philippe Rushton, the fund states that it focuses on projects it perceives will not be easily funded due to...
that has been a long time funder of research by Lynn, writes that the book extends and answers criticisms against the earlier work in several ways. The number of nations for which there were IQ tests available increased from 81 to 113. The correlation between IQ and income per person was 0.68 which is virtually identical to the one reported in the earlier book. The book compared the IQ values for the 32 new nations for which IQ tests were available with the estimations for these nations in the earlier book which was based on averaging neighboring nations values. The correlation of 0.91 was very high. Rushton thus conclude that this method is remarkably accurate.
Rushton states that the authors also compared the results of the IQ tests for those nations were several were available (71 nations). They found a very high correlation of 0.95 and thus concluded that the IQ testing have a very high reliability regarding measuring IQ. The authors furthermore compared the national IQs to national scores of school students in tests of mathematics and science. The correlations were between 0.79 and 0.89. This, Rushton writes, establishes that the national IQs have very high validity as measures of national differences in cognitive ability.
The authors argue for a substantial role of genetics and race in explaining these differences. They were led to this conclusion from observing racial clusters regarding national IQs. Thus, the six East Asian nations all have IQs in the range between 105 and 108. The 29 European nations all have IQs in the range between 92 and 102. The 19 nations of sub-Saharan Africa all have IQs in the range between 59 and 73. Rushton thus argues that "They show that there is remarkable consistency in the IQs of nations when these are classified into racial clusters." The book also argues for feedback between genes and environment. For instance, a genetically caused high national IQ leads to high per capita incomes which enables high quality nutrition, education and health care for children which enhance their intelligence.
Kanazawa when commenting on using the book as a data source makes statements similar to Rushton's.
The methods of the study were criticized by Richard E. Nisbett
Richard E. Nisbett
Richard Nisbett is Theodore M. Newcomb Distinguished Professor of social psychology and co-director of the Culture and Cognition program at the University of Michigan at Ann Arbor. Nisbett's research interests are in social cognition, culture, social class, and aging. He received his Ph.D...
for relying on small and haphazard samples and for ignoring data that did not support the conclusions.
In an article published in European Journal of Personality, Heiner Rindermann compared the IQ scores from the book to a large number of international student assessment studies on subjects such as reading, mathematics, science, and problem solving, and found them to be highly intercorrelated. Statistical analyses indicated that the results could be explained by an underlying general cognitive ability. More than 30 commentaries on Rindermann's findings were published in the same issue of the journal.
The study A systematic literature review of the average IQ of sub-Saharan Africans by Jelte M. Wicherts and colleagues stated that:
-
- "For instance, Lynn and Vanhanen (2006) accorded a national IQ of 69 to Nigeria on the basis of three samples (Fahrmeier, 1975; Ferron, 1965; Wober, 1969), but they did not consider other relevant published studies that indicated that average IQ in Nigeria is considerably higher than 70 (Maqsud, 1980a,b; Nenty & Dinero, 1981; Okunrotifa, 1976). As Lynn rightly remarked during the 2006 conference of the International Society for Intelligence Research (ISIR), performing a literature review involves making a lot of choices. Nonetheless, an important drawback of Lynn (and Vanhanen)'s reviews of the literature is that they are unsystematicSystematic reviewA systematic review is a literature review focused on a research question that tries to identify, appraise, select and synthesize all high quality research evidence relevant to that question. Systematic reviews of high-quality randomized controlled trials are crucial to evidence-based medicine...
."
- "For instance, Lynn and Vanhanen (2006) accorded a national IQ of 69 to Nigeria on the basis of three samples (Fahrmeier, 1975; Ferron, 1965; Wober, 1969), but they did not consider other relevant published studies that indicated that average IQ in Nigeria is considerably higher than 70 (Maqsud, 1980a,b; Nenty & Dinero, 1981; Okunrotifa, 1976). As Lynn rightly remarked during the 2006 conference of the International Society for Intelligence Research (ISIR), performing a literature review involves making a lot of choices. Nonetheless, an important drawback of Lynn (and Vanhanen)'s reviews of the literature is that they are unsystematic
However, the study also did its own literature review on the average IQ of sub-Saharan Africans. It did not find as low a value as the book, below 70, but the estimated average value of 82 is still low compared to industrialized nations. Regarding four studies comparing and finding agreement between Lynn's estimated national IQs and the international student assessment tests, they disagree regarding sub-Saharan Africa but write "these four studies appear to validate national IQs in other parts of the world."
Richard Lynn and Gerhard Meisenberg in turn replied that "critical evaluation of the studies presented by WDM shows that many of these are based on unrepresentative elite samples" and that a further literature review, including taking into account results in mathematics, science, and reading, gave "an IQ of 68 as the best reading of the IQ in sub-Saharan Africa". Wicherts and colleagues in yet another reply stated: "In light of all the available IQ data of over 37,000 African testtakers, only the use of unsystematic methods to exclude the vast majority of data could result in a mean IQ close to 70. On the basis of sound methods, the average IQ remains close to 80. Although this mean IQ is clearly lower than 100, we view it as unsurprising in light of the potential of the Flynn Effect
Flynn effect
The Flynn effect is the name given to a substantial and long-sustained increase in intelligence test scores measured in many parts of the world. When intelligence quotient tests are initially standardized using a sample of test-takers, by convention the average of the test results is set to 100...
in Africa (Wicherts, Borsboom, & Dolan, 2010) and common psychometric problems associated with the use of western IQ tests among Africans."
Consequently, some later studies using average national IQ data have checked their results against both data sets.
Jones and Schneider commenting on the differences to the earlier book write "LV (2002) assembled results from 183 conventional IQ tests, both verbal and visual, given in 81 countries across the entire 20th century;they used hundreds of IQ tests from 113 countries across centuries in LV (2006). They aggregated these results using best practice methods to create estimates of “national average IQ” for these countries. LV show in those works as well as in Lynn (2006) that the IQ gaps between regions of the world have not appreciably changed during the 20th century."
Quality of human conditions index
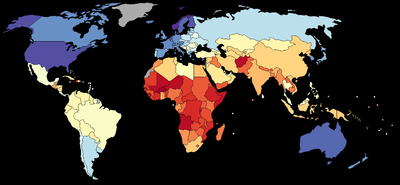
- purchasing power parityPurchasing power parityIn economics, purchasing power parity is a condition between countries where an amount of money has the same purchasing power in different countries. The prices of the goods between the countries would only reflect the exchange rates...
Gross National IncomeGross National IncomeThe GNI consists of: the personal consumption expenditures, the gross private investment, the government consumption expenditures, the net income from assets abroad , and the gross exports of goods and services, after deducting two components: the gross imports of goods and services, and the...
(PPP-GNI) per capita 2002 - adult literacy rate 2002
- gross tertiary enrollment ratio
- life expectancy at birth 2002
- the level of democratizationDemocratizationDemocratization is the transition to a more democratic political regime. It may be the transition from an authoritarian regime to a full democracy, a transition from an authoritarian political system to a semi-democracy or transition from a semi-authoritarian political system to a democratic...
2002 (Tatu Vanhanen's Index of Democratization)
Values of the index range from 10.7 (Burkina Faso
Burkina Faso
Burkina Faso – also known by its short-form name Burkina – is a landlocked country in west Africa. It is surrounded by six countries: Mali to the north, Niger to the east, Benin to the southeast, Togo and Ghana to the south, and Côte d'Ivoire to the southwest.Its size is with an estimated...
) to 89 (Norway
Norway
Norway , officially the Kingdom of Norway, is a Nordic unitary constitutional monarchy whose territory comprises the western portion of the Scandinavian Peninsula, Jan Mayen, and the Arctic archipelago of Svalbard and Bouvet Island. Norway has a total area of and a population of about 4.9 million...
). Lynn and Vanhanen write that they would have preferred to include a sixth measure, an indicator of income inequality, but that statistical data for that variable was not available for all countries. They write that the QHC index differs significantly from other widely used indexes (such as the Human Development Index) in that QHC also measures democratization
Democratization
Democratization is the transition to a more democratic political regime. It may be the transition from an authoritarian regime to a full democracy, a transition from an authoritarian political system to a semi-democracy or transition from a semi-authoritarian political system to a democratic...
. Some of their claims have received support in a 2007 study by Rindermann.
| All countries | Calculated IQ (113 countries) |
Estimated IQ (79 countries) |
Total (192 countries) |
|---|---|---|---|
| QHC | 0.805 | 0.725 | 0.791 |
| PPP GNI per capita 2002 | 0.693 | 0.342 | 0.616 |
| Adult literacy rate 2002 | 0.642 | 0.655 | 0.655 |
| Tertiary enrollment ratio | 0.746 | 0.699 | 0.745 |
| Life expectancy at birth 2002 | 0.765 | 0.690 | 0.750 |
| Index of Democratization 2002 | 0.569 | 0.322 | 0.530 |
| Excluding smallest countries | Calculated IQ (98 countries) |
Estimate IQ (62 countries) |
Total (160 countries) |
| QHC | 0.846 | 0.800 | 0.839 |
| PPP GNI per capita 2002 | 0.739 | 0.266 | 0.649 |
| Adult literacy rate 2002 | 0.710 | 0.746 | 0.733 |
| Tertiary enrollment ratio | 0.778 | 0.734 | 0.780 |
| Life expectancy at birth 2002 | 0.833 | 0.753 | 0.817 |
| Index of Democratization 2002 | 0.598 | 0.408 | 0.584 |
Other measures of global inequality
The relationship of national IQ to twelve other measures of global inequality were examined.- Human Development IndexHuman Development IndexThe Human Development Index is a composite statistic used to rank countries by level of "human development" and separate "very high human development", "high human development", "medium human development", and "low human development" countries...
(HDI) - Gender-related Development IndexGender-related Development IndexThe Gender-related Development Index and the Gender Empowerment Measure were introduced in 1995 in the Human Development Report written by the United Nations Development Program. The aim of these measurements was to add a gender-sensitive dimension to the HDI. The first measurement that they...
(GDI) - Economic growth rate (EGR)
- Gini indexGini coefficientThe Gini coefficient is a measure of statistical dispersion developed by the Italian statistician and sociologist Corrado Gini and published in his 1912 paper "Variability and Mutability" ....
of inequality in income or consumption (Gini) - Population below $2 a day international poverty line (Poverty)
- Measures of undernourishment (PUN)
- Maternal mortality ratio (MMR) and infant mortality rate (IMR)
- Corruption Perceptions IndexCorruption Perceptions IndexSince 1995, Transparency International publishes the Corruption Perceptions Index annually ranking countries "by their perceived levels of corruption, as determined by expert assessments and opinion surveys." The CPI generally defines corruption as "the misuse of public power for private...
(CPI) - Economic freedom ratingsIndices of Economic FreedomThe annual survey Economic Freedom of the World is an indicator produced by the Fraser Institute, a Canadian think tank which attempts to measure the degree of economic freedom in the world's nations. This indicator has been used in peer-reviewed studies some of which have found a range of...
(EFR) - the Index of Economic FreedomIndices of Economic FreedomThe annual survey Economic Freedom of the World is an indicator produced by the Fraser Institute, a Canadian think tank which attempts to measure the degree of economic freedom in the world's nations. This indicator has been used in peer-reviewed studies some of which have found a range of...
(IEF) - Population pyramidPopulation pyramidA population pyramid, also called an age structure diagram, is a graphical illustration that shows the distribution of various age groups in a population , which forms the shape of a pyramid when the population is growing...
s (MU-index) - Human happiness and life-satisfaction.
All twelve measures of global inequality are significantly correlated with the QHC index. According to the book, eleven of the twelve measures are significantly correlated with national IQ. The measures of human happiness and life satisfaction are not significantly correlated with national IQ.
| Correlations | IQ | QHC |
|---|---|---|
| HDI | 0.776 | 0.940 |
| GDI | 0.849 | 0.951 |
| EGR 3 | 0.747 | 0.840 |
| EGR 4 | 0.709 | 0.871 |
| Gini | −0.538 | −0.464 |
| Poverty | −0.653 | −0.799 |
| PUN 1 | −0.500 | −0.648 |
| MMR | −0.730 | −0.759 |
| IMR | −0.771 | −0.861 |
| CPI | 0.591 | 0.762 |
| EFR | 0.606 | 0.674 |
| IEF | 0.418 | 0.620 |
| MU-index | 0.806 | 0.902 |
| Happiness | 0.029 | 0.315 |
| Life satisfaction | 0.033 | 0.396 |
Latitude and temperature
| Correlation | Latitude | Temperature |
|---|---|---|
| Degrees latitude | 1 | -0.885 |
| Annual mean temperature | -0.885 | 1 |
| National IQ | 0.677 | -0.632 |
| QHC | 0.659 | -0.562 |
| PPP GNI per capita 2002 | 0.528 | -0.407 |
| Adult literacy rate 2002 | 0.482 | -0.467 |
| Tertiary enrollment ratio | 0.718 | -0.649 |
| Life expectancy at birth 2002 | 0.505 | -0.379 |
| Index of Democratization 2002 | 0.512 | -0.460 |
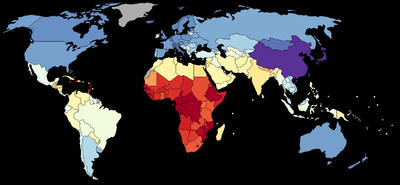
National IQ and QHC values
Lynn and Vanhanen base their analysis on data gathered from a literature review. They selected IQ data from studies which covered 113 nations. For another 79 nations, they estimated the mean IQs on the basis of the arithmetic means of the measured IQs of neighboring countries. They justify this method of estimation by pointing out that the correlation between the estimated national IQs they reported in IQ and the Wealth of NationsIQ and the Wealth of Nations
IQ and the Wealth of Nations is a controversial 2002 book by Dr. Richard Lynn, Professor Emeritus of Psychology at the University of Ulster, Northern Ireland, and Dr. Tatu Vanhanen, Professor Emeritus of Political Science at the University of Tampere, Tampere, Finland...
and the measured national IQs since obtained is very high (0.913). In the chart below, these estimates have been marked with an asterisk (*). The chart also includes the measured and estimated IQs from IQ and the Wealth of Nations
IQ and the Wealth of Nations
IQ and the Wealth of Nations is a controversial 2002 book by Dr. Richard Lynn, Professor Emeritus of Psychology at the University of Ulster, Northern Ireland, and Dr. Tatu Vanhanen, Professor Emeritus of Political Science at the University of Tampere, Tampere, Finland...
.
Lynn and Vanhanen calculated the national IQs in relation to a British
Great Britain
Great Britain or Britain is an island situated to the northwest of Continental Europe. It is the ninth largest island in the world, and the largest European island, as well as the largest of the British Isles...
mean of 100, with a standard deviation
Standard deviation
Standard deviation is a widely used measure of variability or diversity used in statistics and probability theory. It shows how much variation or "dispersion" there is from the average...
of 15. They adjusted all test results to account for the Flynn effect
Flynn effect
The Flynn effect is the name given to a substantial and long-sustained increase in intelligence test scores measured in many parts of the world. When intelligence quotient tests are initially standardized using a sample of test-takers, by convention the average of the test results is set to 100...
: adjustments were 2 points per decade for Raven's Progressive Matrices
Raven's Progressive Matrices
Raven's Progressive Matrices are non-verbal multiple choice measures of the reasoning component of Spearman's g , which is often referred to as general intelligence. The tests were originally developed by John C. Raven in 1936...
and 3 points per decade for all other types of tests. When two IQ studies were used from one country, their mean was calculated, whereas when three or more were available, the median was used. Lynn and Vanhanen recommend the provision of iodine and other micronutrients as a way to increase cognitive functioning in the Third World
Third World
The term Third World arose during the Cold War to define countries that remained non-aligned with either capitalism and NATO , or communism and the Soviet Union...
. The book additionally states that part of the reason IQ's have shrunk since the prior book was published, is due to more immigration from the Third World
Third World
The term Third World arose during the Cold War to define countries that remained non-aligned with either capitalism and NATO , or communism and the Soviet Union...
. Sweden's IQ for example dropped from 101% to 99%, and Germany 101 to 99. Since national immigration has been active prior to the first book, ethnic IQ is most likely even higher.
| Country/Region | IQ (2002) | IQ (2006) | PPP-GNI per capita 2002 | QHC |
|---|---|---|---|---|
 Hong Kong Hong Kong |
107 | 108 | 27,490 | 60.8 |
 Singapore Singapore |
103 | 108 | 23,730 | 60.7 |
 North Korea North Korea |
105* | 106* | 1,000 | 38 |
 South Korea South Korea |
106 | 106 | 16,960 | 75.4 |
 Japan Japan |
105 | 105 | 27,380 | 71.4 |
| 104 | 105 | 23,400 | 79.4 | |
 People's Republic of China People's Republic of China |
100 | 105 | 4,520 | 39.7 |
 Italy Italy |
102 | 102 | 26,170 | 78.9 |
 Iceland Iceland |
98* | 101 | 29,240 | 80 |
 Mongolia Mongolia |
98* | 101* | 1,710 | 48.1 |
 Switzerland Switzerland |
101 | 101 | 31,840 | 82.2 |
 Austria Austria |
102 | 100 | 28,910 | 80.7 |
 Bosnia and Herzegovina Bosnia and Herzegovina |
N/A | 100 | 15,800 | 61.4 |
 Luxembourg Luxembourg |
101* | 100* | 53,230 | 76.4 |
 Netherlands Netherlands |
102 | 100 | 28,350 | 82.8 |
 Norway Norway |
98 | 100 | 36,690 | 89 |
 United Kingdom United Kingdom |
100 | 100 | 26,580 | 76.7 |
 Germany Germany |
102 | 99 | 26,980 | 78 |
 Belgium Belgium |
100 | 99 | 28,130 | 84.1 |
 Canada Canada |
97 | 99 | 28,930 | 77.8 |
 Estonia Estonia |
97* | 99 | 11,630 | 64.5 |
 Finland Finland |
97 | 99 | 26,160 | 85.1 |
 New Zealand New Zealand |
100 | 99 | 20,550 | 76.2 |
 Poland Poland |
99 | 99 | 10,450 | 62.7 |
 Sweden Sweden |
101 | 99 | 25,820 | 82.9 |
 Andorra Andorra |
N/A | 98* | 19,000 | 58.7 |
 Spain Spain |
99 | 98 | 21,910 | 75.8 |
 Australia Australia |
98 | 98 | 27,440 | 82.8 |
 Czech Republic Czech Republic |
97 | 98 | 14,920 | 64.5 |
 Denmark Denmark |
98 | 98 | 30,600 | 85.4 |
 Early Modern France Early Modern France |
98 | 98 | 27,040 | 78.1 |
 Hungary Hungary |
99 | 98 | 13,070 | 64.1 |
 Latvia Latvia |
97* | 98* | 9,190 | 65.5 |
 United States United States |
98* | 98* | 36,120 | 86.6 |
 Belarus Belarus |
96* | 97* | 5,500 | 57.2 |
 Malta Malta |
95* | 97 | 17,710 | 66.4 |
 Russia Russia |
96 | 97 | 8,080 | 64.5 |
 Ukraine Ukraine |
96* | 97* | 4,800 | 61.8 |
 Moldova Moldova |
95* | 96* | 1,600 | 46.2 |
 Slovakia Slovakia |
96 | 96 | 12,590 | 63.2 |
 Uruguay Uruguay |
96 | 96 | 7,710 | 64 |
 Israel Israel |
94 | 95 | 19,000 | 75.3 |
 Portugal Portugal |
95 | 95 | 17,820 | 67 |
 Armenia Armenia |
93* | 94* | 3,230 | 50.2 |
 Georgia (country) Georgia (country) |
93* | 94* | 2,270 | 51.2 |
 Kazakhstan Kazakhstan |
93* | 94* | 5,630 | 49 |
 Kingdom of Romania Kingdom of Romania |
94 | 94 | 6,490 | 53 |
 Vietnam Vietnam |
96* | 94* | 2,300 | 39.6 |
 Argentina Argentina |
96 | 93 | 10,190 | 64.7 |
 Kingdom of Bulgaria Kingdom of Bulgaria |
93 | 93 | 7,030 | 59.1 |
 Greece Greece |
94 | 92 | 18,770 | 76.1 |
 Libya Libya |
87 | 92 | 21,570 | 72.3 |
 Malaysia Malaysia |
92 | 92 | 8,500 | 78.5 |
 Republic of Ireland Republic of Ireland |
93 | 92 | 29,570 | 52.1 |
 Brunei Brunei |
92* | 91* | 19,210 | 50.8 |
 Cambodia Cambodia |
89* | 91* | 1,970 | 28.6 |
 Independent State of Croatia Independent State of Croatia |
97 | 91 | 10,000 | 61.7 |
 Cyprus Cyprus |
92* | 91* | 18,650 | 67.6 |
 Lithuania Lithuania |
97* | 91 | 10,190 | 65.4 |
 Republic of Macedonia Republic of Macedonia |
93* | 91* | 6,420 | 54.4 |
 Thailand Thailand |
91 | 91 | 6,890 | 50.3 |
 Albania Albania |
93* | 90* | 4,960 | 51.2 |
 Bermuda Bermuda |
N/A | 90 | 36,000 | 75.8 |
 Chile Chile |
93* | 90 | 9,420 | 59.5 |
 Indonesia Indonesia |
91 | 90 | 3,600 | 40.1 |
 Kyrgyzstan Kyrgyzstan |
87* | 90* | 1,560 | 48.1 |
 Suriname Suriname |
91 | 90 | 6,590 | 50.6 |
 Turkey Turkey |
90 | 90 | 6,300 | 50.2 |
 Mexico Mexico |
87 | 90 | 12,500 | 52.9 |
 Cook Islands Cook Islands |
N/A | 89 | 5,000 | 45.7 |
 Costa Rica Costa Rica |
91* | 89* | 8,650 | 53.7 |
 Laos Laos |
89* | 89 | 1,660 | 24.9 |
 Mauritius Mauritius |
81* | 89 | 10,820 | 52.2 |
 Ecuador Ecuador |
80 | 88 | 3,340 | 47.4 |
 Samoa Samoa |
87 | 88 | 5,570 | 49.7 |
 Algeria Algeria |
84 | 87 | 5,530 | 39.9 |
 Azerbaijan Azerbaijan |
87* | 87* | 3,010 | 47.2 |
 Bolivia Bolivia |
85* | 87 | 2,390 | 49.7 |
 Brazil Brazil |
87 | 87 | 7,450 | 51.1 |
 East Timor East Timor |
N/A | 87* | 3,940 | 46.7 |
 Guyana Guyana |
84* | 87* | 3,070 | 40.2 |
 Iraq Iraq |
87 | 87 | 1,027 | 30.7 |
 Myanmar Myanmar |
86* | 87* | 930 | 42.4 |
 Tajikistan Tajikistan |
87* | 87* | 1,640 | 27.5 |
 Turkmenistan Turkmenistan |
87* | 87* | 4,780 | 41.7 |
 Uzbekistan Uzbekistan |
87* | 87* | 1,640 | 39.4 |
 Kuwait Kuwait |
83* | 86 | 17,780 | 49.9 |
 Philippines Philippines |
86 | 86 | 4,450 | 51.6 |
 Seychelles Seychelles |
81* | 86* | 18,232 | 60.6 |
 Tonga Tonga |
87 | 86 | 6,820 | 40.5 |
 Tunisia Tunisia |
87* | 86 | 6,440 | 40.6 |
 Cuba Cuba |
85 | 85 | 5,259 | 46.2 |
 Fiji Fiji |
84 | 85 | 5,330 | 51.9 |
 Kiribati Kiribati |
84* | 85* | 800 | 37.1 |
 New Caledonia New Caledonia |
N/A | 85 | 21,960 | 54.9 |
 Peru Peru |
90 | 85 | 4,880 | 49.2 |
 Trinidad and Tobago Trinidad and Tobago |
80* | 85* | 9,000 | 52 |
 Yemen Yemen |
83* | 85 | 800 | 24.5 |
 Afghanistan Afghanistan |
83* | 84* | 700 | 13.2 |
 Belize Belize |
83* | 84* | 15,960 | 56.1 |
 Colombia Colombia |
88 | 84 | 5,490 | 44.2 |
 Egypt Egypt |
83 | 84 | 3,810 | 37.3 |
 Federated States of Micronesia Federated States of Micronesia |
84* | 84* | 6,150 | 48.4 |
 Iran Iran |
84 | 84 | 6,690 | 40.2 |
 Jordan Jordan |
87* | 84 | 4,180 | 43.4 |
 Lebanon Lebanon |
88 | 84 | 4,900 | 55.8 |
 Marshall Islands Marshall Islands |
84 | 84 | 1,600 | 44.2 |
 Morocco Morocco |
85 | 84 | 2,000 | 39.9 |
 Pakistan Pakistan |
81* | 84 | 1,730 | 31.7 |
 Panama Panama |
84* | 84* | 1,960 | 26.2 |
 Paraguay Paraguay |
85* | 84 | 6,060 | 56.6 |
 Puerto Rico Puerto Rico |
84 | 84 | 4,590 | 45.2 |
 Saudi Arabia Saudi Arabia |
83* | 84* | 15,800 | 63.6 |
 Solomon Islands Solomon Islands |
84* | 84* | 12,660 | 44.1 |
 The Bahamas The Bahamas |
78* | 84* | 1,590 | 41.5 |
 United Arab Emirates United Arab Emirates |
83* | 84* | 24,030 | 48.8 |
 Vanuatu Vanuatu |
84* | 84* | 2,850 | 31.4 |
 Venezuela Venezuela |
88* | 84 | 5,220 | 47.4 |
 Bahrain Bahrain |
83* | 83* | 16,190 | 49.3 |
 Oman Oman |
83* | 83* | 13,000 | 40.6 |
 Papua New Guinea Papua New Guinea |
84* | 83 | 2,180 | 38.4 |
 Syria Syria |
87* | 83 | 5,348 | 38.9 |
 Bangladesh Bangladesh |
81* | 82* | 1,720 | 29.8 |
 Dominican Republic Dominican Republic |
84* | 82 | 6,270 | 46.8 |
 Qatar Qatar |
81 | 82 | 19,650 | 56.3 |
 Madagascar Madagascar |
79* | 82 | 730 | 28.6 |
 Honduras Honduras |
84* | 81 | 2,540 | 41.9 |
 Maldives Maldives |
81* | 81* | 4,798 | 38.5 |
 Nicaragua Nicaragua |
84* | 81* | 2,350 | 41.3 |
 Northern Mariana Islands Northern Mariana Islands |
N/A | 81 | 12,500 | 51.3 |
 Barbados Barbados |
78 | 80 | 14,660 | 60.9 |
 Bhutan Bhutan |
78* | 80* | 1,969 | 24.1 |
 El Salvador El Salvador |
84* | 80* | 4,790 | 42.6 |
 Guatemala Guatemala |
79 | 79 | 4,040 | 34.6 |
 India India |
81 | 79 | 2,844 | 25.6 |
 Sri Lanka Sri Lanka |
81* | 79 | 3,510 | 47.7 |
 Nepal Nepal |
78 | 78 | 1,370 | 26.9 |
 Comoros Comoros |
79* | 77* | 1,640 | 24.6 |
 Cape Verde Cape Verde |
78* | 76* | 4,920 | 40.5 |
 Mauritania Mauritania |
73* | 76* | 1,790 | 20.5 |
 Sudan Sudan |
74 | 73 | 1,740 | 24.6 |
 Uganda Uganda |
73 | 73 | 1,360 | 25.4 |
 Chad Chad |
73 | 72 | 1,010 | 20.4 |
 Kenya Kenya |
72 | 72 | 1,010 | 27.3 |
 South Africa South Africa |
72 | 72 | 9,810 | 38.3 |
 Tanzania Tanzania |
72 | 72 | 580 | 23.2 |
 Ghana Ghana |
71 | 71 | 2,080 | 33.7 |
 Grenada Grenada |
75* | 71* | 6,600 | 45.3 |
 Jamaica Jamaica |
72 | 71 | 3,680 | 46.5 |
 Saint Vincent and the Grenadines Saint Vincent and the Grenadines |
75* | 71 | 5,190 | 48.4 |
 Zambia Zambia |
77 | 71 | 800 | 21.8 |
 Antigua and Barbuda Antigua and Barbuda |
75* | 70* | 10,390 | 53.2 |
 Benin Benin |
69* | 70* | 1,060 | 20.5 |
 Botswana Botswana |
72* | 70* | 7,740 | 29.4 |
 Namibia Namibia |
72* | 70* | 6,880 | 31.1 |
 Rwanda Rwanda |
70* | 70* | 1,260 | 18.5 |
 Togo Togo |
69* | 70* | 1,450 | 26 |
 Burundi Burundi |
70* | 69* | 630 | 15.2 |
 Côte d'Ivoire Côte d'Ivoire |
71* | 69* | 1,450 | 18.1 |
 Malawi Malawi |
71* | 69* | 570 | 24.3 |
 Mali Mali |
68* | 69* | 840 | 13.4 |
 Niger Niger |
67* | 69* | 800 | 13.5 |
 Nigeria Nigeria |
67 | 69 | 800 | 27.3 |
 Angola Angola |
69* | 68* | 1,840 | 13.7 |
 Burkina Faso Burkina Faso |
66* | 68* | 1,090 | 10.7 |
 Djibouti Djibouti |
68* | 68* | 2,040 | 22 |
 Eritrea Eritrea |
68* | 68* | 1,040 | 21.4 |
 Somalia Somalia |
68* | 68* | 500 | 15.2 |
 Swaziland Swaziland |
72* | 68* | 4,730 | 22.2 |
 Dominica Dominica |
75* | 67 | 4,960 | 48.8 |
 Guinea Guinea |
63 | 67 | 2,060 | 22.5 |
 Guinea-Bissau Guinea-Bissau |
63* | 67* | 680 | 20.3 |
 Haiti Haiti |
72* | 67* | 1,610 | 20.4 |
 Lesotho Lesotho |
72* | 67* | 2,970 | 24.3 |
 Liberia Liberia |
64* | 67* | 1,000 | 21.2 |
 Saint Kitts and Nevis Saint Kitts and Nevis |
75* | 67* | 10,750 | 45.5 |
 São Tomé and Príncipe São Tomé and Príncipe |
59* | 67* | 1,317 | 37.9 |
 Senegal Senegal |
64* | 66* | 1,660 | 20.7 |
 The Gambia The Gambia |
64* | 66* | 1,540 | 21.3 |
 Zimbabwe Zimbabwe |
66 | 66 | 2,180 | 25.2 |
 Republic of the Congo Republic of the Congo |
73 | 65 | 630 | 17.9 |
 Cameroon Cameroon |
70* | 64 | 1,910 | 23.1 |
 Central African Republic Central African Republic |
68* | 64 | 1,170 | 19.1 |
 Democratic Republic of the Congo Democratic Republic of the Congo |
65 | 64 | 700 | 26.9 |
 Ethiopia Ethiopia |
71 | 71 | 780 | 29.7 |
 Gabon Gabon |
66* | 64* | 5,530 | 32.2 |
 Mozambique Mozambique |
72* | 64 | 990 | 18 |
 Sierra Leone Sierra Leone |
64 | 64 | 500 | 13.8 |
 Saint Lucia Saint Lucia |
75* | 62 | 4,950 | 51.1 |
 Equatorial Guinea Equatorial Guinea |
59 | 59 | 9,100 | 30.4 |
- "*" Denotes National IQ values estimated by Lynn and Vanhanen.
- PPP-GNI = purchasing power parityPurchasing power parityIn economics, purchasing power parity is a condition between countries where an amount of money has the same purchasing power in different countries. The prices of the goods between the countries would only reflect the exchange rates...
gross national incomeGross National IncomeThe GNI consists of: the personal consumption expenditures, the gross private investment, the government consumption expenditures, the net income from assets abroad , and the gross exports of goods and services, after deducting two components: the gross imports of goods and services, and the...
. - QHC = is a composite index called quality of human conditions.
In summer 2010 Lynn updated the IQ scores presented in the book, calculating national IQ scores for 25 countries which had previously been estimated only from neighboring nations, and revising national IQ scores for 16 other countries.
See also
Theories of Race and Intelligence:- Evolution of human intelligence
- Cattell Culture Fair IIICattell Culture Fair IIIIn seeking to develop a culture-fair intelligence or IQ test that separated environmental and genetic factors, Raymond B. Cattell created the CFIT or Culture Fair Intelligence Test. Cattell argued that general intelligence exists and that it consists of fluid intelligence and crystallized...
- Intelligence and public policyIntelligence and public policyA large body of research indicates that intelligence measures such as Intelligence Quotient varies between individuals and between certain groups, and that they correlate with socially important outcomes such as educational achievement, employment, crime, poverty and socioeconomic status.In the...
- RacismRacismRacism is the belief that inherent different traits in human racial groups justify discrimination. In the modern English language, the term "racism" is used predominantly as a pejorative epithet. It is applied especially to the practice or advocacy of racial discrimination of a pernicious nature...
Publications of Race and Intelligence:
- IQ and the Wealth of NationsIQ and the Wealth of NationsIQ and the Wealth of Nations is a controversial 2002 book by Dr. Richard Lynn, Professor Emeritus of Psychology at the University of Ulster, Northern Ireland, and Dr. Tatu Vanhanen, Professor Emeritus of Political Science at the University of Tampere, Tampere, Finland...
- The Mismeasure of ManThe Mismeasure of ManThe Mismeasure of Man , by Stephen Jay Gould, is a history and critique of the statistical methods and cultural motivations underlying biological determinism, the belief that “the social and economic differences between human groups — primarily races, classes, and sexes — arise from inherited,...
- Race Differences in IntelligenceRace Differences in IntelligenceRace Differences in Intelligence: An Evolutionary Analysis is a 2006 book by controversial race and intelligence writer Richard Lynn reviewing the worldwide literature on IQ testing and arguing for in part genetic racial differences and with a discussion on the causes and consequences.-Overview:As...
- The Global Bell CurveThe Global Bell CurveThe Global Bell Curve: Race, IQ, and Inequality Worldwide is a book by Professor Richard Lynn, published by Washington Summit Publishers, June 2008...