

Demographics of Albania
Encyclopedia
Demographics
Demographics are the most recent statistical characteristics of a population. These types of data are used widely in sociology , public policy, and marketing. Commonly examined demographics include gender, race, age, disabilities, mobility, home ownership, employment status, and even location...
features of the population
Population
A population is all the organisms that both belong to the same group or species and live in the same geographical area. The area that is used to define a sexual population is such that inter-breeding is possible between any pair within the area and more probable than cross-breeding with individuals...
of Albania
Albania
Albania , officially known as the Republic of Albania , is a country in Southeastern Europe, in the Balkans region. It is bordered by Montenegro to the northwest, Kosovo to the northeast, the Republic of Macedonia to the east and Greece to the south and southeast. It has a coast on the Adriatic Sea...
, including population density
Population density
Population density is a measurement of population per unit area or unit volume. It is frequently applied to living organisms, and particularly to humans...
, ethnicity
Ethnic group
An ethnic group is a group of people whose members identify with each other, through a common heritage, often consisting of a common language, a common culture and/or an ideology that stresses common ancestry or endogamy...
, education level, health of the populace, economic status, religious affiliations and other aspects of the population.
Ethnic groups
- AlbanianAlbaniansAlbanians are a nation and ethnic group native to Albania and neighbouring countries. They speak the Albanian language. More than half of all Albanians live in Albania and Kosovo...
: 95% - GreekGreeksThe Greeks, also known as the Hellenes , are a nation and ethnic group native to Greece, Cyprus and neighboring regions. They also form a significant diaspora, with Greek communities established around the world....
: 3% - other: 2% AromaniansAromaniansAromanians are a Latin people native throughout the southern Balkans, especially in northern Greece, Albania, the Republic of Macedonia, Bulgaria, and as an emigrant community in Serbia and Romania . An older term is Macedo-Romanians...
(VlachsVlachsVlach is a blanket term covering several modern Latin peoples descending from the Latinised population in Central, Eastern and Southeastern Europe. English variations on the name include: Walla, Wlachs, Wallachs, Vlahs, Olahs or Ulahs...
), Roma (Gypsy), SerbsSerbsThe Serbs are a South Slavic ethnic group of the Balkans and southern Central Europe. Serbs are located mainly in Serbia, Montenegro and Bosnia and Herzegovina, and form a sizable minority in Croatia, the Republic of Macedonia and Slovenia. Likewise, Serbs are an officially recognized minority in...
, MacedoniansMacedonians (ethnic group)The Macedonians also referred to as Macedonian Slavs: "... the term Slavomacedonian was introduced and was accepted by the community itself, which at the time had a much more widespread non-Greek Macedonian ethnic consciousness...
,
Vlachs (Aromanians) live in the south of the country, whereas Serbs
Serbs
The Serbs are a South Slavic ethnic group of the Balkans and southern Central Europe. Serbs are located mainly in Serbia, Montenegro and Bosnia and Herzegovina, and form a sizable minority in Croatia, the Republic of Macedonia and Slovenia. Likewise, Serbs are an officially recognized minority in...
/Montenegrins live in the north.
As conducting a satisfactory census of ethnic minorities is one of the country's commitments to the European Union
European Union
The European Union is an economic and political union of 27 independent member states which are located primarily in Europe. The EU traces its origins from the European Coal and Steel Community and the European Economic Community , formed by six countries in 1958...
, the Albanian government intends to conduct an official census to clarify the ethnic composition of the population in 2012. The last census to include data on ethnic minorities was conducted in 1989 under the communist regime. The latest census conducted in 2001 did not collect information about ethnic groups and nationalities in the population.
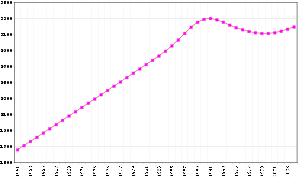
Vital statistics
| Average population (x 1000) | Live births | Deaths | Natural change | Crude birth rate (per 1000) | Crude death rate (per 1000) | Natural change (per 1000) | |
|---|---|---|---|---|---|---|---|
| 1934 | 1 010 | 33 884 | 14 440 | 19 444 | 34.7 | 16.7 | 18.0 |
| 1935 | 1 012 | 32 640 | 13 373 | 19 267 | 33.1 | 17.0 | 16.1 |
| 1936 | 1 014 | 34 199 | 16 788 | 17 411 | 33.7 | 16.6 | 17.1 |
| 1937 | 1 030 | 34 829 | 20 036 | 14 793 | 33.8 | 19.5 | 14.3 |
| 1938 | 1 048 | 36 138 | 18 512 | 17 626 | 34.3 | 17.7 | 16.6 |
| 1939 | 1 070 | 29 597 | 16 013 | 13 584 | 27.9 | 15.0 | 12.9 |
| 1940 | 1 088 | 33 651 | 17 812 | 15 839 | 31.3 | 16.4 | 14.9 |
| 1941 | 1 100 | 30 627 | 18 234 | 12 393 | 28.0 | 16.6 | 11.4 |
| 1942 | 1 117 | 36 683 | 15 899 | 20 784 | 32.8 | 14.2 | 18.6 |
| 1948 | 1 164 | 42 141 | 18 883 | 23 258 | 36.2 | 16.2 | 20.0 |
| 1949 | 1 183 | 46 196 | 14 970 | 31 226 | 39.0 | 12.7 | 26.4 |
| 1950 | 1 215 | 47 291 | 17 215 | 30 076 | 38.9 | 14.2 | 24.8 |
| 1951 | 1 242 | 47 813 | 18 862 | 28 951 | 38.5 | 15.2 | 23.3 |
| 1952 | 1 270 | 44 727 | 19 826 | 24 901 | 35.2 | 15.6 | 19.6 |
| 1953 | 1 302 | 53 273 | 17 822 | 35 451 | 40.9 | 13.7 | 27.2 |
| 1954 | 1 340 | 54 635 | 17 560 | 37 075 | 40.8 | 13.1 | 27.7 |
| 1955 | 1 379 | 61 300 | 20 750 | 40 550 | 44.5 | 15.0 | 29.4 |
| 1956 | 1 421 | 59 565 | 16 370 | 43 195 | 41.9 | 11.5 | 30.4 |
| 1957 | 1 462 | 57 241 | 17 241 | 40 000 | 39.2 | 11.8 | 27.4 |
| 1958 | 1 507 | 63 007 | 14 059 | 48 948 | 41.8 | 9.3 | 32.5 |
| 1959 | 1 556 | 65 213 | 15 305 | 49 908 | 41.9 | 9.8 | 32.1 |
| 1960 | 1 607 | 69 686 | 16 775 | 52 911 | 43.4 | 10.4 | 32.9 |
| 1961 | 1 660 | 68 452 | 15 445 | 53 007 | 41.2 | 9.3 | 31.9 |
| 1962 | 1 711 | 67 209 | 18 363 | 48 846 | 39.3 | 10.7 | 28.5 |
| 1963 | 1 763 | 68 967 | 17 646 | 51 321 | 39.1 | 10.0 | 29.1 |
| 1964 | 1 814 | 68 599 | 15 811 | 52 788 | 37.8 | 8.7 | 29.1 |
| 1965 | 1 864 | 65 692 | 16 731 | 48 961 | 35.2 | 9.0 | 26.3 |
| 1966 | 1 914 | 65 127 | 16 469 | 48 658 | 34.0 | 8.6 | 25.4 |
| 1967 | 1 965 | 69 261 | 16 565 | 52 696 | 35.2 | 8.4 | 26.8 |
| 1968 | 2 019 | 71 869 | 16 214 | 55 655 | 35.6 | 8.0 | 27.6 |
| 1969 | 2 080 | 73 458 | 15 624 | 57 834 | 35.3 | 7.5 | 27.8 |
| 1970 | 2 136 | 69 507 | 19 774 | 49 733 | 32.5 | 9.3 | 23.3 |
| 1971 | 2 188 | 72 784 | 17 768 | 55 016 | 33.3 | 8.1 | 25.1 |
| 1972 | 2 239 | 73 607 | 17 616 | 55 991 | 33.3 | 7.9 | 25.4 |
| 1973 | 2 292 | 69 754 | 18 032 | 51 722 | 30.4 | 7.9 | 22.5 |
| 1974 | 2 346 | 71 862 | 17 726 | 54 136 | 30.2 | 7.6 | 22.6 |
| 1975 | 2 401 | 70 688 | 17 399 | 53 289 | 29.6 | 7.3 | 22.3 |
| 1976 | 2 454 | 70 510 | 17 029 | 53 481 | 29.0 | 6.9 | 22.1 |
| 1977 | 2 508 | 73 439 | 16 638 | 56 801 | 28.4 | 6.6 | 21.8 |
| 1978 | 2 563 | 70 594 | 16 219 | 54 375 | 27.5 | 6.3 | 21.2 |
| 1979 | 2 617 | 72 055 | 17 421 | 54 634 | 27.5 | 6.7 | 20.9 |
| 1980 | 2 671 | 70 680 | 16 981 | 53 699 | 26.5 | 6.4 | 20.1 |
| 1981 | 2 724 | 72 180 | 18 001 | 54 179 | 26.5 | 6.6 | 19.9 |
| 1982 | 2 780 | 77 232 | 16 521 | 60 711 | 27.8 | 5.9 | 21.8 |
| 1983 | 2 838 | 73 762 | 17 416 | 56 346 | 26.0 | 6.1 | 19.9 |
| 1984 | 2 897 | 79 177 | 16 618 | 62 559 | 27.3 | 5.7 | 21.6 |
| 1985 | 2 957 | 77 535 | 17 179 | 60 356 | 26.2 | 5.8 | 20.4 |
| 1986 | 3 016 | 76 435 | 17 369 | 59 066 | 25.3 | 5.8 | 19.6 |
| 1987 | 3 076 | 79 696 | 17 119 | 62 577 | 25.9 | 5.6 | 20.3 |
| 1988 | 3 138 | 80 241 | 17 027 | 63 214 | 25.6 | 5.4 | 20.1 |
| 1989 | 3 199 | 78 862 | 18 168 | 60 694 | 24.7 | 5.7 | 19.0 |
| 1990 | 3 245 | 82 125 | 18 193 | 63 932 | 25.2 | 5.6 | 19.6 |
| 1991 | 3 225 | 77 361 | 17 743 | 59 618 | 24.0 | 5.5 | 18.5 |
| 1992 | 3 179 | 75 425 | 18 026 | 57 399 | 23.7 | 5.7 | 18.1 |
| 1993 | 3 208 | 67 730 | 17 920 | 49 810 | 21.1 | 5.6 | 15.5 |
| 1994 | 3 035 | 72 179 | 18 342 | 53 837 | 23.8 | 6.0 | 17.7 |
| 1995 | 3 030 | 72 081 | 18 060 | 54 021 | 23.8 | 6.0 | 17.8 |
| 1996 | 3 076 | 68 354 | 17 600 | 50 754 | 22.2 | 5.7 | 16.5 |
| 1997 | 3 075 | 61 739 | 18 237 | 43 502 | 20.1 | 5.9 | 14.1 |
| 1998 | 3 055 | 60 139 | 18 250 | 41 889 | 19.7 | 6.0 | 13.7 |
| 1999 | 3 054 | 57 948 | 16 720 | 41 228 | 19.0 | 5.5 | 13.5 |
| 2000 | 3 061 | 50 077 | 16 421 | 33 656 | 16.4 | 5.4 | 11.0 |
| 2001 | 3 074 | 54 283 | 15 813 | 38 470 | 17.7 | 5.1 | 12.5 |
| 2002 | 3 094 | 45 515 | 16 248 | 29 267 | 14.7 | 5.3 | 9.5 |
| 2003 | 3 112 | 47 012 | 17 967 | 29 045 | 15.1 | 5.8 | 9.3 |
| 2004 | 3 128 | 43 022 | 17 749 | 25 273 | 13.8 | 5.7 | 8.1 |
| 2005 | 3 142 | 39 612 | 17 427 | 22 185 | 12.6 | 5.5 | 7.1 |
| 2006 | 3 151 | 34 229 | 16 935 | 17 294 | 10.9 | 5.4 | 5.5 |
| 2007 | 3 161 | 33 163 | 14 528 | 18 635 | 10.5 | 4.6 | 5.9 |
| 2008 | 3 182 | 36 251 | 16 143 | 20 108 | 11.4 | 5.1 | 6.3 |
| 2009 | 3 194 | 29 189 | 15 662 | 13 527 | 9.1 | 4.9 | 4.2 |
| 2010 |
CIA World Factbook demographic statistics
The following demographic statistics are from the CIA World Factbook, unless otherwise indicated.Age structure
- 0-14 years: 23.1% (male 440,528/female 400,816)
- 15-64 years: 67.1% (male 1,251,001/female 1,190,841)
- 65 years and older: 9.8% (male 165,557/female 190,710) (2009 est.)
Sex ratio
- At birth: 1.1 male(s)/female
- Under 15 years: 1.5 male(s)/female
- 15-64 years: 1.05 male(s)/female
- 65 years and older: 0.87 male(s)/female
- Total population: 1.04 male(s)/female (2009 est.)
Infant mortality rate
- Total: 18.6 deaths/1,000 live births
- Male: 19.05 deaths/1,000 live births
- Female: 18.15 deaths/1,000 live births (2009 est.)
Life expectancy at birth
- Total population: 77.96 years
- Male: 75.28 years
- Female: 80.89 years (2009 est.)
Language
- AlbanianAlbanian languageAlbanian is an Indo-European language spoken by approximately 7.6 million people, primarily in Albania and Kosovo but also in other areas of the Balkans in which there is an Albanian population, including western Macedonia, southern Montenegro, southern Serbia and northwestern Greece...
(official – generally based on ToskTosk AlbanianTosk is the southern dialect of the Albanian language. The line of demarcation between Tosk and Gheg is the Shkumbin River. Tosk is the basis of the standard Albanian language.- Tosks :...
dialect and enriched with Gheg lexicon), GreekGreek languageGreek is an independent branch of the Indo-European family of languages. Native to the southern Balkans, it has the longest documented history of any Indo-European language, spanning 34 centuries of written records. Its writing system has been the Greek alphabet for the majority of its history;...
, AromanianAromanian languageAromanian , also known as Macedo-Romanian, Arumanian or Vlach is an Eastern Romance language spoken in Southeastern Europe...
, MacedonianMacedonian languageMacedonian is a South Slavic language spoken as a first language by approximately 2–3 million people principally in the region of Macedonia but also in the Macedonian diaspora...
, and RomaniRomani languageRomani or Romany, Gypsy or Gipsy is any of several languages of the Romani people. They are Indic, sometimes classified in the "Central" or "Northwestern" zone, and sometimes treated as a branch of their own....
.
Literacy
- Definition: age 9 and older can read and write
- Total population: 98.7%
- Male: 99.2%
- Female: 98.3% (2001 census)
Resident population
- 3,069,275
- Urban population: 42% of total population
- Number of households: 726,895
Education
Percent of population aged 6 and older (2,737,614)- Uncompleted primary: 14.8%
- Primary: 18.6%
- Junior secondary: 38.4%
- Senior secondary: 21.7%
- Higher education: 2.9%
- Illiterate: 3.6%