

Color-color diagram
Encyclopedia
In astronomy
, color–color diagrams are a means of comparing the apparent magnitude
s of star
s at different wavelength
s. Astronomer
s typically observe at narrow bands around certain wavelengths, and objects observed will have different brightnesses
in each band. The difference the brightness in two bands is referred to as color
. On color–color diagrams, the color defined by two wavelength bands is plotted on the horizontal axis, and then the color defined by another brightness difference (though usually there is one band involved in determining both colors) will be plotted on the vertical axis.
of light emitted by stars conforms closely to a blackbody radiation curve, also referred to sometimes as a thermal radiation
curve. The overall shape of a black body curve is uniquely determined by its temperature
, and the wavelength of peak intensity is inversely proportional to temperature, a relation known as Wien's Displacement Law
. Thus, observation of a stellar spectrum allows determination of its effective temperature
. Obtaining complete spectra for stars through spectrometry is much more involved than simple photometry
in a few bands. Thus by comparing the magnitude of the star in multiple different color indices
, the effective temperature
of the star can still be determined, as magnitude differences between each color will be unique for that temperature. As such, color-color diagrams can be used as a means of representing the stellar population, much like a Hertzsprung–Russell diagram
, and stars of different spectral classes
will inhabit different parts of the diagram. This feature leads to applications within various wavelength bands.
s) are independent of the distance to the stars. Stellar locus regression (SLR) was a method developed to eliminate the need for standard star observations in photometric calibrations, except highly infrequently (once a year or less) to measure color terms. SLR has been used in a number of research initiatives. The NEWFIRM survey of the NOAO Deep Wide-Field Survey region used it to arrive at more accurate colors than would have otherwise been attainable by traditional calibration methods, and South Pole Telescope
used SLR in the measurement of redshifts of galaxy clusters. The blue-tip method is closely related to SLR, but was used mainly to correct Galactic extinction
predictions from IRAS
data. Other surveys have used the stellar color-color diagram primarily as a calibration diagnostic tool, including The Oxford-Dartmouth Thirty Degree Survey and Sloan Digital Sky Survey
(SDSS).
or 2 Micron All Sky Survey (2MASS), can be challenging due to the huge number of data produced. For surveys such as these, color-color diagrams have been used to find outliers from the main sequence
stellar population. Once these outliers are identified, they can then be studied in more detail. This method has been used to identify ultracool subdwarfs. Unresolved binary star
s, which appear photometrically
to be points, have been identified by studying color-color outliers in cases where one member is off the main sequence. The stages of the evolution of stars along the asymptotic giant branch
from carbon star
to planetary nebula
appear on distinct regions of color–color diagrams. Quasar
s also appear as color-color outliers.
 Color–color diagrams are often used in infrared
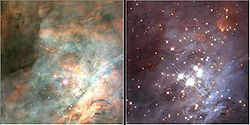
astronomy to study star forming
regions. Stars form in clouds
of dust
. As the star continues to contract, a circumstellar disk of dust is formed, and this dust is heated by the star inside. The dust itself then begins to radiate as a blackbody, though one much cooler than the star. As a result, an excess of infrared radiation
is observed for the star. Even without circumstellar dust, regions undergoing star formation exhibit high infrared luminosities
compared to stars on the main sequence. Each of these effects is distinct from the reddening of starlight which occurs as a result of scattering
off of dust in the interstellar medium
.
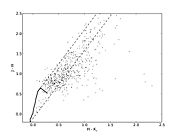 Color–color diagrams allow for these effects to be isolated. As the color–color relationships of main sequence
stars are well known, a theoretical main sequence can be plotted for reference, as is done with the solid black line in the example to the right. Interstellar dust scattering is also well understood, allowing bands to be drawn on a color–color diagram defining the region in which stars reddened by interstellar dust are expected to be observed, indicated on the color–color diagram by dashed lines. The typical axes for infrared color–color diagrams have (H–K) on the horizontal axis and (J–H) on the vertical axis (see infrared astronomy
for information on band color designations). On a diagram with these axes, stars which fall to the right of the main sequence and the reddening bands drawn are significantly brighter in the K band than main sequence stars, including main sequence stars which have experienced reddening due to interstellar dust. Of the J, H, and K bands, K is the longest wavelength, so objects which are anomalously bright in the K band are said to exhibit infrared excess
. These objects are likely protostellar in nature, with the excess radiation at long wavelengths caused by suppression by the reflection nebula
in which the protostars are embedded. Color–color diagrams can be used then as a means of studying stellar formation, as the state of a star in its formation can be roughly determined by looking at its position on the diagram.
Astronomy
Astronomy is a natural science that deals with the study of celestial objects and phenomena that originate outside the atmosphere of Earth...
, color–color diagrams are a means of comparing the apparent magnitude
Apparent magnitude
The apparent magnitude of a celestial body is a measure of its brightness as seen by an observer on Earth, adjusted to the value it would have in the absence of the atmosphere...
s of star
Star
A star is a massive, luminous sphere of plasma held together by gravity. At the end of its lifetime, a star can also contain a proportion of degenerate matter. The nearest star to Earth is the Sun, which is the source of most of the energy on Earth...
s at different wavelength
Wavelength
In physics, the wavelength of a sinusoidal wave is the spatial period of the wave—the distance over which the wave's shape repeats.It is usually determined by considering the distance between consecutive corresponding points of the same phase, such as crests, troughs, or zero crossings, and is a...
s. Astronomer
Astronomer
An astronomer is a scientist who studies celestial bodies such as planets, stars and galaxies.Historically, astronomy was more concerned with the classification and description of phenomena in the sky, while astrophysics attempted to explain these phenomena and the differences between them using...
s typically observe at narrow bands around certain wavelengths, and objects observed will have different brightnesses
Luminosity
Luminosity is a measurement of brightness.-In photometry and color imaging:In photometry, luminosity is sometimes incorrectly used to refer to luminance, which is the density of luminous intensity in a given direction. The SI unit for luminance is candela per square metre.The luminosity function...
in each band. The difference the brightness in two bands is referred to as color
Color index
In astronomy, the color index is a simple numerical expression that determines the color of an object, which in the case of a star gives its temperature...
. On color–color diagrams, the color defined by two wavelength bands is plotted on the horizontal axis, and then the color defined by another brightness difference (though usually there is one band involved in determining both colors) will be plotted on the vertical axis.
Background
While stars are not perfect blackbodies, to first order the spectraSpectrum
A spectrum is a condition that is not limited to a specific set of values but can vary infinitely within a continuum. The word saw its first scientific use within the field of optics to describe the rainbow of colors in visible light when separated using a prism; it has since been applied by...
of light emitted by stars conforms closely to a blackbody radiation curve, also referred to sometimes as a thermal radiation
Thermal radiation
Thermal radiation is electromagnetic radiation generated by the thermal motion of charged particles in matter. All matter with a temperature greater than absolute zero emits thermal radiation....
curve. The overall shape of a black body curve is uniquely determined by its temperature
Temperature
Temperature is a physical property of matter that quantitatively expresses the common notions of hot and cold. Objects of low temperature are cold, while various degrees of higher temperatures are referred to as warm or hot...
, and the wavelength of peak intensity is inversely proportional to temperature, a relation known as Wien's Displacement Law
Wien's displacement law
Wien's displacement law states that the wavelength distribution of thermal radiation from a black body at any temperature has essentially the same shape as the distribution at any other temperature, except that each wavelength is displaced on the graph...
. Thus, observation of a stellar spectrum allows determination of its effective temperature
Effective temperature
The effective temperature of a body such as a star or planet is the temperature of a black body that would emit the same total amount of electromagnetic radiation...
. Obtaining complete spectra for stars through spectrometry is much more involved than simple photometry
Photometry (astronomy)
Photometry is a technique of astronomy concerned with measuring the flux, or intensity of an astronomical object's electromagnetic radiation...
in a few bands. Thus by comparing the magnitude of the star in multiple different color indices
Color index
In astronomy, the color index is a simple numerical expression that determines the color of an object, which in the case of a star gives its temperature...
, the effective temperature
Effective temperature
The effective temperature of a body such as a star or planet is the temperature of a black body that would emit the same total amount of electromagnetic radiation...
of the star can still be determined, as magnitude differences between each color will be unique for that temperature. As such, color-color diagrams can be used as a means of representing the stellar population, much like a Hertzsprung–Russell diagram
Hertzsprung–Russell diagram
The Hertzsprung–Russell diagram is a scatter graph of stars showing the relationship between the stars' absolute magnitudes or luminosities versus their spectral types or classifications and effective temperatures. Hertzsprung–Russell diagrams are not pictures or maps of the locations of the stars...
, and stars of different spectral classes
Stellar classification
In astronomy, stellar classification is a classification of stars based on their spectral characteristics. The spectral class of a star is a designated class of a star describing the ionization of its chromosphere, what atomic excitations are most prominent in the light, giving an objective measure...
will inhabit different parts of the diagram. This feature leads to applications within various wavelength bands.
Photometric calibration
The color-color diagram of stars can be used to directly calibrate or to test colors and magnitudes in optical and infrared imaging data. Such methods take advantage of the fundamental distribution of stellar colors in our galaxy across the vast majority of the sky, and the fact that observed stellar colors (unlike apparent magnitudeApparent magnitude
The apparent magnitude of a celestial body is a measure of its brightness as seen by an observer on Earth, adjusted to the value it would have in the absence of the atmosphere...
s) are independent of the distance to the stars. Stellar locus regression (SLR) was a method developed to eliminate the need for standard star observations in photometric calibrations, except highly infrequently (once a year or less) to measure color terms. SLR has been used in a number of research initiatives. The NEWFIRM survey of the NOAO Deep Wide-Field Survey region used it to arrive at more accurate colors than would have otherwise been attainable by traditional calibration methods, and South Pole Telescope
South Pole Telescope
The South Pole Telescope is a 10 metre diameter telescope located at the Amundsen-Scott South Pole Station, Antarctica. It is a microwave/millimetre-wave telescope that observes in a frequency range between 70 and 300 GHz...
used SLR in the measurement of redshifts of galaxy clusters. The blue-tip method is closely related to SLR, but was used mainly to correct Galactic extinction
Extinction (astronomy)
Extinction is a term used in astronomy to describe the absorption and scattering of electromagnetic radiation by matter between an emitting astronomical object and the observer. Interstellar extinction—also called Galactic extinction, when it occurs in the Milky Way—was first...
predictions from IRAS
IRAS
The Infrared Astronomical Satellite was the first-ever space-based observatory to perform a survey of the entire sky at infrared wavelengths....
data. Other surveys have used the stellar color-color diagram primarily as a calibration diagnostic tool, including The Oxford-Dartmouth Thirty Degree Survey and Sloan Digital Sky Survey
Sloan Digital Sky Survey
The Sloan Digital Sky Survey or SDSS is a major multi-filter imaging and spectroscopic redshift survey using a dedicated 2.5-m wide-angle optical telescope at Apache Point Observatory in New Mexico, United States. The project was named after the Alfred P...
(SDSS).
Color outliers
Analyzing data from large observational surveys, such as the SDSSSloan Digital Sky Survey
The Sloan Digital Sky Survey or SDSS is a major multi-filter imaging and spectroscopic redshift survey using a dedicated 2.5-m wide-angle optical telescope at Apache Point Observatory in New Mexico, United States. The project was named after the Alfred P...
or 2 Micron All Sky Survey (2MASS), can be challenging due to the huge number of data produced. For surveys such as these, color-color diagrams have been used to find outliers from the main sequence
Main sequence
The main sequence is a continuous and distinctive band of stars that appears on plots of stellar color versus brightness. These color-magnitude plots are known as Hertzsprung–Russell diagrams after their co-developers, Ejnar Hertzsprung and Henry Norris Russell...
stellar population. Once these outliers are identified, they can then be studied in more detail. This method has been used to identify ultracool subdwarfs. Unresolved binary star
Binary star
A binary star is a star system consisting of two stars orbiting around their common center of mass. The brighter star is called the primary and the other is its companion star, comes, or secondary...
s, which appear photometrically
Photometry (astronomy)
Photometry is a technique of astronomy concerned with measuring the flux, or intensity of an astronomical object's electromagnetic radiation...
to be points, have been identified by studying color-color outliers in cases where one member is off the main sequence. The stages of the evolution of stars along the asymptotic giant branch
Asymptotic Giant Branch
The asymptotic giant branch is the region of the Hertzsprung-Russell diagram populated by evolving low to medium-mass stars. This is a period of stellar evolution undertaken by all low to intermediate mass stars late in their lives....
from carbon star
Carbon star
A carbon star is a late-type star similar to a red giant whose atmosphere contains more carbon than oxygen; the two elements combine in the upper layers of the star, forming carbon monoxide, which consumes all the oxygen in the atmosphere, leaving carbon atoms free to form other carbon compounds,...
to planetary nebula
Planetary nebula
A planetary nebula is an emission nebula consisting of an expanding glowing shell of ionized gas ejected during the asymptotic giant branch phase of certain types of stars late in their life...
appear on distinct regions of color–color diagrams. Quasar
Quasar
A quasi-stellar radio source is a very energetic and distant active galactic nucleus. Quasars are extremely luminous and were first identified as being high redshift sources of electromagnetic energy, including radio waves and visible light, that were point-like, similar to stars, rather than...
s also appear as color-color outliers.
Star formation
Infrared
Infrared light is electromagnetic radiation with a wavelength longer than that of visible light, measured from the nominal edge of visible red light at 0.74 micrometres , and extending conventionally to 300 µm...
astronomy to study star forming
Star formation
Star formation is the process by which dense parts of molecular clouds collapse into a ball of plasma to form a star. As a branch of astronomy star formation includes the study of the interstellar medium and giant molecular clouds as precursors to the star formation process and the study of young...
regions. Stars form in clouds
Interstellar cloud
Interstellar cloud is the generic name given to an accumulation of gas, plasma and dust in our and other galaxies. Put differently, an interstellar cloud is a denser-than-average region of the interstellar medium. Depending on the density, size and temperature of a given cloud, the hydrogen in it...
of dust
Cosmic dust
Cosmic dust is a type of dust composed of particles in space which are a few molecules to 0.1 µm in size. Cosmic dust can be further distinguished by its astronomical location; for example: intergalactic dust, interstellar dust, interplanetary dust and circumplanetary dust .In our own Solar...
. As the star continues to contract, a circumstellar disk of dust is formed, and this dust is heated by the star inside. The dust itself then begins to radiate as a blackbody, though one much cooler than the star. As a result, an excess of infrared radiation
Infrared excess
An infrared excess is a measurement of an astronomical source, typically a star, that has a greater measured infrared flux than expected by assuming the star is a blackbody radiator. Infrared excesses are often the result of circumstellar dust and are common in young stellar objects and evolved...
is observed for the star. Even without circumstellar dust, regions undergoing star formation exhibit high infrared luminosities
Luminosity
Luminosity is a measurement of brightness.-In photometry and color imaging:In photometry, luminosity is sometimes incorrectly used to refer to luminance, which is the density of luminous intensity in a given direction. The SI unit for luminance is candela per square metre.The luminosity function...
compared to stars on the main sequence. Each of these effects is distinct from the reddening of starlight which occurs as a result of scattering
Scattering
Scattering is a general physical process where some forms of radiation, such as light, sound, or moving particles, are forced to deviate from a straight trajectory by one or more localized non-uniformities in the medium through which they pass. In conventional use, this also includes deviation of...
off of dust in the interstellar medium
Interstellar medium
In astronomy, the interstellar medium is the matter that exists in the space between the star systems in a galaxy. This matter includes gas in ionic, atomic, and molecular form, dust, and cosmic rays. It fills interstellar space and blends smoothly into the surrounding intergalactic space...
.
Main sequence
The main sequence is a continuous and distinctive band of stars that appears on plots of stellar color versus brightness. These color-magnitude plots are known as Hertzsprung–Russell diagrams after their co-developers, Ejnar Hertzsprung and Henry Norris Russell...
stars are well known, a theoretical main sequence can be plotted for reference, as is done with the solid black line in the example to the right. Interstellar dust scattering is also well understood, allowing bands to be drawn on a color–color diagram defining the region in which stars reddened by interstellar dust are expected to be observed, indicated on the color–color diagram by dashed lines. The typical axes for infrared color–color diagrams have (H–K) on the horizontal axis and (J–H) on the vertical axis (see infrared astronomy
Infrared astronomy
Infrared astronomy is the branch of astronomy and astrophysics that studies astronomical objects visible in infrared radiation. The wavelength of infrared light ranges from 0.75 to 300 micrometers...
for information on band color designations). On a diagram with these axes, stars which fall to the right of the main sequence and the reddening bands drawn are significantly brighter in the K band than main sequence stars, including main sequence stars which have experienced reddening due to interstellar dust. Of the J, H, and K bands, K is the longest wavelength, so objects which are anomalously bright in the K band are said to exhibit infrared excess
Infrared excess
An infrared excess is a measurement of an astronomical source, typically a star, that has a greater measured infrared flux than expected by assuming the star is a blackbody radiator. Infrared excesses are often the result of circumstellar dust and are common in young stellar objects and evolved...
. These objects are likely protostellar in nature, with the excess radiation at long wavelengths caused by suppression by the reflection nebula
Reflection nebula
In Astronomy, reflection nebulae are clouds of dust which are simply reflecting the light of a nearby star or stars. The energy from the nearby star, or stars, is insufficient to ionize the gas of the nebula to create an emission nebula, but is enough to give sufficient scattering to make the dust...
in which the protostars are embedded. Color–color diagrams can be used then as a means of studying stellar formation, as the state of a star in its formation can be roughly determined by looking at its position on the diagram.
See also
- Hertzsprung–Russell diagramHertzsprung–Russell diagramThe Hertzsprung–Russell diagram is a scatter graph of stars showing the relationship between the stars' absolute magnitudes or luminosities versus their spectral types or classifications and effective temperatures. Hertzsprung–Russell diagrams are not pictures or maps of the locations of the stars...
- Stellar evolutionStellar evolutionStellar evolution is the process by which a star undergoes a sequence of radical changes during its lifetime. Depending on the mass of the star, this lifetime ranges from only a few million years to trillions of years .Stellar evolution is not studied by observing the life of a single...
- NebulaNebulaA nebula is an interstellar cloud of dust, hydrogen gas, helium gas and other ionized gases...
- Color indexColor indexIn astronomy, the color index is a simple numerical expression that determines the color of an object, which in the case of a star gives its temperature...