

Circular statistics
Encyclopedia
Directional statistics is the subdiscipline of statistics
that deals with directions (unit vectors in Rn), axes
(lines through the origin in Rn) or rotation
s in Rn. More generally, directional statistics deals with observations on compact Riemannian manifold
s.
 The fact that 0 degrees
and 360 degrees are identical angles, so that for example 180 degrees is not a sensible mean
of 2 degrees and 358 degrees, provides one illustration that special statistical methods are required for the analysis of some types of data (in this case, angular data). Other examples of data that may be regarded as directional include statistics involving temporal periods (e.g. time of day, week, month, year, etc.), compass directions, dihedral angle
s in molecules, orientations, rotations and so on.
 on the line can be "wrapped"
around the circumference of a circle of unit radius. That is, the pdf of the wrapped variable
Statistics
Statistics is the study of the collection, organization, analysis, and interpretation of data. It deals with all aspects of this, including the planning of data collection in terms of the design of surveys and experiments....
that deals with directions (unit vectors in Rn), axes
Cartesian coordinate system
A Cartesian coordinate system specifies each point uniquely in a plane by a pair of numerical coordinates, which are the signed distances from the point to two fixed perpendicular directed lines, measured in the same unit of length...
(lines through the origin in Rn) or rotation
Rotation
A rotation is a circular movement of an object around a center of rotation. A three-dimensional object rotates always around an imaginary line called a rotation axis. If the axis is within the body, and passes through its center of mass the body is said to rotate upon itself, or spin. A rotation...
s in Rn. More generally, directional statistics deals with observations on compact Riemannian manifold
Riemannian manifold
In Riemannian geometry and the differential geometry of surfaces, a Riemannian manifold or Riemannian space is a real differentiable manifold M in which each tangent space is equipped with an inner product g, a Riemannian metric, which varies smoothly from point to point...
s.
Degree (angle)
A degree , usually denoted by ° , is a measurement of plane angle, representing 1⁄360 of a full rotation; one degree is equivalent to π/180 radians...
and 360 degrees are identical angles, so that for example 180 degrees is not a sensible mean
Average
In mathematics, an average, or central tendency of a data set is a measure of the "middle" value of the data set. Average is one form of central tendency. Not all central tendencies should be considered definitions of average....
of 2 degrees and 358 degrees, provides one illustration that special statistical methods are required for the analysis of some types of data (in this case, angular data). Other examples of data that may be regarded as directional include statistics involving temporal periods (e.g. time of day, week, month, year, etc.), compass directions, dihedral angle
Dihedral angle
In geometry, a dihedral or torsion angle is the angle between two planes.The dihedral angle of two planes can be seen by looking at the planes "edge on", i.e., along their line of intersection...
s in molecules, orientations, rotations and so on.
Circular and higher dimensional distributions
Any probability density functionProbability density function
In probability theory, a probability density function , or density of a continuous random variable is a function that describes the relative likelihood for this random variable to occur at a given point. The probability for the random variable to fall within a particular region is given by the...
on the line can be "wrapped"Wrapped distribution
In probability theory and directional statistics, a wrapped probability distribution is a continuous probability distribution that describes data points that lie on a unit n-sphere...
around the circumference of a circle of unit radius. That is, the pdf of the wrapped variable
-

is-

This concept can be extended to the multivariate context by an extension of the simple sum to a number of sums that cover all dimensions in the feature space:
-

where is the
  th Euclidean basis vector.
Examples of circular distributions
- The von Mises distribution is a circular distribution which, like any other circular distribution, may be thought of as a wrapping of a certain linear probability distribution around the circle. The underlying linear probability distribution for the von Mises distribution is mathematically intractable, however, for statistical purposes, there is no need to deal with the underlying linear distribution. The usefulness of the von Mises distribution is twofold: it is the most mathematically tractable of all circular distributions, allowing simpler statistical analysis, and it is a close approximation to the wrapped normal distribution, which, analogously the linear normal distribution, is important because it is the limiting case for the sum of a large number of small angular deviations. In fact, the von Mises distribution is often known as the "circular normal" distribution because of its ease of use and its close relationship to the wrapped normal distribution (Fisher, 1993).
- The pdf of the von Mises distribution is:
- where
 is the modified Bessel functionBessel functionIn mathematics, Bessel functions, first defined by the mathematician Daniel Bernoulli and generalized by Friedrich Bessel, are canonical solutions y of Bessel's differential equation:...
of order 0.
- The pdf of the circular uniform distributionCircular uniform distributionIn probability theory and directional statistics, a circular uniform distribution is a probability distribution on the unit circle whose density is uniform for all angles.- Description :The pdf of the circular uniform distribution is:...
is given by
- The pdf of the wrapped normal distributionWrapped normal distributionIn probability theory and directional statistics, a wrapped normal distribution is a wrapped probability distribution which results from the "wrapping" of the normal distribution around the unit circle. It finds application in the theory of Brownian motion and is a solution to the heat equation for...
(WN) is:
-

- where μ and σ are the mean and standard deviation of the unwrapped distribution, respectively and
 is the Jacobi theta function:
-
 where
where  and
and 
- The pdf of the wrapped Cauchy distribution (WC) is:
-

- where
 is the scale factor and
  is the peak position.
- The pdf of the Wrapped Lévy distributionWrapped Lévy distributionIn probability theory and directional statistics, a wrapped Lévy distribution is a wrapped probability distribution that results from the "wrapping" of the Lévy distribution around the unit circle.- Description :The pdf of the wrapped Lévy distribution is...
(WL) is:
-

- where the value of the summand is taken to be zero when
 ,
,  is the scale factor and
  is the location parameter.
Distributions on higher dimensional manifolds
There also exist distributions on the two-dimensional sphere (such as the Kent distribution), the N-dimensional sphere (the Von Mises-Fisher distribution) or the torus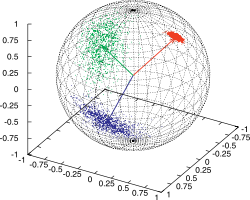 TorusIn geometry, a torus is a surface of revolution generated by revolving a circle in three dimensional space about an axis coplanar with the circle...
(the bivariate von Mises distributionBivariate von Mises distributionIn probability theory and statistics, the bivariate von Mises distribution is a probability distribution describing values on a torus. It may be thought of as an analogue on the torus of the bivariate normal distribution. The distribution belongs to the field of directional statistics. The general...
).
The matrix-von Mises–Fisher distribution is a distribution on the Stiefel manifoldStiefel manifoldIn mathematics, the Stiefel manifold Vk is the set of all orthonormal k-frames in Rn. That is, it is the set of ordered k-tuples of orthonormal vectors in Rn. It is named after Swiss mathematician Eduard Stiefel...
, and can be used to construct probability distributions over rotation matrices.
The Bingham distributionBingham distributionIn statistics, the Bingham distribution, named after Christopher Bingham, is an antipodally symmetric probability distribution on the n-sphere...
is a distribution over axes in N dimensions, or equivalently, over points on the (N − 1)-dimensional sphere with the antipodes identified. For example, if N = 2, the axes are undirected lines through the origin in the plane. In this case, each axis cuts the unit circle in the plane (which is the one-dimensional sphere) at two points that are each other's antipodes. For N = 4, the Bingham distribution is a distribution over the space of unit quaternions. Since a unit quaternion corresponds to a rotation matrix, the Bingham distribution for N = 4 can be used to construct probability distributions over the space of rotations, just like the Matrix-von Mises–Fisher distribution.
These distributions are for example used in geologyGeologyGeology is the science comprising the study of solid Earth, the rocks of which it is composed, and the processes by which it evolves. Geology gives insight into the history of the Earth, as it provides the primary evidence for plate tectonics, the evolutionary history of life, and past climates...
, crystallographyCrystallographyCrystallography is the experimental science of the arrangement of atoms in solids. The word "crystallography" derives from the Greek words crystallon = cold drop / frozen drop, with its meaning extending to all solids with some degree of transparency, and grapho = write.Before the development of...
and bioinformaticsBioinformaticsBioinformatics is the application of computer science and information technology to the field of biology and medicine. Bioinformatics deals with algorithms, databases and information systems, web technologies, artificial intelligence and soft computing, information and computation theory, software...
.
The fundamental difference between linear and circular statistics
A simple way to calculate the mean of a series of anglesMean of circular quantitiesIn mathematics, a mean of circular quantities is a mean which is suited for quantities like angles, daytimes, and fractional parts of real numbers. This is necessary since most of the usual means fail on circular quantities...
(in the interval[0°, 360°) ) is to calculate the mean of the cosines and sines of each angle, and obtain the angle by calculating the inverse tangent. Consider the following three angles as an example: 10, 20, and 30 degrees. Intuitively, calculating the mean would involve adding these three angles together and dividing by 3, in this case indeed resulting in a correct mean angle of 20 degrees. By rotating this system anticlockwise through 15 degrees the three angles become 355 degrees, 5 degrees and 15 degrees. The naive mean is now 125 degrees, which is the wrong answer, as it should be 5 degrees. The vector mean can be calculated in the following way, using the mean sine
  and the mean cosine
  :
:
-

-

-
This may be more succinctly stated by realizing that directional data are in fact vectors of unit length. In the case of one-dimensional data, these data points can be represented conveniently as complex numbers of unit magnitude , where
  is the measured angle. The mean resultant vector for the sample is then:
The sample mean angle is then the argument of the mean resultant:

The length of the sample mean resultant vector is:

and will have a value between 0 and 1. Thus the sample mean resultant vector can be represented as:

Moments
The raw vector (or trigonometric) moments of a circular distribution are defined as

where is any interval of length
  and
and  is the PDF of the circular distribution. Since the integral
  is unity, and the integration interval is finite, it follows that the moments of any circular distribution are always finite and well defined.
Sample moments are analogously defined:

The population resultant vector, length, and mean angle are defined in analogy with the corresponding sample parameters.


In addition, the lengths of the higher moments are defined as:

while the angular parts of the higher moments are just . The lengths of the higher moments will all lie between 0 and 1.
Measures of location and spread
Various measures of location and spread may be defined for both the population and a sample drawn from that population. The most common measure of location is the circular mean. The population circular mean is simply the first moment of the distribution while the sample mean is the first moment of the sample. The sample mean will serve as an unbiased estimator of the population mean.
When data is concentrated, the median and mode may be defined by analogy to the linear case, but for more dispersed or multi-modal data, these concepts are not useful.
The most common measures of circular spread are:
- The circular variance. For the sample the circular variance is defined as:
-

- and for the population
-

- Both will have values between 0 and 1.
- The circular standard deviation
-

-

- with values between 0 and infinity. This definition of the standard deviation (rather than the square root of the variance) is useful because for a wrapped normal distribution, it is an estimator of the standard deviation of the underlying normal distribution. It will therefore allow the circular distribution to be standardized as in the linear case, for small values of the standard deviation. This also applies to the von Mises distribution which closely approximates the wrapped normal distribution.
- The circular dispersion
-

-

- with values between 0 and infinity. This measure of spread is found useful in the statistical analysis of variance.
Distribution of the mean
Given a set of N measurements the mean value of z is defined as:

which may be expressed as

where

or, alternatively as:

where

The distribution of the mean ( ) for a circular pdf P(θ) will be given by:

where is over any interval of length
  and the integral is subject to the constraint that
  and
and  are constant, or, alternatively, that
  and
and  are constant.
The calculation of the distribution of the mean for most circular distributions is not analytically possible, and in order to carry out an analysis of variance, numerical or mathematical approximations are needed.
The central limit theoremCentral limit theoremIn probability theory, the central limit theorem states conditions under which the mean of a sufficiently large number of independent random variables, each with finite mean and variance, will be approximately normally distributed. The central limit theorem has a number of variants. In its common...
may be applied to the distribution of the sample means. (main article: Central limit theorem for directional statisticsCentral limit theorem for directional statisticsIn probability theory, the central limit theorem states conditions under which the mean of a sufficiently large number of independent random variables, each with finite mean and variance, will be approximately normally distributed....
). It can be shown that the distribution of approaches a bivariate normal distribution in the limit of large sample size.
Software
- RR (programming language)R is a programming language and software environment for statistical computing and graphics. The R language is widely used among statisticians for developing statistical software, and R is widely used for statistical software development and data analysis....
has some packages devoted to circular statistics, including CircStats. (CircStats package for R) - Circular Statistics, a MATLABMATLABMATLAB is a numerical computing environment and fourth-generation programming language. Developed by MathWorks, MATLAB allows matrix manipulations, plotting of functions and data, implementation of algorithms, creation of user interfaces, and interfacing with programs written in other languages,...
toolbox containing the essentials to work with circular data (Documentation). - Mocapy: a dynamic Bayesian networkBayesian networkA Bayesian network, Bayes network, belief network or directed acyclic graphical model is a probabilistic graphical model that represents a set of random variables and their conditional dependencies via a directed acyclic graph . For example, a Bayesian network could represent the probabilistic...
software package implemented in PythonPython (programming language)Python is a general-purpose, high-level programming language whose design philosophy emphasizes code readability. Python claims to "[combine] remarkable power with very clear syntax", and its standard library is large and comprehensive...
and C++C++C++ is a statically typed, free-form, multi-paradigm, compiled, general-purpose programming language. It is regarded as an intermediate-level language, as it comprises a combination of both high-level and low-level language features. It was developed by Bjarne Stroustrup starting in 1979 at Bell...
. Uses stochastic expectation maximization for parameter learning, and supports directional statistics. - Oriana, Windows software for directional statistics.
Books on directional statistics
- Batschelet, E. Circular statistics in biology, Academic Press, London, 1981. ISBN 0-12-081050-6.
- Fisher, NI., Statistical Analysis of Circular Data, Cambridge University Press, 1993. ISBN 0-521-35018-2
- Fisher, NI., Lewis, T., Embleton, BJJ. Statistical Analysis of Spherical Data, Cambridge University Press, 1993. ISBN 0-521-45699-1
- Mardia, KV. and Jupp P., Directional Statistics (2nd edition), John Wiley and Sons Ltd., 2000. ISBN 0-471-95333-4
External links
- Directional Statistics, Concepts and Techniques in Modern Geography 25
- CircStat: A MATLAB Toolbox for Circular Statistics, Journal of Statistical Software, Vol. 31, Issue 10, Sep 2009
-
-
-
-
- where the value of the summand is taken to be zero when
- where
- where μ and σ are the mean and standard deviation of the unwrapped distribution, respectively and
-
-

