
List of information graphics software
Encyclopedia
This is a list of software to create any kind of information graphics
:
software can be used for manual graphing or for editing the output of another program. Please see:
:Category:Vector graphics editors
Diagramming software
Information graphics
Information graphics or infographics are graphic visual representations of information, data or knowledge. These graphics present complex information quickly and clearly, such as in signs, maps, journalism, technical writing, and education...
:
- either includes the ability to create one or more infographics from a provided data set
- either it is provided specifically for information visualizationInformation visualizationInformation visualization is the interdisciplinary study of "the visual representation of large-scale collections of non-numerical information, such as files and lines of code in software systems, library and bibliographic databases, networks of relations on the internet, and so forth".- Overview...
| Software | Example(s) | Interface | | Licence(s) | Operating system | Distinguishing features | |||
|---|---|---|---|---|---|---|---|---|
| License | Open Source (yes/no) | Price | ||||||
| Algebrator Algebrator Algebrator is a computer algebra system , which was developed in the late 1990s by Neven Jurkovic of Softmath, San Antonio, Texas. This is a CAS specifically geared towards algebra education... |
GUI | Proprietary | $58.99 | Windows, Mac OS X, Linux, Sugar | 2D graphs | |||
| Baudline Baudline The baudline time-frequency browser is a signal analysis tool designed for scientific visualization. It runs on several Unix operating systems under the X Window System... |
GUI | Proprietary | , source available | Free | Linux, FreeBSD, , Solaris | Signal analysis tool | ||
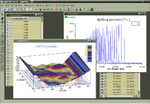
| DADiSP DADiSP DADiSP is a computer program developed by DSP Development Corporation which allows one to display and manipulate data series, matrices and images in an environment similar to a spreadsheet.... |
GUI, command line, SPL script language | Proprietary | Windows, UNIX | Numerical analysis and signal processing with a spreadsheet Spreadsheet A spreadsheet is a computer application that simulates a paper accounting worksheet. It displays multiple cells usually in a two-dimensional matrix or grid consisting of rows and columns. Each cell contains alphanumeric text, numeric values or formulas... -like interface |
||||
| DAP DAP (software) Dap is a statistics and graphics program, that performs data management, analysis, and graphical visualization tasks which are commonly required in statistical consulting practice.... |
Statistics | |||||||
| DataScene DataScene DataScene is a scientific graphing, animation, data analysis, and real-time data monitoring software package. It was developed with the Common Language Infrastructure technology and the GDI+ graphics library... |
GUI | Shareware Shareware The term shareware is a proprietary software that is provided to users without payment on a trial basis and is often limited by any combination of functionality, availability, or convenience. Shareware is often offered as a download from an Internet website or as a compact disc included with a... |
Free express, $169 – $299 std. and pro. | Windows, Linux, Unix/X11 | 2D & 3D graphing, animated graphs, data analysis, curve fitting, and data monitoring. | |||
| Descartes (plotting tool) Descartes (plotting tool) descartes is a platform independent image, data, and function plotter, with underlying Python scripting in the background. Its source code is released under the GNU GPL licence.-External links:*... |
GUI | GPL | Any (Python) | Inactive as of 2005 | ||||
| EditGrid EditGrid EditGrid is a Web 2.0 spreadsheet service. It offers both a free-of-charge service to personal users and a subscription service to organisations and is available on a number of partner sites and channels.... |
GUI (Web based) | Free, or with subscription service | Any (Web-based application) | Online spreadsheet | ||||
| EJS | GUI | GPL | Linux, Windows, | Creates ODE solving interactive, ready-to-publish Java applets | ||||
| Epi Info Epi Info Epi Info is public domain statistical software for epidemiology developed by Centers for Disease Control and Prevention in Atlanta, Georgia .... |
GPL | Windows | Statistics | |||||
| EpsTk EpsTk EpsTk stands for "Encapsulated PostSript Toolkit". The codebase consists of pure M-files , which may be used to create most standard 2D scientific graphics... |
Toolkit for use with MATLAB MATLAB MATLAB is a numerical computing environment and fourth-generation programming language. Developed by MathWorks, MATLAB allows matrix manipulations, plotting of functions and data, implementation of algorithms, creation of user interfaces, and interfacing with programs written in other languages,... and GNU Octave GNU Octave GNU Octave is a high-level language, primarily intended for numerical computations. It provides a convenient command-line interface for solving linear and nonlinear problems numerically, and for performing other numerical experiments using a language that is mostly compatible with MATLAB... |
GPL | Any (Octave or MATLAB) | |||||
| EViews EViews EViews is a statistical package for Windows, used mainly for time-series oriented econometric analysis. It is developed by Quantitative Micro Software , now a part of IHS. Version 1.0 was released in March 1994, and replaced MicroTSP... |
Proprietary | Statistics | ||||||
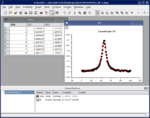
| Fityk Fityk Fityk is a curve fitting and data analysis application, predominantly used to fit analytical,bell-shaped functions to experimental data.It is positioned to fill the gap between general plotting softwareand programs specific for one field, eg... |
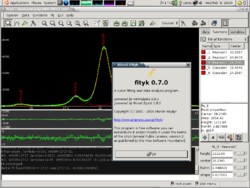 |
GUI, Command line | GPL | Windows, Linux, Mac | specialized in curve fitting | |||
| FlexPro FlexPro FlexPro is software package for analysis and presentation of scientific and technical data, produced by Weisang GmbH. It runs on Microsoft Windows and is available in English, German and Japanese languages... |
Proprietary | MS Windows only | ||||||
| FreeMat FreeMat FreeMat is a free open source numerical computing environment and programming language, similar to MATLAB and GNU Octave. In addition to supporting many MATLAB functions and some IDL functionality, it features a codeless interface to external C, C++, and Fortran code, further parallel distributed... |
Linux, , Windows | |||||||
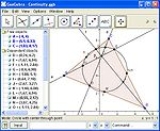
| GeoGebra GeoGebra GeoGebra is an interactive geometry software for education in schools. Most parts of GeoGebra are free software. GeoGebra is written in Java and thus available for multiple platforms.... |
 |
GUI | GPL | Windows, Linux, , Sugar | Very good for rendering Geometry, Graphs, Statistical Diagrams, (LaTeX) Formula Rendering. All antialiased in PNG Export. Export to SVG, EPS, EMF, PNG, PDF. | |||
| Gnumeric Gnumeric Gnumeric is a spreadsheet program that is part of the GNOME Free Software Desktop Project. Gnumeric version 1.0 was released December 31, 2001. Gnumeric is distributed as free software under the GNU GPL license; it is intended to replace proprietary and other spreadsheet programs such as Microsoft... |
GUI | GNU GPL | Free | Cross-platform Cross-platform In computing, cross-platform, or multi-platform, is an attribute conferred to computer software or computing methods and concepts that are implemented and inter-operate on multiple computer platforms... |
Spreadsheet | |||
| GNU Octave GNU Octave GNU Octave is a high-level language, primarily intended for numerical computations. It provides a convenient command-line interface for solving linear and nonlinear problems numerically, and for performing other numerical experiments using a language that is mostly compatible with MATLAB... |
 |
GUI, command line, C, , Fortran | GPL | Linux, Windows, FreeBSD, Solaris, , OS/2 or eComStation | MATLAB compatible, built-in ODE and DAE solvers, extensive user contributed toolboxes | |||
| Gnuplot Gnuplot - License :Despite gnuplot's name, it is not part of or related to the GNU system and it is not distributed under the GNU General Public License .However, some GNU packages do use gnuplot.... |
 |
Command line, Python, Ruby, Smalltalk | own licence | Windows, Mac, Linux, VMS, Ultrix, OS/2, MS-DOS, Amiga, OS-9/68k, Atari ST, BeOS | Built in scripting language | |||
| GLE Graphics Layout Engine Graphics Layout Engine is a graphics scripting language designed for creating publication quality graphs, plots, diagrams, figures and slides. GLE supports various graph types such as function plots, histograms, bar graphs, scatter plots, contour lines, color maps and surface plots through a... |
Command line, GUI | BSD / GPL | Windows, Mac, Linux | Graphics scripting language | ||||
| GraphPad Prism GraphPad Prism GraphPad Prism is a commercial scientific 2D graphing and statistics software published by GraphPad Software, Inc., a privately-held California corporation... |
GUI | proprietary | academic US$450, student US$300 | Windows, Mac | ||||
| Grace Grace (plotting tool) Grace is a free WYSIWYG 2D graph plotting tool, for Unix-like operating systems. The package name stands for "GRaphing, Advanced Computation and Exploration of data." Grace uses the X Window System and Motif for its GUI. It has been ported to VMS, OS/2, and Windows 9*/NT/2000/XP... |
 |
Command line, GUI, various APIs | GPL | Windows (cygwin), Mac(X11), Linux | Uses Motif; fork of Xmgr | |||
| Graph Graph (software) Graph is an open source program that can generate two dimensional plots of mathematical functions and data sets.-Features:Graph supports entering functions on regular cartesian as well as parametric and polar form. Functions can be traced and at a given coordinate the function value and the two... |
GUI | GPL | Windows | |||||
| Graphviz Graphviz Graphviz is a package of open-source tools initiated by AT&T Labs Research for drawing graphs specified in DOT language scripts. It also provides libraries for software applications to use the tools... |
DOT language DOT language DOT is a plain text graph description language. It is a simple way of describing graphs that both humans and computer programs can use. DOT graphs are typically files that end with the .gv extension. The .gv extension is preferred, as .dot also is used by Microsoft Office 2003.Various programs... |
CPL Common Public License In computing, the CPL is a free software / open-source software license published by IBM. The Free Software Foundation and Open Source Initiative have approved the license terms of the CPL.... |
Linux, Windows, | |||||
| gretl Gretl gretl is an open-source statistical package, mainly for econometrics. The name is an acronym for Gnu Regression, Econometrics and Time-series Library. It has a graphical user interface and can be used together with X-12-ARIMA, TRAMO/SEATS, R, Octave, and Ox. It is written in C, uses GTK as widget... |
GUI Gui Gui or guee is a generic term to refer to grilled dishes in Korean cuisine. These most commonly have meat or fish as their primary ingredient, but may in some cases also comprise grilled vegetables or other vegetarian ingredients. The term derives from the verb, "gupda" in Korean, which literally... |
GPL | Linux, Mac, Windows | Specialized in econometrics and time series analyses, built-in scripting language, interface to gnuplot and R | ||||
| IDPS IDPS Software IDPS is a graphics server software, to be run by an application program and dedicated to technical and scientific data display. An API is provided for application programs written in Fortran, C, or Python.... |
GUI, Fortran, C, Python, Socket Server | GPL | Linux, Mac OS X, Solaris, OSF1/True64, Windows | Uses Qt 3/Qt 4, runs as a server | ||||
| IGOR Pro IGOR Pro IGOR Pro is a scientific data analysis software, numerical computing environment and programming language that runs on Windows or Mac operating systems. It is developed by WaveMetrics Inc., and was originally aimed at time series analysis, but has since then evolved and covers other applications... |
GUI | proprietary | standard US$550 academic US$395 student $US85 |
Windows, Mac | 3D and volume visualization, Curve and peak fitting, Signal processing, Image processing | |||
| JFreeChart JFreeChart JFreeChart is an open-source framework for the programming language Java, which allows the creation of a wide variety of both interactive and non-interactive charts.JFreeChart supports a number of various charts, including combined charts:... |
 |
GUI, Java Java (programming language) Java is a programming language originally developed by James Gosling at Sun Microsystems and released in 1995 as a core component of Sun Microsystems' Java platform. The language derives much of its syntax from C and C++ but has a simpler object model and fewer low-level facilities... , Groovy |
LGPL | Any (Java) | ||||
| jHepWork JHepWork jHepWork is an interactive framework for scientific computation, data analysis and data visualization designed for scientists, engineers and students... |
GUI, Java Java (programming language) Java is a programming language originally developed by James Gosling at Sun Microsystems and released in 1995 as a core component of Sun Microsystems' Java platform. The language derives much of its syntax from C and C++ but has a simpler object model and fewer low-level facilities... , Jython Jython Jython, successor of JPython, is an implementation of the Python programming language written in Java.-Overview:Jython programs can seamlessly import and use any Java class. Except for some standard modules, Jython programs use Java classes instead of Python modules... scripting |
LGPL | Any (Java) | Multi-platform, IDE with code assist, Jython/Python scripting | ||||
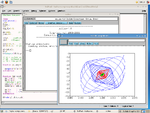
| KChart |  |
GUI | GPL | Linux (KDE) | ||||
| Kig Kig (software) Kig is free and open source interactive geometry software, which is part of theKDE edutainment project. It has some facilities for scripting in Python, as well as the creating macros from existing constructions.- Import and export :... |
GUI | GPL | Geometry diagrams only | |||||
| kst | 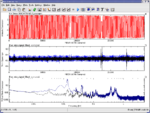 |
GUI | GPL | Linux (KDE), Windows (beta) | ||||
| LabPlot LabPlot LabPlot is a platform-independent open-source cross-platform computer program for interactive scientific graphing and data analysis, written for the KDE desktop. It is similar to Origin and is able to import Origin's data files.-History and Perspective:... |
 |
GUI, Qt scripting | GPL | Linux (KDE) | ||||
| LabVIEW LabVIEW LabVIEW is a system design platform and development environment for a visual programming language from National Instruments. LabVIEW provides engineers and scientists with the tools needed to create and deploy measurement and control systems.The graphical language is named "G"... |
Proprietary | |||||||
| Maple Maple (software) Maple is a general-purpose commercial computer algebra system. It was first developed in 1980 by the Symbolic Computation Group at the University of Waterloo in Waterloo, Ontario, Canada.... |
 |
GUI, Command line | $1895 | , Linux, Windows | ||||
| MathCad MathCad Mathcad is computer software primarily intended for the verification, validation, documentation and re-use of engineering calculations. First introduced in 1986 on DOS, it was the first to introduce live editing of typeset mathematical notation, combined with its automatic computations... |
GUI | $1195 | Windows | Simple GUI driven interface | ||||
| Mathematica Mathematica Mathematica is a computational software program used in scientific, engineering, and mathematical fields and other areas of technical computing... |
 |
GUI, Command line, | $2495 | Windows, , Linux, HPUX, Solaris | Computer algebra, statistics and numerical analysis system with general graphic language | |||
| MATLAB MATLAB MATLAB is a numerical computing environment and fourth-generation programming language. Developed by MathWorks, MATLAB allows matrix manipulations, plotting of functions and data, implementation of algorithms, creation of user interfaces, and interfacing with programs written in other languages,... |
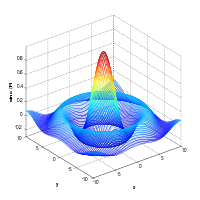 |
GUI | Proprietary | Linux, , Windows | Matrix system | |||
| Maxima | GUI, Command line | GPL | Linux, Windows, , BSD and Unix Like OS | Various graphical user interfaces, Support LaTex with GNU TeXmacs GNU TeXmacs GNU TeXmacs is a free scientific word processor and typesetting component of the GNU Project. It was inspired by TeX and GNU Emacs, though it shares no code with those programs. TeXmacs does use TeX fonts. It is written and maintained by Joris van der Hoeven. The program produces structured... and Web frontend with Sage |
||||
| Mavis | GUI | Proprietary | Free for personal use | Windows | Interactive, animated graphs, charts and diagrams | |||
| MedCalc MedCalc MedCalc is a statistical software package designed for the biomedical sciences. It has an integrated spreadsheet for data input and can import files in several formats... |
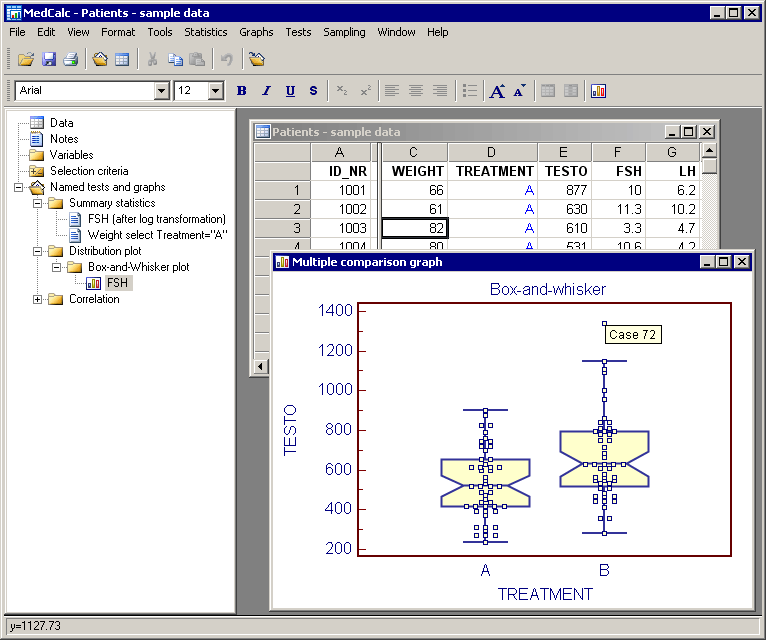 |
GUI | Proprietary | $395 | Windows | Statistics | ||
| Microsoft Excel Microsoft Excel Microsoft Excel is a proprietary commercial spreadsheet application written and distributed by Microsoft for Microsoft Windows and Mac OS X. It features calculation, graphing tools, pivot tables, and a macro programming language called Visual Basic for Applications... |
GUI | Proprietary Proprietary software Proprietary software is computer software licensed under exclusive legal right of the copyright holder. The licensee is given the right to use the software under certain conditions, while restricted from other uses, such as modification, further distribution, or reverse engineering.Complementary... |
Windows Microsoft Windows Microsoft Windows is a series of operating systems produced by Microsoft.Microsoft introduced an operating environment named Windows on November 20, 1985 as an add-on to MS-DOS in response to the growing interest in graphical user interfaces . Microsoft Windows came to dominate the world's personal... and |
Spreadsheet | ||||
| MLPlot | Java API | GPL | Linux, , Windows | SVG | ||||
| Monarch Charts | Charting library | Commercial | Any, Java | Charting library component based on java, SPC charts | ||||
| Nucalc NuCalc NuCalc, also known as Graphing Calculator, is a computer software tool made by the company Pacific Tech. The tool can perform many graphing calculator functions. It can graph inequalities and vector fields, as well as functions in two, three, or four dimensions. It supports several different... |
GUI | proprietary | US$100 | Windows, Mac OS, | ||||
| Numbers (iWork) Numbers (software) Numbers is a spreadsheet application developed by Apple Inc. as part of the iWork productivity suite alongside Keynote and Pages. Numbers 1.0 was announced on August 7, 2007 and thus it is the newest application in the iWork Suite. Numbers runs on Mac OS X v10.4 "Tiger" or newer... |
GUI | Proprietary Proprietary software Proprietary software is computer software licensed under exclusive legal right of the copyright holder. The licensee is given the right to use the software under certain conditions, while restricted from other uses, such as modification, further distribution, or reverse engineering.Complementary... |
Spreadsheet | |||||
| OpenOffice.org Calc OpenOffice.org Calc OpenOffice.org Calc is the spreadsheet component of the OpenOffice.org software package.Calc is similar to Microsoft Excel, with a roughly equivalent range of features. Calc is capable of opening and saving most spreadsheets in Microsoft Excel file format... |
GUI | GNU LGPL GNU Lesser General Public License The GNU Lesser General Public License or LGPL is a free software license published by the Free Software Foundation . It was designed as a compromise between the strong-copyleft GNU General Public License or GPL and permissive licenses such as the BSD licenses and the MIT License... |
Free | Cross-platform Cross-platform In computing, cross-platform, or multi-platform, is an attribute conferred to computer software or computing methods and concepts that are implemented and inter-operate on multiple computer platforms... |
Spreadsheet | |||
| OpenPlaG OpenPlaG openPlaG is a PHP based function graph plotter for the use on websites. It was first released in April 2006. In June 2007 its source code was published under the GNU GPL license. PlaG is an abbreviation for Plot a Graph.... |
 |
GUI | GPL | Any (PHP 5) | graph plotter | |||
| Origin Origin (software) Origin is a proprietary computer program for interactive scientific graphing and data analysis. It is produced by OriginLab Corporation, and runs on Microsoft Windows... |
 |
GUI, COM, C/ and scripting | proprietary | US$ 950(std) 1500 (pro) 50(student) |
Windows | |||
| Paraview ParaView ParaView is an open source, freely available program for parallel, interactive, scientific visualization. It has a client–server architecture to facilitate remote visualization of datasets, and generates level of detail models to maintain interactive framerates for large datasets. It is an... |
GUI, Python scripting | GPL | Windows, Linux/Unix, | Parallel scientific and Computational Fluid Dynamics Computational fluid dynamics Computational fluid dynamics, usually abbreviated as CFD, is a branch of fluid mechanics that uses numerical methods and algorithms to solve and analyze problems that involve fluid flows. Computers are used to perform the calculations required to simulate the interaction of liquids and gases with... visualizations |
||||
| PDL Perl Data Language PDL is a set of array programming extensions to the Perl programming language.PDL is an extension to Perl v5, intended for scientific and other data intensive programming tasks... |
 |
Free | Perl Data Language | |||||
| PGPLOT PGPLOT PGPLOT is a device-independent graphics subroutine library written starting in 1983 by Tim Pearson, a professor at Caltech. PGPLOT is written mostly in FORTRAN with a modular output API that allows output to several dozen types of plotting device... |
FORTRAN, C | Windows, Mac, Linux (Fortran) California Institute of Technology | Inactive as of 2001 | |||||
| Physics Plot Physics Plot Physics Plot is a software package designed for plotting scientific data. The software was developed by Dr. Charles D. Spencer and his students. The software is marketed by Physics Academic Software... |
GUI | proprietary | US$100 | Windows (visualbasic) | ||||
| ploticus Ploticus Ploticus is a free, open source program for producing plots and charts from data. It runs under Unix, Solaris, Mac OS X, Linux, and Win32 systems. Community support is customarily done through Yahoo News Groups... |
 |
Command line, C | GPL | Windows, Mac, Linux | plots and charts from data | |||
| PLplot PLplot PLplot is a library of functions that are often used to make scientific plots in compiled languages such as C, C++, D, Fortran, Ada, OCaml and Java. PLplot can also be used interactively by interpreted languages such as Octave, Python, Perl and Tcl. The current version was written primarily by... |
Ada, C//D, Fortran 77/90, C, , Java, Lisp, Lua, OCaml, Octave, Perl, Python, Tcl/Tk | LGPL | Windows, Mac, Linux | Many different output formats: CGM, GIF, Jpeg, Png, Latex, PBM, PDF, Postscript, SVG, XFig, Qt, wxWidgets | ||||
| PSPP PSPP PSPP is a free software application for analysis of sampled data. It has a graphical user interface and conventional command line interface. It is written in C, uses GNU Scientific Library for its mathematical routines, and plotutils for generating graphs.... |
GUI Gui Gui or guee is a generic term to refer to grilled dishes in Korean cuisine. These most commonly have meat or fish as their primary ingredient, but may in some cases also comprise grilled vegetables or other vegetarian ingredients. The term derives from the verb, "gupda" in Korean, which literally... , command line |
GPL | Linux, Mac, Windows | Statistical analysis of sampled data. Free replacement for SPSS SPSS SPSS is a computer program used for survey authoring and deployment , data mining , text analytics, statistical analysis, and collaboration and deployment .... . |
||||
| QtiPlot QtiPlot QtiPlot is a platform-independent open-source cross-platform computer program for interactive scientific graphing and data analysis. It is similar to the proprietary programs Origin or SigmaPlot, and is being used to substitute these in universities .... |
GUI, Python | GPL | Windows, Mac, Linux | Python scriptable | ||||
| R R (programming language) R is a programming language and software environment for statistical computing and graphics. The R language is widely used among statisticians for developing statistical software, and R is widely used for statistical software development and data analysis.... |
GPL | Linux, Mac, Windows | Interoperabile with other free software packages. | |||||
| RLPlot | GUI | GPL | Linux, Mac, Windows | |||||
| ROOT ROOT ROOT is an object-oriented program and library developed by CERN. It was originally designed for particle physics data analysis and contains several features specific to this field, but it is also used in other applications such as astronomy and data mining.... |
 |
GUI, , Python, Ruby | LGPL | Windows, Mac, Linux | De facto standard in high energy physics | |||
| RRDtool RRDtool RRDtool aims to handle time-series data like network bandwidth, temperatures, CPU load, etc... |
 |
Command line | GPL | Windows, Linux | ||||
| S-PLUS S-PLUS S-PLUS is a commercial implementation of the S programming language sold by TIBCO Software Inc..It features object-oriented programming capabilities and advanced analytical algorithms.-Historical timeline:... |
Proprietary | Statistics | ||||||
| S-Lang | Statistics | |||||||
| S-Lang | ||||||||
| SAS System SAS System SAS is an integrated system of software products provided by SAS Institute Inc. that enables programmers to perform:* retrieval, management, and mining* report writing and graphics* statistical analysis... |
Proprietary | Statistics | ||||||
| Scilab Scilab Scilab is an open source, cross-platform numerical computational package and a high-level, numerically oriented programming language. Itcan be used for signal processing, statistical analysis, image enhancement, fluid dynamics simulations, numerical optimization, and modeling and simulation of... |
 |
CeCILL | Windows, Linux, | Matrix system | ||||
| SciPy SciPy SciPy is an open source library of algorithms and mathematical tools for the Python programming language.SciPy contains modules for optimization, linear algebra, integration, interpolation, special functions, FFT, signal and image processing, ODE solvers and other tasks common in science and... , NumPy, matplotlib Matplotlib matplotlib is a plotting library for the Python programming language and its NumPy numerical mathematics extension. It provides an object-oriented API which allows plots to be embedded into applications using generic GUI toolkits, like wxPython, Qt, or GTK... modules for Python Python (programming language) Python is a general-purpose, high-level programming language whose design philosophy emphasizes code readability. Python claims to "[combine] remarkable power with very clear syntax", and its standard library is large and comprehensive... |
Python, GUI, command line | BSD/matplotlib | Linux, FreeBSD, , Windows | Extensive numerical and scientific library with MATLAB-style plotting | ||||
| SOCR SOCR The Statistics Online Computational Resource is a suite of online tools and interactive aids for hands-on learning and teaching concepts in statistical analysis and probability theory developed at the University of California, Los Angeles... |
Statistics | |||||||
| SPSS SPSS SPSS is a computer program used for survey authoring and deployment , data mining , text analytics, statistical analysis, and collaboration and deployment .... |
GUI, Command Line | Proprietary | Statistics | |||||
| Stata Stata Stata is a general-purpose statistical software package created in 1985 by StataCorp. It is used by many businesses and academic institutions around the world... |
Proprietary | Statistics | ||||||
| Statgraphics Statgraphics Statgraphics is a statistics package that performs and explains basic and advanced statistical functions. The software was created in 1980 by Dr. Neil Polhemus... |
GUI | Proprietary | $695 | Windows | Statistical software package for exploratory data analysis, statistical modeling, design of experiments, time series forecasting, quality improvement and Six Sigma. | |||
| StatPlanet | GUI | Proprietary | Free, Commercial version: $430 - $640 | Windows (web and desktop), Mac and Linux (web only) | Interactive graphs and maps, online and desktop versions | |||
| Statistical Lab Statistical Lab The computer program Statistical Lab is an explorative and interactive toolbox for statistical analysis and visualization of data. It supports educational applications of statistics in business sciences, economics, social sciences and humanities. The program is developed and constantly advanced by... |
||||||||
| Systat SYSTAT SYSTAT is a statistics and statistical graphics software package, developed by Leland Wilkinson in the late 1970s, who was at the time an assistant professor of psychology at the University of Illinois at Chicago... |
Proprietary | Statistics | ||||||
| SymPy SymPy SymPy is a Python library for symbolic computation. The stated goals of the library are to become a full-featured computer algebra system and to keep a simple code base to promote extensibility and comprehensibility. SymPy is written in Python.... |
 |
BSD | Linux, , WIndows | Python library for computer algebra and symbolic mathematics | ||||
| Sysquake Sysquake Sysquake is a numerical computing environment based on a programming language mostly compatible with MATLAB. It offers facilities for interactive graphics which give insights into the problems being analyzed... |
GUI, command line | Proprietary | $250 (LE free) | Linux, Windows, | MATLAB compatible, interactive graphics | |||
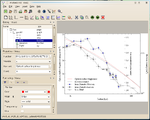
| SciDAVis SciDAVis SciDAVis is a platform-independent open-source cross-platform computer program for interactive scientific graphing and data analysis... |
 |
GUI, Python | GPL | Windows, Mac, Linux | Qt4-based GUI, Python scriptable | |||
| SigmaPlot SigmaPlot SigmaPlot is a proprietary software package for scientific graphing and data analysis. It runs on Microsoft Windows.The software can read multiple formats , and can also perform mathematical transforms and statistical analyses.-History:SigmaPlot was developed by Jandel Corporation for Windows 3.1x... |
GUI | proprietary | Commercial US$799, Government US$699, Commercial US$549 | Windows | ||||
| Tableau Tableau Software Tableau Software is an American computer software company headquartered in Seattle, WA, USA. It produces a family of interactive data visualization products focused on business intelligence, and is reportedly anticipating revenue of $30 million to $40 million in 2010.- History :The company traces... |
GUI | Proprietary | $999 – $1800 | Windows | Spreadsheet | |||
| Tecplot Tecplot Tecplot is the name of a family of visualization software tools developed by Tecplot, Inc., which is headquartered in Bellevue, Washington.-Tecplot Chorus:... |
GUI | proprietary | Linux, Mac, UNIX, Windows | Computational Fluid Dynamics Computational fluid dynamics Computational fluid dynamics, usually abbreviated as CFD, is a branch of fluid mechanics that uses numerical methods and algorithms to solve and analyze problems that involve fluid flows. Computers are used to perform the calculations required to simulate the interaction of liquids and gases with... |
||||
| Teechart Teechart TeeChart is a Charting Library for programmers developed and managed by Steema Software of Girona, Catalonia.It is available as commercial and non-commercial software... |
Charting library | Commercial | Windows, Linux | Charting, Gauge and Map components for .NET, VCL, ActiveX, Java, PHP. | ||||
| think-cell chart Think-cell think-cell is a German computer software company founded in 2002 and headquartered in Berlin, Germany. The Fraunhofer Society spin-off focuses upon the creation of Microsoft PowerPoint and Excel add-in products... |
GUI | proprietary | Annual subscription | Windows | Support for waterfall Waterfall chart Waterfall Chart is a form of data visualization which helps in determining the cumulative effect of sequentially introduced positive or negative values. The waterfall chart is also known as a Flying Bricks Chart or Mario Chart due to the apparent suspension of columns in mid-air... , Marimekko and Gantt chart Gantt chart A Gantt chart is a type of bar chart that illustrates a project schedule. Gantt charts illustrate the start and finish dates of the terminal elements and summary elements of a project. Terminal elements and summary elements comprise the work breakdown structure of the project. Some Gantt charts... s. Direct integration into Microsoft PowerPoint Microsoft PowerPoint Microsoft PowerPoint, usually just called PowerPoint, is a non-free commercial presentation program developed by Microsoft. It is part of the Microsoft Office suite, and runs on Microsoft Windows and Apple's Mac OS X operating system... . |
|||
| Veusz Veusz Veusz is a scientific plotting package. Veusz is a Qt application written in Python, PyQt and NumPy. It is freely available for anyone to distribute under the terms of the GPL. It is designed to produce publication-quality plots. The name should be pronounced as "views".This program produces... |
 |
GUI, Python, Command line | GPL | Unix, Windows, Mac | Create publication-quality PS/PDF plots, Python scripting and plugin interface | |||
| Visifire Visifire Visifire is a set of data visualization components powered by Microsoft Silverlight & WPF. Visifire is a multi-targeting control which can be used in both WPF & Silverlight applications. One can use the same API to create charts & gauges in Mobile, Web & Desktop environments. Visifire can also be... |
Independent of Server side Scripting | GPL | Windows, Mac | |||||
| Zoho Office Suite Zoho Office Suite The Zoho Office Suite is a Web-based online office suite containing word processing, spreadsheets, presentations, databases, note-taking, wikis, customer relationship management , project management, invoicing and other applications developed by ZOHO Corporation , a US-based company. It was... |
GUI (Web based) | Proprietary Proprietary software Proprietary software is computer software licensed under exclusive legal right of the copyright holder. The licensee is given the right to use the software under certain conditions, while restricted from other uses, such as modification, further distribution, or reverse engineering.Complementary... |
Any (Web-based application) | |||||
Vector graphics
Vector graphicsVector graphics
Vector graphics is the use of geometrical primitives such as points, lines, curves, and shapes or polygon, which are all based on mathematical expressions, to represent images in computer graphics...
software can be used for manual graphing or for editing the output of another program. Please see:
:Category:Vector graphics editors
- List of vector graphics editors
- Comparison of vector graphics editorsComparison of vector graphics editorsA number of vector graphics editors for various platforms exist. Potential users of these editors will make a decision based on factors such as the availability for the user's platform, the feature set, usability of the user interface and the focus of the program. Some programs are more suitable...
See also
Diagramming software
- Comparison of numerical analysis softwareComparison of numerical analysis softwareThe following tables provide a comparison of numerical analysis software.- General :- Operating system support :The operating systems the software can run on natively .- Language features :Colors indicate features available as...