
Graph of a function
Encyclopedia
In mathematics, the graph of a function
f is the collection of all ordered pair
s (x, f(x)). In particular, if x is a real number
, graph means the graphical representation of this collection, in the form of a curve
on a Cartesian plane
, together with Cartesian axes, etc. Graphing on a Cartesian plane is sometimes referred to as curve sketching. If the function input x is an ordered pair (x1, x2) of real numbers, the graph is the collection of all ordered triples (x1, x2, f(x1, x2)), and its graphical representation is a surface
(see three dimensional graph).
The graph of a function on real numbers is identical to the graphic representation of the function. For general functions, the graphic representation cannot be applied and the formal definition of the graph of a function suits the need of mathematical statements, e.g., the closed graph theorem
in functional analysis
.
The concept of the graph of a function is generalized to the graph of a relation
. Note that although a function is always identified with its graph, they are not the same because it will happen that two functions with different codomain
could have the same graph. For example, the cubic polynomial mentioned below is a surjection if its codomain is the real number
s but it is not if its codomain is the complex field
.
To test if a graph of a curve
is a function
, use the vertical line test
. To test if the function is one-to-one, meaning it has an inverse function
, use the horizontal line test
. If the function has an inverse, the graph of the inverse can be found by reflecting the graph of the original function over the line . A curve is a one-to-one function if and only if
it is a function and it passes the horizontal line test.
In science
, engineering
, technology
, finance
, and other areas, graphs are tools used for many purposes. In the simplest case one variable is plotted as a function of another, typically using rectangular axes; see Plot (graphics)
for details.
Function (mathematics)
In mathematics, a function associates one quantity, the argument of the function, also known as the input, with another quantity, the value of the function, also known as the output. A function assigns exactly one output to each input. The argument and the value may be real numbers, but they can...
f is the collection of all ordered pair
Ordered pair
In mathematics, an ordered pair is a pair of mathematical objects. In the ordered pair , the object a is called the first entry, and the object b the second entry of the pair...
s (x, f(x)). In particular, if x is a real number
Real number
In mathematics, a real number is a value that represents a quantity along a continuum, such as -5 , 4/3 , 8.6 , √2 and π...
, graph means the graphical representation of this collection, in the form of a curve
Curve
In mathematics, a curve is, generally speaking, an object similar to a line but which is not required to be straight...
on a Cartesian plane
Cartesian coordinate system
A Cartesian coordinate system specifies each point uniquely in a plane by a pair of numerical coordinates, which are the signed distances from the point to two fixed perpendicular directed lines, measured in the same unit of length...
, together with Cartesian axes, etc. Graphing on a Cartesian plane is sometimes referred to as curve sketching. If the function input x is an ordered pair (x1, x2) of real numbers, the graph is the collection of all ordered triples (x1, x2, f(x1, x2)), and its graphical representation is a surface
Surface
In mathematics, specifically in topology, a surface is a two-dimensional topological manifold. The most familiar examples are those that arise as the boundaries of solid objects in ordinary three-dimensional Euclidean space R3 — for example, the surface of a ball...
(see three dimensional graph).
The graph of a function on real numbers is identical to the graphic representation of the function. For general functions, the graphic representation cannot be applied and the formal definition of the graph of a function suits the need of mathematical statements, e.g., the closed graph theorem
Closed graph theorem
In mathematics, the closed graph theorem is a basic result in functional analysis which characterizes continuous linear operators between Banach spaces in terms of the operator graph.- The closed graph theorem :...
in functional analysis
Functional analysis
Functional analysis is a branch of mathematical analysis, the core of which is formed by the study of vector spaces endowed with some kind of limit-related structure and the linear operators acting upon these spaces and respecting these structures in a suitable sense...
.
The concept of the graph of a function is generalized to the graph of a relation
Relation (mathematics)
In set theory and logic, a relation is a property that assigns truth values to k-tuples of individuals. Typically, the property describes a possible connection between the components of a k-tuple...
. Note that although a function is always identified with its graph, they are not the same because it will happen that two functions with different codomain
Codomain
In mathematics, the codomain or target set of a function is the set into which all of the output of the function is constrained to fall. It is the set in the notation...
could have the same graph. For example, the cubic polynomial mentioned below is a surjection if its codomain is the real number
Real number
In mathematics, a real number is a value that represents a quantity along a continuum, such as -5 , 4/3 , 8.6 , √2 and π...
s but it is not if its codomain is the complex field
Complex number
A complex number is a number consisting of a real part and an imaginary part. Complex numbers extend the idea of the one-dimensional number line to the two-dimensional complex plane by using the number line for the real part and adding a vertical axis to plot the imaginary part...
.
To test if a graph of a curve
Curve
In mathematics, a curve is, generally speaking, an object similar to a line but which is not required to be straight...
is a function
Function (mathematics)
In mathematics, a function associates one quantity, the argument of the function, also known as the input, with another quantity, the value of the function, also known as the output. A function assigns exactly one output to each input. The argument and the value may be real numbers, but they can...
, use the vertical line test
Vertical line test
In mathematics, the vertical line test is a test to determine if a curve is a relation or graph of a function when the function's domain and Range correspond to the x and y axes of the Cartesian coordinate system...
. To test if the function is one-to-one, meaning it has an inverse function
Inverse
Inverse may refer to:* Inverse , a type of immediate inference from a conditional sentence* Inverse , a program for solving inverse and optimization problems...
, use the horizontal line test
Horizontal line test
In mathematics, the horizontal line test is a test used to determine if a function is injective and/or surjective.The lines used for the test are parallel to the x axis....
. If the function has an inverse, the graph of the inverse can be found by reflecting the graph of the original function over the line
. A curve is a one-to-one function if and only ifIf and only if
In logic and related fields such as mathematics and philosophy, if and only if is a biconditional logical connective between statements....
it is a function and it passes the horizontal line test.
In science
Science
Science is a systematic enterprise that builds and organizes knowledge in the form of testable explanations and predictions about the universe...
, engineering
Engineering
Engineering is the discipline, art, skill and profession of acquiring and applying scientific, mathematical, economic, social, and practical knowledge, in order to design and build structures, machines, devices, systems, materials and processes that safely realize improvements to the lives of...
, technology
Technology
Technology is the making, usage, and knowledge of tools, machines, techniques, crafts, systems or methods of organization in order to solve a problem or perform a specific function. It can also refer to the collection of such tools, machinery, and procedures. The word technology comes ;...
, finance
Finance
"Finance" is often defined simply as the management of money or “funds” management Modern finance, however, is a family of business activity that includes the origination, marketing, and management of cash and money surrogates through a variety of capital accounts, instruments, and markets created...
, and other areas, graphs are tools used for many purposes. In the simplest case one variable is plotted as a function of another, typically using rectangular axes; see Plot (graphics)
Plot (graphics)
A plot is a graphical technique for representing a data set, usually as a graph showing the relationship between two or more variables. The plot can be drawn by hand or by a mechanical or electronic plotter. Graphs are a visual representation of the relationship between variables, very useful for...
for details.
Examples
Functions of one variable
The graph of the function.-
is- {(x<0,0), (0
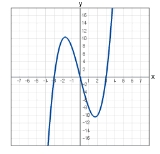
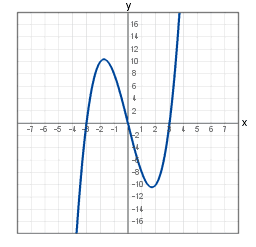
The graph of the cubic polynomial on the one variableVariable (mathematics)In mathematics, a variable is a value that may change within the scope of a given problem or set of operations. In contrast, a constant is a value that remains unchanged, though often unknown or undetermined. The concepts of constants and variables are fundamental to many areas of mathematics and...
is- {(x, x3-9x) : x is a real number}.
If this set is plotted on a Cartesian plane, the result is a curve (see figure).
Functions of two variables
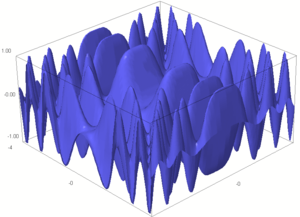
The graph of the trigonometric function on the real line- f(x, y) = sinSineIn mathematics, the sine function is a function of an angle. In a right triangle, sine gives the ratio of the length of the side opposite to an angle to the length of the hypotenuse.Sine is usually listed first amongst the trigonometric functions....
(x2)·cos(y2)
is- {(x, y, sinSineIn mathematics, the sine function is a function of an angle. In a right triangle, sine gives the ratio of the length of the side opposite to an angle to the length of the hypotenuse.Sine is usually listed first amongst the trigonometric functions....
(x2)·cos(y2)) : x is a real number}.
If this set is plotted on a three dimensional Cartesian coordinate system, the result is a surface (see figure).
External links
- Weisstein, Eric W. "Function Graph." From MathWorld--A Wolfram Web Resource.
- {(x<0,0), (0
