
Gran plot
Encyclopedia
A Gran plot is a common means of standardizing a titrate or titrant by estimating the equivalence volume or end point in a strong acid
-strong base
titration
or in a potentiometric titration
. Such plots have been also used to calibrate glass electrodes, to estimate the carbonate content of aqueous solutions, and to estimate the Ka values (acid dissociation constant
s) of weak acids and bases from titration data.
Gran plots use linear approximations of the a priori non-linear relationships between the measured quantity, pH
or electromotive potential
(emf), and the titrant volume. Other types of concentration measures, such as spectrophotometric absorbances or NMR chemical shift
s, can in principle be similarly treated. These approximations are only valid near, but not at, the end point, and so the method differs from end point estimations by way of first- and second-derivative
plots, which require data at the end point. Gran plots were originally devised for graphical determinations in pre-computer times, wherein an x-y plot on paper would be manually extrapolated to estimate the x-intercept. The graphing and visual estimation of the end point have been replaced by more accurate least-squares analyses since the advent of modern computers and enabling software packages, especially spreadsheet programs with built-in least-squares functionality.
where Kw is the water autoprotolysis
constant.
If titrating an acid of initial volume and concentration
  with base of concentration
  , then at any ith point in the titration with titrant volume
  ,
,
At the equivalence point
, the equivalence volume .
.
Thus,
The equivalence volume is used to compute whichever of or
or  is unknown.
The pH meter is usually calibrated with buffer solutions at known pH values before starting the titration. The ionic strength
can be kept constant by judicious choice of acid and base. For instance, HCl titrated with NaOH of approximately the same concentration will replace H+ with an ion (Na+) of the same charge at the same concentration, to keep the ionic strength fairly constant. Otherwise, a relatively high concentration of background electrolyte can be used, or the activity quotient
can be computed.

 Hence,
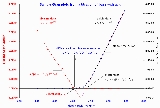
Figure 1 gives sample Gran plots of a strong base-strong acid titration.
 ,
,
we have at any ith point in the titration of a volume of acid at a concentration
  by base of concentration
  . In the linear regions away from equivalence,
 and
and
are valid approximations, whence , or
, or or, because
  ,
, .
.
A plot of versus
  will have a slope
  over the linear acidic region and an extrapolated x-intercept
  , from which either
  or
or  can be computed. The alkaline region is treated in the same manner as for a titration of strong acid. Figure 2 gives an example; in this example, the two x-intercepts differ by about 0.2 mL but this is a small discrepancy, given the large equivalence volume (0.5% error).
Similar equations can be written for the titration of a weak base by strong acid (Gran, 1952; Harris, 1998).
 of titrate is
  . In the opposite case of a titration of acid by base, the carbonate content is similarly computed from
  , where
  is the base-side equivalence volume (from Martell and Motekaitis).
When the total CO2 content is significant, as in natural waters and alkaline effluents, two or three inflections can be seen in the pH-volume curves owing to buffering by higher concentrations of bicarbonate and carbonate. As discussed by Stumm and Morgan (1981), the analysis of such waters can use up to six Gran plots from a single titration to estimate the multiple end points and measure the total alkalinity and the carbonate and/or bicarbonate contents.
 in monitoring the
  concentration in place of
  readings, one can trivially set
  and apply the same equations as above, where
  is the offset correction
  , and
, and  is a slope correction
  (1/59.2 pH units/mV at 25°C), such that
  replaces
  .
.
Thus, as before for a titration of strong acid by strong base,
Analogous plots can be drawn using data from a titration of base by acid.
 and
and  .
.
If a pH electrode is not well calibrated, an offset correction can be computed in situ from the acid-side Gran slope:
In the sample data illustrated in Figure 1, this offset correction was not insignificant, at -0.054 pH units.
The value of , however, may deviate from its theoretical value and can only be assessed by a proper calibration of the electrode. Calibration of an electrode is often performed using buffers of known pH, or by performing a titration of strong acid with strong base. In that case, a constant ionic strength can be maintained, and
  is known at all titration points if both
  and
and  are known (and should be directly related to primary standard
s). For instance, Martell and Motekaitis (1992) calculated the pH value expected at the start of the titration, having earlier titrated the acid and base solutions against primary standards, then adjusted the pH electrode reading accordingly, but this does not afford a slope correction if one is needed.
Based on earlier work by McBryde (1969), Gans and O'Sullivan (2000) describe an iterative approach to arrive at both and
and  values in the relation
  , from a titration of strong acid by strong base:
The procedure could in principle be modified for titrations of base by acid. A computer program named GLEE (for GLass Electrode Evaluation) implements this approach on titrations of acid by base for electrode calibration. This program additionally can compute (by a separate, non-linear least-squares process) a 'correction' for the base concentration. An advantage of this method of electrode calibration is that it can be performed in the same medium of constant ionic strength
which may later be used for the determination of equilibrium constants
.
Note that the regular Gran functions will provide the required equivalence volumes and, as is initially set at its theoretical value, the initial estimate for
  in step 1 can be had from the slope of the regular acid-side Gran function as detailed earlier. Note too that this procedure computes the CO2 content and can indeed be combined with a complete standardization of the base, using the definition of
  to compute
  . Finally, the usable pH range could be extended by solving the quadratic
  for
for  .
.
 Potentiometric data are also used to monitor species other than
  . When monitoring any species
  by potentiometry, one can apply the same formalism with
  . Thus, a titration of a solution of another species
  by species
  is analogous to a pH-monitored titration of base by acid, whence either
  or
or  plotted versus
  will have an x-intercept
  . In the opposite titration of
  by
by  , the equivalence volume will be
  . The significance of the slopes will depend on the interactions between the two species, whether associating in solution or precipitating together (Gran, 1952). Usually, the only result of interest is the equivalence point. However, the before-equivalence slope could in principle be used to assess the solubility product
  in the same way as
  can be determined from acid-base titrations, although other ion-pair association interactions may be occurring as well.
To illustrate, consider a titration of Cl- by Ag+ monitored potentiometrically:
Hence,
Figure 3 gives sample plots of potentiometric titration data.
Because the or
or  terms in the Gran functions only asymptotically tend toward, and never reach, the x axis, curvature approaching the equivalence point is to be expected in all cases. However, there is disagreement among practitioners as to which data to plot, whether using only data on one side of equivalence or on both sides, and whether to select data nearest equivalence or in the most linear portions: using the data nearest the equivalence point will enable the two x-intercepts to be more coincident with each other and to better coincide with estimates from derivative plots, while using acid-side data in an acid-base titration presumably minimizes interference from titratable (buffering) impurities, such as bicarbonate/carbonate in the base (see Carbonate content), and the effect of a drifting ionic strength. In the sample plots displayed in the Figures, the most linear regions (the data represented by filled circles) were selected for the least-squares computations of slopes and intercepts. Data selection is always subjective.
Acid
An acid is a substance which reacts with a base. Commonly, acids can be identified as tasting sour, reacting with metals such as calcium, and bases like sodium carbonate. Aqueous acids have a pH of less than 7, where an acid of lower pH is typically stronger, and turn blue litmus paper red...
-strong base
Base (chemistry)
For the term in genetics, see base A base in chemistry is a substance that can accept hydrogen ions or more generally, donate electron pairs. A soluble base is referred to as an alkali if it contains and releases hydroxide ions quantitatively...
titration
Titration
Titration, also known as titrimetry, is a common laboratory method of quantitative chemical analysis that is used to determine the unknown concentration of an identified analyte. Because volume measurements play a key role in titration, it is also known as volumetric analysis. A reagent, called the...
or in a potentiometric titration
Potentiometric titration
Potentiometric titration is a technique similar to direct titration of a redox reaction. No indicator is used, instead the voltage across the analyte, typically an electrolyte solution is measured. To do this, two electrodes are used, a neutral electrode and a standard reference electrode. The...
. Such plots have been also used to calibrate glass electrodes, to estimate the carbonate content of aqueous solutions, and to estimate the Ka values (acid dissociation constant
Acid dissociation constant
An acid dissociation constant, Ka, is a quantitative measure of the strength of an acid in solution. It is the equilibrium constant for a chemical reaction known as dissociation in the context of acid-base reactions...
s) of weak acids and bases from titration data.
Gran plots use linear approximations of the a priori non-linear relationships between the measured quantity, pH
PH
In chemistry, pH is a measure of the acidity or basicity of an aqueous solution. Pure water is said to be neutral, with a pH close to 7.0 at . Solutions with a pH less than 7 are said to be acidic and solutions with a pH greater than 7 are basic or alkaline...
or electromotive potential
Electromotive force
In physics, electromotive force, emf , or electromotance refers to voltage generated by a battery or by the magnetic force according to Faraday's Law, which states that a time varying magnetic field will induce an electric current.It is important to note that the electromotive "force" is not a...
(emf), and the titrant volume. Other types of concentration measures, such as spectrophotometric absorbances or NMR chemical shift
Chemical shift
In nuclear magnetic resonance spectroscopy, the chemical shift is the resonant frequency of a nucleus relative to a standard. Often the position and number of chemical shifts are diagnostic of the structure of a molecule...
s, can in principle be similarly treated. These approximations are only valid near, but not at, the end point, and so the method differs from end point estimations by way of first- and second-derivative
Derivative
In calculus, a branch of mathematics, the derivative is a measure of how a function changes as its input changes. Loosely speaking, a derivative can be thought of as how much one quantity is changing in response to changes in some other quantity; for example, the derivative of the position of a...
plots, which require data at the end point. Gran plots were originally devised for graphical determinations in pre-computer times, wherein an x-y plot on paper would be manually extrapolated to estimate the x-intercept. The graphing and visual estimation of the end point have been replaced by more accurate least-squares analyses since the advent of modern computers and enabling software packages, especially spreadsheet programs with built-in least-squares functionality.
Titrating strong acid with strong base
For a strong acid-strong base titration monitored by pH, we have at any ith point in the titrationwhere Kw is the water autoprotolysis
Self-ionization of water
The self-ionization of water is the chemical reaction in which a proton is transferred from one water molecule to another, in pure water or an aqueous solution, to create the two ions, hydronium, H3O+ and hydroxide, OH−...
constant.
If titrating an acid of initial volume
and concentration with base of concentration , then at any ith point in the titration with titrant volume ,At the equivalence point
Equivalence point
The equivalence point, or stoichiometric point, of a chemical reaction when a titrant is added and is stoichiometrically equal to the amount of moles of substance present in the sample: the smallest amount of titrant that is sufficient to fully neutralize or react with the analyte...
, the equivalence volume
.Thus,
- a plot of
 will have a linear region before equivalence, with slope
- and a plot of
 will have a linear region after equivalence, with slope
- both plots will have
 as intercept
The equivalence volume is used to compute whichever of
or is unknown.The pH meter is usually calibrated with buffer solutions at known pH values before starting the titration. The ionic strength
Ionic strength
The ionic strength of a solution is a measure of the concentration of ions in that solution. Ionic compounds, when dissolved in water, dissociate into ions. The total electrolyte concentration in solution will affect important properties such as the dissociation or the solubility of different salts...
can be kept constant by judicious choice of acid and base. For instance, HCl titrated with NaOH of approximately the same concentration will replace H+ with an ion (Na+) of the same charge at the same concentration, to keep the ionic strength fairly constant. Otherwise, a relatively high concentration of background electrolyte can be used, or the activity quotient
Activity coefficient
An activity coefficient is a factor used in thermodynamics to account for deviations from ideal behaviour in a mixture of chemical substances. In an ideal mixture, the interactions between each pair of chemical species are the same and, as a result, properties of the mixtures can be expressed...
can be computed.
Titrating strong base with strong acid
Mirror-image plots are obtained if titrating the base with the acid, and the signs of the slopes are reversed.- a plot of
 will have a linear region before equivalence with slope
- and a plot of
 will have a linear region after equivalence with slope
- both plots will have
 as x-intercept
Figure 1 gives sample Gran plots of a strong base-strong acid titration.
Concentrations and Dissociation Constants of Weak Acids
The method can be used to estimate the dissociation constants of weak acids, as well as their concentrations (Gran, 1952). With an acid represented by HA, where ,we have at any ith point in the titration of a volume
of acid at a concentration by base of concentration . In the linear regions away from equivalence, and are valid approximations, whence
, or or, because ,.A plot of
versus will have a slope over the linear acidic region and an extrapolated x-intercept , from which either or can be computed. The alkaline region is treated in the same manner as for a titration of strong acid. Figure 2 gives an example; in this example, the two x-intercepts differ by about 0.2 mL but this is a small discrepancy, given the large equivalence volume (0.5% error).Similar equations can be written for the titration of a weak base by strong acid (Gran, 1952; Harris, 1998).
Carbonate content
Martell and Motekaitis (1992) use the most linear regions and exploit the difference in equivalence volumes between acid-side and base-side plots during an acid-base titration to estimate the adventitious CO2 content in the base solution. This is illustrated in the sample Gran plots of Figure 1. In that situation, the extra acid used to neutralize the carbonate, by double protonation, in volume of titrate is . In the opposite case of a titration of acid by base, the carbonate content is similarly computed from , where is the base-side equivalence volume (from Martell and Motekaitis).When the total CO2 content is significant, as in natural waters and alkaline effluents, two or three inflections can be seen in the pH-volume curves owing to buffering by higher concentrations of bicarbonate and carbonate. As discussed by Stumm and Morgan (1981), the analysis of such waters can use up to six Gran plots from a single titration to estimate the multiple end points and measure the total alkalinity and the carbonate and/or bicarbonate contents.
Potentiometric monitoring of H+
To use potentiometric (e.m.f.) measurements in monitoring the concentration in place of readings, one can trivially set and apply the same equations as above, where is the offset correction , and is a slope correction (1/59.2 pH units/mV at 25°C), such that replaces .Thus, as before for a titration of strong acid by strong base,
- a plot of
 vs.
vs.  will have a linear region before equivalence, with slope
- and a plot of
 vs.
vs.  will have a linear region after equivalence, with slope
- both plots will have
 as intercept and, as before, the acid-side equivalence volume can be used to standardize whichever concentration is unknown, and the difference between acid-side and base-side equivalence volumes can be used to estimate the carbonate content
Analogous plots can be drawn using data from a titration of base by acid.
Electrode calibration
Note that the above analysis requires prior knowledge of and .If a pH electrode is not well calibrated, an offset correction can be computed in situ from the acid-side Gran slope:
- For a titration of acid by base, the acid-side slope (
 ) can serve to compute
  using a known value of
  or using the value given by the equivalence volume.
  can then be computed from the base-side slope.
 - For a titration of base by acid, as illustrated in the sample plots, the acid-side slope (
 ) is similarly used to compute
  and the base-side slope (
 ) is used to compute
  using a known value of
  or using the value given by the acid-side equivalence volume.
In the sample data illustrated in Figure 1, this offset correction was not insignificant, at -0.054 pH units.
The value of
, however, may deviate from its theoretical value and can only be assessed by a proper calibration of the electrode. Calibration of an electrode is often performed using buffers of known pH, or by performing a titration of strong acid with strong base. In that case, a constant ionic strength can be maintained, and is known at all titration points if both and are known (and should be directly related to primary standardPrimary standard
A primary standard in metrology is a standard that is accurate enough that it is not calibrated by or subordinate to other standards. Primary standards are defined via other quantities like length, mass and time. Primary standards are used to calibrate other standards referred to as working...
s). For instance, Martell and Motekaitis (1992) calculated the pH value expected at the start of the titration, having earlier titrated the acid and base solutions against primary standards, then adjusted the pH electrode reading accordingly, but this does not afford a slope correction if one is needed.
Based on earlier work by McBryde (1969), Gans and O'Sullivan (2000) describe an iterative approach to arrive at both
and values in the relation , from a titration of strong acid by strong base:-
 is first estimated from the acidic data according to Rossotti and Rossotti (1965), and
  is initially taken to have its theoretical value;
- modified Gran function plots are drawn, using
 vs.
vs.  on the acidic side of equivalence and
  vs.
vs.  on the alkaline side, and the equivalence volumes
  and
and  are computed therefrom, as before;
- as before, the difference in the equivalence volumes is used to compute the carbonate content but also to calculate an 'effective base concentration'
 for the alkaline side of equivalence;
- approximate
 values are computed on the acid side as
  and on the alkaline side as
  ;
;
- the initial definition
 is rewritten as
  , and the
  data are plotted against
  , using those
  values corresponding to pH values in the 2.5-4.5 and 10.7-11.5 ranges (the linear response range for a glass electrode that avoids variation of junction potentials and/or alkaline error at the pH extrema, and that additionally avoids measurement uncertainties near the equivalence point as well as computational errors from the neglect of
  on the acid side and the neglect of the carbonate/bicarbonate equilibrium on the alkaline side); a linear least-squares treatment provides
  as slope and
  as intercept;
- steps 2 and 3 are repeated with the new
 and
and  values for greater precision in the equivalence volumes and the CO2 content.
The procedure could in principle be modified for titrations of base by acid. A computer program named GLEE (for GLass Electrode Evaluation) implements this approach on titrations of acid by base for electrode calibration. This program additionally can compute (by a separate, non-linear least-squares process) a 'correction' for the base concentration. An advantage of this method of electrode calibration is that it can be performed in the same medium of constant ionic strength
Ionic strength
The ionic strength of a solution is a measure of the concentration of ions in that solution. Ionic compounds, when dissolved in water, dissociate into ions. The total electrolyte concentration in solution will affect important properties such as the dissociation or the solubility of different salts...
which may later be used for the determination of equilibrium constants
Determination of equilibrium constants
Equilibrium constants are determined in order to quantify chemical equilibria. When an equilibrium constant is expressed as a concentration quotient,K=\frac...
.
Note that the regular Gran functions will provide the required equivalence volumes and, as
is initially set at its theoretical value, the initial estimate for in step 1 can be had from the slope of the regular acid-side Gran function as detailed earlier. Note too that this procedure computes the CO2 content and can indeed be combined with a complete standardization of the base, using the definition of to compute . Finally, the usable pH range could be extended by solving the quadratic for .Potentiometric monitoring of other species
. When monitoring any species by potentiometry, one can apply the same formalism with . Thus, a titration of a solution of another species by species is analogous to a pH-monitored titration of base by acid, whence either or plotted versus will have an x-intercept . In the opposite titration of by , the equivalence volume will be . The significance of the slopes will depend on the interactions between the two species, whether associating in solution or precipitating together (Gran, 1952). Usually, the only result of interest is the equivalence point. However, the before-equivalence slope could in principle be used to assess the solubility product in the same way as can be determined from acid-base titrations, although other ion-pair association interactions may be occurring as well.To illustrate, consider a titration of Cl- by Ag+ monitored potentiometrically:
Hence,
- a plot of
 will have a linear region before equivalence, with slope
- and a plot of
 will have a linear region after equivalence, with slope
- in both plots, the x-intercept is
Figure 3 gives sample plots of potentiometric titration data.
Non-ideal behaviour
In any titration lacking buffering components, both before-equivalence and beyond-equivalence plots should ideally cross the x axis at the same point. Non-ideal behaviour can result from measurement errors (e.g. a poorly calibrated electrode, an insufficient equilibration time before recording the electrode reading, drifts in ionic strength), sampling errors (e.g. low data densities in the linear regions) or an incomplete chemical model (e.g. the presence of titratable impurities such as carbonate in the base, or incomplete precipitation in potentiometric titrations of dilute solutions, for which Gran et al. (1981) propose alternate approaches). Buffle et al. (1972) discuss a number of error sources.Because the
or terms in the Gran functions only asymptotically tend toward, and never reach, the x axis, curvature approaching the equivalence point is to be expected in all cases. However, there is disagreement among practitioners as to which data to plot, whether using only data on one side of equivalence or on both sides, and whether to select data nearest equivalence or in the most linear portions: using the data nearest the equivalence point will enable the two x-intercepts to be more coincident with each other and to better coincide with estimates from derivative plots, while using acid-side data in an acid-base titration presumably minimizes interference from titratable (buffering) impurities, such as bicarbonate/carbonate in the base (see Carbonate content), and the effect of a drifting ionic strength. In the sample plots displayed in the Figures, the most linear regions (the data represented by filled circles) were selected for the least-squares computations of slopes and intercepts. Data selection is always subjective.