

Fraction of variance unexplained
Encyclopedia
In statistics
, the fraction of variance unexplained (FVU) in the context of a regression task
is the fraction of variance of the regressand Y which cannot be explained, i.e., which is not correctly predicted, by the explanatory variables X.
For a more general definition of explained/unexplained variation/randomness/variance, see the article explained variation
.
 , we have:

where R2 is the coefficient of determination
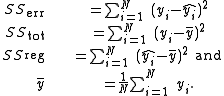
, and SSerr (the sum of squared predictions errors, equivalently the residual sum of squares
), SStot (the total sum of squares
), and SSreg (the sum of squares of the regression, equivalently the explained sum of squares
) are given by
Alternatively, the fraction of variance unexplained can be defined as:
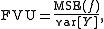
where MSE(f) is the mean squared error
of the regression function ƒ.
 . It follows that the MSE of this function equals the variance of Y; that is, SSE = SST, and SSR = 0. In this case, no variation in Y can be accounted for, and the FVU then has its maximum value of 1.
More generally, the FVU will be 1 if the explanatory variables X tell us nothing about Y in the sense that the predicted values of Y do not covary
with Y. But as prediction gets better and the MSE can be reduced, the FVU goes down. In the case of perfect prediction where , the MSE is 0, SSE = 0, SSR = SST, and the FVU is 0.
Statistics
Statistics is the study of the collection, organization, analysis, and interpretation of data. It deals with all aspects of this, including the planning of data collection in terms of the design of surveys and experiments....
, the fraction of variance unexplained (FVU) in the context of a regression task
Regression analysis
In statistics, regression analysis includes many techniques for modeling and analyzing several variables, when the focus is on the relationship between a dependent variable and one or more independent variables...
is the fraction of variance of the regressand Y which cannot be explained, i.e., which is not correctly predicted, by the explanatory variables X.
For a more general definition of explained/unexplained variation/randomness/variance, see the article explained variation
Explained variation
In statistics, explained variation or explained randomness measures the proportion to which a mathematical model accounts for the variation of a given data set...
.
Formal definition
Given a regression function ƒ yielding for each yi, 1 ≤ i ≤ N, an estimate, we have:where R2 is the coefficient of determination
Coefficient of determination
In statistics, the coefficient of determination R2 is used in the context of statistical models whose main purpose is the prediction of future outcomes on the basis of other related information. It is the proportion of variability in a data set that is accounted for by the statistical model...
, and SSerr (the sum of squared predictions errors, equivalently the residual sum of squares
Residual sum of squares
In statistics, the residual sum of squares is the sum of squares of residuals. It is also known as the sum of squared residuals or the sum of squared errors of prediction . It is a measure of the discrepancy between the data and an estimation model...
), SStot (the total sum of squares
Total sum of squares
In statistical data analysis the total sum of squares is a quantity that appears as part of a standard way of presenting results of such analyses...
), and SSreg (the sum of squares of the regression, equivalently the explained sum of squares
Explained sum of squares
In statistics, the explained sum of squares is a quantity used in describing how well a model, often a regression model, represents the data being modelled...
) are given by
Alternatively, the fraction of variance unexplained can be defined as:
where MSE(f) is the mean squared error
Mean squared error
In statistics, the mean squared error of an estimator is one of many ways to quantify the difference between values implied by a kernel density estimator and the true values of the quantity being estimated. MSE is a risk function, corresponding to the expected value of the squared error loss or...
of the regression function ƒ.
Explanation
It is useful to consider the second definition to get the idea behind FVU. When trying to predict Y, the most naïve regression function that we can think of is the constant function predicting the mean of Y, i.e.,. It follows that the MSE of this function equals the variance of Y; that is, SSE = SST, and SSR = 0. In this case, no variation in Y can be accounted for, and the FVU then has its maximum value of 1.More generally, the FVU will be 1 if the explanatory variables X tell us nothing about Y in the sense that the predicted values of Y do not covary
Covariance
In probability theory and statistics, covariance is a measure of how much two variables change together. Variance is a special case of the covariance when the two variables are identical.- Definition :...
with Y. But as prediction gets better and the MSE can be reduced, the FVU goes down. In the case of perfect prediction where
, the MSE is 0, SSE = 0, SSR = SST, and the FVU is 0.See also
- Coefficient of determinationCoefficient of determinationIn statistics, the coefficient of determination R2 is used in the context of statistical models whose main purpose is the prediction of future outcomes on the basis of other related information. It is the proportion of variability in a data set that is accounted for by the statistical model...
- CorrelationCorrelationIn statistics, dependence refers to any statistical relationship between two random variables or two sets of data. Correlation refers to any of a broad class of statistical relationships involving dependence....
- Regression analysisRegression analysisIn statistics, regression analysis includes many techniques for modeling and analyzing several variables, when the focus is on the relationship between a dependent variable and one or more independent variables...
- Linear regressionLinear regressionIn statistics, linear regression is an approach to modeling the relationship between a scalar variable y and one or more explanatory variables denoted X. The case of one explanatory variable is called simple regression...