

Determining the number of clusters in a data set
Encyclopedia
Determining the number of clusters in a data set, a quantity often labeled k as in the k-means algorithm, is a frequent problem in data clustering
, and is a distinct issue from the process of actually solving the clustering problem.
For a certain class of clustering algorithms (in particular k-means, k-medoids and Expectation-maximization algorithm
), there is a parameter commonly referred to as k that specifies the number of clusters to detect. Other algorithms such as DBSCAN
and OPTICS algorithm
do not require the specification of this parameter; hierarchical clustering
avoids the problem altogether.
The correct choice of k is often ambiguous, with interpretations depending on the shape and scale of the distribution of points in a data set and the desired clustering resolution of the user. In addition, increasing k without penalty will always reduce the amount of error in the resulting clustering, to the extreme case of zero error if each data point is considered its own cluster (i.e., when k equals the number of data points, n). Intuitively then, the optimal choice of k will strike a balance between maximum compression of the data using a single cluster, and maximum accuracy by assigning each data point to its own cluster. If an appropriate value of k is not apparent from prior knowledge of the properties of the data set, it must be chosen somehow. There are several categories of methods for making this decision.
sets the number to
with n as the number of objects (data points).
(m x n) / t
where t is the no. of non-zero entries in D. Note that in D each row and each column must contain at least one non-zero element.
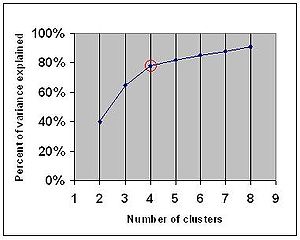 Another method looks at the percentage of variance explained as a function of the number of clusters:
You should choose a number of clusters so that adding another cluster doesn't give much better modeling of the data.
More precisely, if you graph the percentage of variance explained by the clusters against the number of clusters, the first clusters will add much information (explain a lot of variance), but at some point the marginal gain will drop, giving an angle in the graph. The number of clusters are chosen at this point, hence the "elbow criterion".
This "elbow" cannot always be unambiguously identified.
Percentage of variance explained is the ratio of the between-group variance to the total variance, also known as an F-test
. A slight variation of this method plots the curvature of the within group variance.
The method can be traced to speculation by Robert L. Thorndike in 1953.
(AIC), Bayesian information criterion (BIC), or the Deviance information criterion
(DIC) — if it is possible to make a likelihood function for the clustering model.
For example: The k-means model is "almost" a Gaussian mixture model and one can construct a likelihood for the Gaussian mixture model and thus also determine information criterion values.
has been applied to choosing k called the "jump" method, which determines the number of clusters that maximizes efficiency while minimizing error by information theoretic
standards. The strategy of the algorithm is to generate a distortion curve for the input data by running a standard clustering algorithm such as k-means
for all values of k between 1 and n, and computing the distortion (described below) of the resulting clustering. The distortion curve is then transformed by a negative power chosen based on the dimensionality of the data. Jumps in the resulting values then signify reasonable choices for k, with the largest jump representing the best choice.
The distortion of a clustering of some input data is formally defined as follows: Let the data set be modeled as a p-dimensional random variable
, X, consisting of a mixture distribution of G components with common covariance
, . If we let
  be a set of K cluster centers, with
  the closest center to a given sample of X, then the minimum average distortion per dimension when fitting the K centers to the data is:
This is also the average Mahalanobis distance
per dimension between X and the set of cluster centers C. Because the minimization over all possible sets of cluster centers is prohibitively complex, the distortion is computed in practice by generating a set of cluster centers using a standard clustering algorithm and computing the distortion using the result. The pseudo-code for the jump method with an input set of p-dimensional data points X is:
The choice of the transform power is motivated by asymptotic reasoning
using results from rate distortion theory. Let the data X have a single, arbitrarily p-dimensional Gaussian distribution, and let fixed K = floor( ), for some
  greater than zero. Then the distortion of a clustering of K clusters in the limit
as p goes to infinity is . It can be seen that asymptotically, the distortion of a clustering to the power
  is proportional to
  , which by definition is approximately the number of clusters K. In other words, for a single Gaussian distribution, increasing K beyond the true number of clusters, which should be one, causes a linear growth in distortion. This behavior is important in the general case of a mixture of multiple distribution components.
Let X be a mixture of G p-dimensional Gaussian distributions with common covariance. Then for any fixed K less than G, the distortion of a clustering as p goes to infinity is infinite. Intuitively, this means that a clustering of less than the correct number of clusters is unable to describe asymptotically high-dimensional data, causing the distortion to increase without limit. If, as described above, K is made an increasing function of p, namely, K = floor( ), the same result as above is achieved, with the value of the distortion in the limit as p goes to infinity being equal to
  . Correspondingly, there is the same proportional relationship between the transformed distortion and the number of clusters, K.
Putting the results above together, it can be seen that for sufficiently high values of p, the transformed distortion is approximately zero for K < G, then jumps suddenly and begins increasing linearly for K >= G. The jump algorithm for choosing K makes use of these behaviors to identify the most likely value for the true number of clusters.
Although the mathematical support for the method is given in terms of asymptotic results, the algorithm has been empirical
ly verified to work well in a variety of data sets with reasonable dimensionality. In addition to the localized jump method described above, there exists a second algorithm for choosing K using the same transformed distortion values known as the broken line method. The broken line method identifies the jump point in the graph of the transformed distortion by doing a simple least squares
error line fit of two line segments, which in theory will fall along the x-axis for K < G, and along the linearly increasing phase of the transformed distortion plot for K >= G. The broken line method is more robust than the jump method in that its decision is global rather than local, but it also relies on the assumption of Gaussian mixture components, whereas the jump method is fully non-parametric
and has been shown to be viable for general mixture distributions.
of the data is another useful criterion for assessing the natural number of clusters. The silhouette of a datum is a measure of how closely it is matched to data within its cluster and how loosely it is matched to data of the neighbouring cluster, i.e. the cluster whose average distance from the datum is lowest. A silhouette close to implies the datum is in an appropriate cluster, whilst a silhouette close to
  implies the datum is in the wrong cluster. Optimization techniques such as genetic algorithms are useful in determining the number of clusters that gives rise to the largest silhouette.
The kernel matrix can thus be analyzed in order to find the optimal number of clusters . The method proceeds by the eigenvalue decomposition of the kernel matrix. It will then analyze the eigenvalues and eigenvectors to obtain a measure of the compactness of the input distribution. Finally, a plot will be drawn, where the elbow of that plot indicates the optimal number of clusters in the data set. Unlike previous methods, this technique does not need to perform any clustering a-priori. It directly find the number of clusters from the data.
Data clustering
Cluster analysis or clustering is the task of assigning a set of objects into groups so that the objects in the same cluster are more similar to each other than to those in other clusters....
, and is a distinct issue from the process of actually solving the clustering problem.
For a certain class of clustering algorithms (in particular k-means, k-medoids and Expectation-maximization algorithm
Expectation-maximization algorithm
In statistics, an expectation–maximization algorithm is an iterative method for finding maximum likelihood or maximum a posteriori estimates of parameters in statistical models, where the model depends on unobserved latent variables...
), there is a parameter commonly referred to as k that specifies the number of clusters to detect. Other algorithms such as DBSCAN
DBSCAN
DBSCAN is a data clustering algorithm proposed by Martin Ester, Hans-Peter Kriegel, Jörg Sander and Xiaowei Xu in 1996....
and OPTICS algorithm
OPTICS algorithm
OPTICS is an algorithm for finding density-based clusters in spatial data. It was presented by Mihael Ankerst, Markus M. Breunig, Hans-Peter Kriegel and Jörg Sander....
do not require the specification of this parameter; hierarchical clustering
Hierarchical clustering
In statistics, hierarchical clustering is a method of cluster analysis which seeks to build a hierarchy of clusters. Strategies for hierarchical clustering generally fall into two types:...
avoids the problem altogether.
The correct choice of k is often ambiguous, with interpretations depending on the shape and scale of the distribution of points in a data set and the desired clustering resolution of the user. In addition, increasing k without penalty will always reduce the amount of error in the resulting clustering, to the extreme case of zero error if each data point is considered its own cluster (i.e., when k equals the number of data points, n). Intuitively then, the optimal choice of k will strike a balance between maximum compression of the data using a single cluster, and maximum accuracy by assigning each data point to its own cluster. If an appropriate value of k is not apparent from prior knowledge of the properties of the data set, it must be chosen somehow. There are several categories of methods for making this decision.
Rule of thumb
One simple rule of thumbRule of thumb
A rule of thumb is a principle with broad application that is not intended to be strictly accurate or reliable for every situation. It is an easily learned and easily applied procedure for approximately calculating or recalling some value, or for making some determination...
sets the number to

with n as the number of objects (data points).
Finding Number of Clusters in Text Databases
In text databases, a document collection defined by a document by term D matrix (of size m by n, m: no. of documents, n: no. of terms) number of clusters can be estimated by the following formula(m x n) / t
where t is the no. of non-zero entries in D. Note that in D each row and each column must contain at least one non-zero element.
The Elbow Method
You should choose a number of clusters so that adding another cluster doesn't give much better modeling of the data.
More precisely, if you graph the percentage of variance explained by the clusters against the number of clusters, the first clusters will add much information (explain a lot of variance), but at some point the marginal gain will drop, giving an angle in the graph. The number of clusters are chosen at this point, hence the "elbow criterion".
This "elbow" cannot always be unambiguously identified.
Percentage of variance explained is the ratio of the between-group variance to the total variance, also known as an F-test
F-test
An F-test is any statistical test in which the test statistic has an F-distribution under the null hypothesis.It is most often used when comparing statistical models that have been fit to a data set, in order to identify the model that best fits the population from which the data were sampled. ...
. A slight variation of this method plots the curvature of the within group variance.
The method can be traced to speculation by Robert L. Thorndike in 1953.
Information Criterion Approach
Another set of methods for determining the number of clusters are information criteria, such as the Akaike information criterionAkaike information criterion
The Akaike information criterion is a measure of the relative goodness of fit of a statistical model. It was developed by Hirotsugu Akaike, under the name of "an information criterion" , and was first published by Akaike in 1974...
(AIC), Bayesian information criterion (BIC), or the Deviance information criterion
Deviance information criterion
The deviance information criterion is a hierarchical modeling generalization of the AIC and BIC . It is particularly useful in Bayesian model selection problems where the posterior distributions of the models have been obtained by Markov chain Monte Carlo simulation...
(DIC) — if it is possible to make a likelihood function for the clustering model.
For example: The k-means model is "almost" a Gaussian mixture model and one can construct a likelihood for the Gaussian mixture model and thus also determine information criterion values.
An Information Theoretic Approach
Rate distortion theoryRate distortion theory
Rate–distortion theory is a major branch of information theory which provides the theoretical foundations for lossy data compression; it addresses the problem of determining the minimal amount of entropy R that should be communicated over a channel, so that the source can be approximately...
has been applied to choosing k called the "jump" method, which determines the number of clusters that maximizes efficiency while minimizing error by information theoretic
Information theory
Information theory is a branch of applied mathematics and electrical engineering involving the quantification of information. Information theory was developed by Claude E. Shannon to find fundamental limits on signal processing operations such as compressing data and on reliably storing and...
standards. The strategy of the algorithm is to generate a distortion curve for the input data by running a standard clustering algorithm such as k-means
K-means algorithm
In statistics and data mining, k-means clustering is a method of cluster analysis which aims to partition n observations into k clusters in which each observation belongs to the cluster with the nearest mean...
for all values of k between 1 and n, and computing the distortion (described below) of the resulting clustering. The distortion curve is then transformed by a negative power chosen based on the dimensionality of the data. Jumps in the resulting values then signify reasonable choices for k, with the largest jump representing the best choice.
The distortion of a clustering of some input data is formally defined as follows: Let the data set be modeled as a p-dimensional random variable
Random variable
In probability and statistics, a random variable or stochastic variable is, roughly speaking, a variable whose value results from a measurement on some type of random process. Formally, it is a function from a probability space, typically to the real numbers, which is measurable functionmeasurable...
, X, consisting of a mixture distribution of G components with common covariance
Covariance
In probability theory and statistics, covariance is a measure of how much two variables change together. Variance is a special case of the covariance when the two variables are identical.- Definition :...
,
. If we let be a set of K cluster centers, with the closest center to a given sample of X, then the minimum average distortion per dimension when fitting the K centers to the data is:This is also the average Mahalanobis distance
Mahalanobis distance
In statistics, Mahalanobis distance is a distance measure introduced by P. C. Mahalanobis in 1936. It is based on correlations between variables by which different patterns can be identified and analyzed. It gauges similarity of an unknown sample set to a known one. It differs from Euclidean...
per dimension between X and the set of cluster centers C. Because the minimization over all possible sets of cluster centers is prohibitively complex, the distortion is computed in practice by generating a set of cluster centers using a standard clustering algorithm and computing the distortion using the result. The pseudo-code for the jump method with an input set of p-dimensional data points X is:
 JumpMethod(X):

     Let Y = (p/2)

     Init a list D, of size n+1

     Let D[0] = 0

     For k = 1 ... n:

         Cluster X with k clusters (e.g., with k-means)

         Let d = Distortion of the resulting clustering

         D[k] = d^(-Y)

     Define J(i) = D[i] - D[i-1]

     Return the k between 1 and n that maximizes J(k)
The choice of the transform power
is motivated by asymptotic reasoningAsymptotic analysis
In mathematical analysis, asymptotic analysis is a method of describing limiting behavior. The methodology has applications across science. Examples are...
using results from rate distortion theory. Let the data X have a single, arbitrarily p-dimensional Gaussian distribution, and let fixed K = floor(
), for some greater than zero. Then the distortion of a clustering of K clusters in the limitLimit (mathematics)
In mathematics, the concept of a "limit" is used to describe the value that a function or sequence "approaches" as the input or index approaches some value. The concept of limit allows mathematicians to define a new point from a Cauchy sequence of previously defined points within a complete metric...
as p goes to infinity is
. It can be seen that asymptotically, the distortion of a clustering to the power is proportional to , which by definition is approximately the number of clusters K. In other words, for a single Gaussian distribution, increasing K beyond the true number of clusters, which should be one, causes a linear growth in distortion. This behavior is important in the general case of a mixture of multiple distribution components.Let X be a mixture of G p-dimensional Gaussian distributions with common covariance. Then for any fixed K less than G, the distortion of a clustering as p goes to infinity is infinite. Intuitively, this means that a clustering of less than the correct number of clusters is unable to describe asymptotically high-dimensional data, causing the distortion to increase without limit. If, as described above, K is made an increasing function of p, namely, K = floor(
), the same result as above is achieved, with the value of the distortion in the limit as p goes to infinity being equal to . Correspondingly, there is the same proportional relationship between the transformed distortion and the number of clusters, K.Putting the results above together, it can be seen that for sufficiently high values of p, the transformed distortion
is approximately zero for K < G, then jumps suddenly and begins increasing linearly for K >= G. The jump algorithm for choosing K makes use of these behaviors to identify the most likely value for the true number of clusters.Although the mathematical support for the method is given in terms of asymptotic results, the algorithm has been empirical
Empirical
The word empirical denotes information gained by means of observation or experimentation. Empirical data are data produced by an experiment or observation....
ly verified to work well in a variety of data sets with reasonable dimensionality. In addition to the localized jump method described above, there exists a second algorithm for choosing K using the same transformed distortion values known as the broken line method. The broken line method identifies the jump point in the graph of the transformed distortion by doing a simple least squares
Least squares
The method of least squares is a standard approach to the approximate solution of overdetermined systems, i.e., sets of equations in which there are more equations than unknowns. "Least squares" means that the overall solution minimizes the sum of the squares of the errors made in solving every...
error line fit of two line segments, which in theory will fall along the x-axis for K < G, and along the linearly increasing phase of the transformed distortion plot for K >= G. The broken line method is more robust than the jump method in that its decision is global rather than local, but it also relies on the assumption of Gaussian mixture components, whereas the jump method is fully non-parametric
Non-parametric statistics
In statistics, the term non-parametric statistics has at least two different meanings:The first meaning of non-parametric covers techniques that do not rely on data belonging to any particular distribution. These include, among others:...
and has been shown to be viable for general mixture distributions.
Choosing k Using the Silhouette
The average silhouetteSilhouette (clustering)
Silhouette refers to a method of interpretation and validation of clusters of data. The technique provides a succinct graphical representation of how well each object lies within its cluster. It was first described by Peter J. Rousseeuw in 1986.- Method :...
of the data is another useful criterion for assessing the natural number of clusters. The silhouette of a datum is a measure of how closely it is matched to data within its cluster and how loosely it is matched to data of the neighbouring cluster, i.e. the cluster whose average distance from the datum is lowest. A silhouette close to
implies the datum is in an appropriate cluster, whilst a silhouette close to implies the datum is in the wrong cluster. Optimization techniques such as genetic algorithms are useful in determining the number of clusters that gives rise to the largest silhouette.Cross-validation
One can also use the process of cross-validation to analyze the number of clusters. In this process, the data is partitioned into v parts. Each of the parts is then set aside at turn as a test set, a clustering model computed on the other v-1 training sets, and the value of the goal function (for example, the sum of the squared distances to the centroids for k-means) calculated for the test set. These v values are calculated and averaged for each alternative number of clusters, and the cluster number selected that minimizes the test set errors.Analyzing the Kernel Matrix
Kernel matrix defines the proximity of the input information. For example, in Gaussian Radial basis function, determines the dot product of the inputs in a higher-dimensional space, called feature space. It is believed that the data become more linearly separable in the feature space, and hence, linear algorithms can be applied on the data with a higher success.The kernel matrix can thus be analyzed in order to find the optimal number of clusters . The method proceeds by the eigenvalue decomposition of the kernel matrix. It will then analyze the eigenvalues and eigenvectors to obtain a measure of the compactness of the input distribution. Finally, a plot will be drawn, where the elbow of that plot indicates the optimal number of clusters in the data set. Unlike previous methods, this technique does not need to perform any clustering a-priori. It directly find the number of clusters from the data.
External links
- Clustergram - cluster diagnostic plot - for visual diagnostics of choosing the number of (k) clusters (RR (programming language)R is a programming language and software environment for statistical computing and graphics. The R language is widely used among statisticians for developing statistical software, and R is widely used for statistical software development and data analysis....
code)