
Least squares
Overview
Overdetermined system
In mathematics, a system of linear equations is considered overdetermined if there are more equations than unknowns. The terminology can be described in terms of the concept of counting constraints. Each unknown can be seen as an available degree of freedom...
s, i.e., sets of equations in which there are more equations than unknowns. "Least squares" means that the overall solution minimizes the sum of the squares of the errors made in solving every single equation.
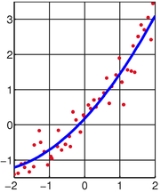
The most important application is in data fitting
Curve fitting
Curve fitting is the process of constructing a curve, or mathematical function, that has the best fit to a series of data points, possibly subject to constraints. Curve fitting can involve either interpolation, where an exact fit to the data is required, or smoothing, in which a "smooth" function...
. The best fit in the least-squares sense minimizes the sum of squared residuals
Errors and residuals in statistics
In statistics and optimization, statistical errors and residuals are two closely related and easily confused measures of the deviation of a sample from its "theoretical value"...
, a residual being the difference between an observed value and the fitted value provided by a model.
Unanswered Questions