

Variance inflation factor
Encyclopedia
In statistics
, the variance inflation factor (VIF) quantifies the severity of multicollinearity
in an ordinary least squares
regression
analysis. It provides an index that measures how much the variance
(the square of the estimate's standard deviation
) of an estimated regression coefficient is increased because of collinearity.
with k independent variables:
The standard error
of the estimate of βj is the square root of the j+1, j+1 element of s2(X′X)−1, where s is the standard error of the estimate (SEE) (note that SEE2 is an unbiased estimator of the true variance of the error term, ); X is the regression design matrix
— a matrix such that Xi, j+1 is the value of the jth independent variable for the ith case or observation, and such that Xi, 1 equals 1 for all i. It turns out that the square of this standard error, the estimated variance of the estimate of βj, can be equivalently expressed as
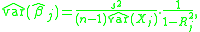
where Rj2 is the multiple R2
for the regression of Xj on the other covariates (a regression that does not involve the response variable Y). This identity separates the influences of several distinct factors on the variance of the coefficient estimate:
The remaining term, 1 / (1 − Rj2) is the VIF. It reflects all other factors that influence the uncertainty in the coefficient estimates. The VIF equals 1 when the vector Xj is orthogonal to each column of the design matrix for the regression of Xj on the other covariates. By contrast, the VIF is greater than 1 when the vector Xj is not orthogonal to all columns of the design matrix for the regression of Xj on the other covariates. Finally, note that the VIF is invariant to the scaling of the variables (that is, we could scale each variable Xj by a constant cj without changing the VIF).
If i = 1, for example, the equation would be
where c0 is a constant and e is the error term
.
 with the following formula:
where R2i is the coefficient of determination
of the regression equation in step one.
by considering the size of the . A common rule of thumb is that if
  then multicollinearity is high. Also 10 has been proposed (see Kutner book referenced below) as a cut off value.
Some software calculates the tolerance which is just the reciprocal of the VIF. The choice of which to use is a matter of personal preference of the researcher.
Example
If the variance inflation factor of an independent variable were 5.27 (√5.27 = 2.3) this means that the standard error for the coefficient of that independent variable is 2.3 times as large as it would be if that independent variable were uncorrelated with the other independent variables.
Statistics
Statistics is the study of the collection, organization, analysis, and interpretation of data. It deals with all aspects of this, including the planning of data collection in terms of the design of surveys and experiments....
, the variance inflation factor (VIF) quantifies the severity of multicollinearity
Multicollinearity
Multicollinearity is a statistical phenomenon in which two or more predictor variables in a multiple regression model are highly correlated. In this situation the coefficient estimates may change erratically in response to small changes in the model or the data...
in an ordinary least squares
Ordinary least squares
In statistics, ordinary least squares or linear least squares is a method for estimating the unknown parameters in a linear regression model. This method minimizes the sum of squared vertical distances between the observed responses in the dataset and the responses predicted by the linear...
regression
Linear regression
In statistics, linear regression is an approach to modeling the relationship between a scalar variable y and one or more explanatory variables denoted X. The case of one explanatory variable is called simple regression...
analysis. It provides an index that measures how much the variance
Variance
In probability theory and statistics, the variance is a measure of how far a set of numbers is spread out. It is one of several descriptors of a probability distribution, describing how far the numbers lie from the mean . In particular, the variance is one of the moments of a distribution...
(the square of the estimate's standard deviation
Standard deviation
Standard deviation is a widely used measure of variability or diversity used in statistics and probability theory. It shows how much variation or "dispersion" there is from the average...
) of an estimated regression coefficient is increased because of collinearity.
Definition
Consider the following linear modelLinear model
In statistics, the term linear model is used in different ways according to the context. The most common occurrence is in connection with regression models and the term is often taken as synonymous with linear regression model. However the term is also used in time series analysis with a different...
with k independent variables:
- Y = β0 + β1 X1 + β2 X 2 + ... + βk Xk + ε.
The standard error
Standard error (statistics)
The standard error is the standard deviation of the sampling distribution of a statistic. The term may also be used to refer to an estimate of that standard deviation, derived from a particular sample used to compute the estimate....
of the estimate of βj is the square root of the j+1, j+1 element of s2(X′X)−1, where s is the standard error of the estimate (SEE) (note that SEE2 is an unbiased estimator of the true variance of the error term,
); X is the regression design matrixDesign matrix
In statistics, a design matrix is a matrix of explanatory variables, often denoted by X, that is used in certain statistical models, e.g., the general linear model....
— a matrix such that Xi, j+1 is the value of the jth independent variable for the ith case or observation, and such that Xi, 1 equals 1 for all i. It turns out that the square of this standard error, the estimated variance of the estimate of βj, can be equivalently expressed as
where Rj2 is the multiple R2
Coefficient of determination
In statistics, the coefficient of determination R2 is used in the context of statistical models whose main purpose is the prediction of future outcomes on the basis of other related information. It is the proportion of variability in a data set that is accounted for by the statistical model...
for the regression of Xj on the other covariates (a regression that does not involve the response variable Y). This identity separates the influences of several distinct factors on the variance of the coefficient estimate:
- s2: greater scatter in the data around the regression surface leads to proportionately more variance in the coefficient estimates
- n: greater sample size results in proportionately less variance in the coefficient estimates
-
 : greater variability in a particular covariate leads to proportionately less variance in the corresponding coefficient estimate
The remaining term, 1 / (1 − Rj2) is the VIF. It reflects all other factors that influence the uncertainty in the coefficient estimates. The VIF equals 1 when the vector Xj is orthogonal to each column of the design matrix for the regression of Xj on the other covariates. By contrast, the VIF is greater than 1 when the vector Xj is not orthogonal to all columns of the design matrix for the regression of Xj on the other covariates. Finally, note that the VIF is invariant to the scaling of the variables (that is, we could scale each variable Xj by a constant cj without changing the VIF).
Step one
Calculate k different VIFs, one for each Xi by first running an ordinary least square regression that has Xi as a function of all the other explanatory variables in the first equation.If i = 1, for example, the equation would be
where c0 is a constant and e is the error term
Errors and residuals in statistics
In statistics and optimization, statistical errors and residuals are two closely related and easily confused measures of the deviation of a sample from its "theoretical value"...
.
Step two
Then, calculate the VIF factor for with the following formula:
where R2i is the coefficient of determination
Coefficient of determination
In statistics, the coefficient of determination R2 is used in the context of statistical models whose main purpose is the prediction of future outcomes on the basis of other related information. It is the proportion of variability in a data set that is accounted for by the statistical model...
of the regression equation in step one.
Step three
Analyze the magnitude of multicollinearityMulticollinearity
Multicollinearity is a statistical phenomenon in which two or more predictor variables in a multiple regression model are highly correlated. In this situation the coefficient estimates may change erratically in response to small changes in the model or the data...
by considering the size of the
. A common rule of thumb is that if then multicollinearity is high. Also 10 has been proposed (see Kutner book referenced below) as a cut off value.Some software calculates the tolerance which is just the reciprocal of the VIF. The choice of which to use is a matter of personal preference of the researcher.
Interpretation
The square root of the variance inflation factor tells you how much larger the standard error is, compared with what it would be if that variable were uncorrelated with the other independent variables in the equation.Example
If the variance inflation factor of an independent variable were 5.27 (√5.27 = 2.3) this means that the standard error for the coefficient of that independent variable is 2.3 times as large as it would be if that independent variable were uncorrelated with the other independent variables.