
Process Window Index
Encyclopedia
Process Window Index is a statistical measure that quantifies the robustness of a manufacturing process which involves heating and cooling, known as a thermal process. In the electronics manufacturing industry, PWI values are used to calibrate the heating and cooling of soldering jobs (known as a thermal profile) while baked in a reflow oven
.
PWI measures how well a thermal process fits into a user-defined process limit known as the specification limit. The specification limit is the tolerance allowed for the process and is statistically determined. In the electronics industry, these specification limits are known as the process window, and values that a plotted inside or outside this window are known as the process window index.
Using PWI values, thermal processes can be accurately measured, analyzed, compared, and tracked at the same level of statistical process control
and quality control
available to other manufacturing processes.
is the ability of a process to produce output within specified limits
. To help determine whether a manufacturing or business process is in a state of statistical control, process engineers use control chart
s, which help to predict the future performance of the process based on the current process.
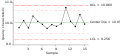
 To help determine the capability of a process, statistically determined upper and lower limits are drawn on either side of a process mean
on the control chart. The control limits are set at three standard deviation
s on either side of the process mean, and are known as the upper control limit (UCL) and lower control limit (LCL) respectively. If the process data plotted on the control chart remains within the control limits over an extended period, then the process is said to be stable.
Within these control limits are the tolerance values specified by the end-user, known as specification limits – the upper specification limit (USL) and lower specification limit (LSL) respectively. If the process data plotted on a control chart remains within these specification limits, then the process is considered a capable process, denoted by .
.
The electronics manufacturing industry has developed customized specification limits known as Process Windows. Within this process window, temperature values are plotted. The values relative to the process mean of this window is known as the Process Window Index. By using PWI values, thermal processes can be accurately measured, analyzed, compared, and tracked at the same level of statistical process control
and quality control
available to other manufacturing processes.
.svg.png) In soldering
In soldering
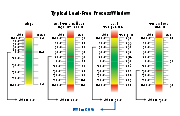
, a thermal profile is a complex set of time-temperature values for a variety of processes
such as slope, thermal soak, reflow, and peak.
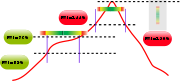
Each thermal profile is ranked on how it fits in a process window (the specification or tolerance limit). Raw temperature values are normalized in terms of a percentage relative to both the process mean and the window limits. The center of the process window is defined as zero, and the extreme edges of the process window are ±99%. A PWI greater than or equal to 100% indicates that the profile does not process the product within specification. A PWI of 99% indicates that the profile processes the product within specification, but runs at the edge of the process window. For example, if the process mean is set at 200 °C, with the process window calibrated at 180 °C and 220 °C respectively; then a measured value of 188 °C translates to a process window index of −60%.
By using PWI values, manufacturers can determine how much of the process window a particular thermal profile uses. A lower PWI value indicates a more robust profile. For maximum efficiency, separate PWI values are computed for peak, slope, reflow, and soak processes of a thermal profile.
To avoid the possibility of thermal shock
affecting production, the steepest slope in the thermal profile is determined and leveled. Manufacturers use custom-built software to accurately determine and decrease the steepness of the slope. In addition, the software also automatically recalibrates the PWI values for the peak, slope, reflow, and soak processes. By setting PWI values, engineers can ensure that the reflow soldering work does not overheat or cool too quickly.
 The Process Window Index is calculated as the worst case (i.e. highest number) in the set of thermal profile data. For example, a thermal profile with three thermocouple
s, with four profile statistics logged for each thermocouple, would have a set of twelve statistics for that thermal profile. In this case, the PWI would be the highest value among the twelve values, expressed as a percentage. The formula to calculate PWI is:
Reflow oven
A reflow oven is a machine used primarily for reflow soldering of surface mount electronic components to printed circuit boards .- Infrared and convection ovens :...
.
PWI measures how well a thermal process fits into a user-defined process limit known as the specification limit. The specification limit is the tolerance allowed for the process and is statistically determined. In the electronics industry, these specification limits are known as the process window, and values that a plotted inside or outside this window are known as the process window index.
Using PWI values, thermal processes can be accurately measured, analyzed, compared, and tracked at the same level of statistical process control
Statistical process control
Statistical process control is the application of statistical methods to the monitoring and control of a process to ensure that it operates at its full potential to produce conforming product. Under SPC, a process behaves predictably to produce as much conforming product as possible with the least...
and quality control
Quality control
Quality control, or QC for short, is a process by which entities review the quality of all factors involved in production. This approach places an emphasis on three aspects:...
available to other manufacturing processes.
Statistical process control
Process capabilityProcess capability
A process is a unique combination of tools, materials, methods, and people engaged in producing a measurable output; for example a manufacturing line for machine parts...
is the ability of a process to produce output within specified limits
Specification (technical standard)
A specification is an explicit set of requirements to be satisfied by a material, product, or service. Should a material, product or service fail to meet one or more of the applicable specifications, it may be referred to as being out of specification;the abbreviation OOS may also be used...
. To help determine whether a manufacturing or business process is in a state of statistical control, process engineers use control chart
Control chart
Control charts, also known as Shewhart charts or process-behaviour charts, in statistical process control are tools used to determine whether or not a manufacturing or business process is in a state of statistical control.- Overview :...
s, which help to predict the future performance of the process based on the current process.
Arithmetic mean
In mathematics and statistics, the arithmetic mean, often referred to as simply the mean or average when the context is clear, is a method to derive the central tendency of a sample space...
on the control chart. The control limits are set at three standard deviation
Standard deviation
Standard deviation is a widely used measure of variability or diversity used in statistics and probability theory. It shows how much variation or "dispersion" there is from the average...
s on either side of the process mean, and are known as the upper control limit (UCL) and lower control limit (LCL) respectively. If the process data plotted on the control chart remains within the control limits over an extended period, then the process is said to be stable.
Within these control limits are the tolerance values specified by the end-user, known as specification limits – the upper specification limit (USL) and lower specification limit (LSL) respectively. If the process data plotted on a control chart remains within these specification limits, then the process is considered a capable process, denoted by
.The electronics manufacturing industry has developed customized specification limits known as Process Windows. Within this process window, temperature values are plotted. The values relative to the process mean of this window is known as the Process Window Index. By using PWI values, thermal processes can be accurately measured, analyzed, compared, and tracked at the same level of statistical process control
Statistical process control
Statistical process control is the application of statistical methods to the monitoring and control of a process to ensure that it operates at its full potential to produce conforming product. Under SPC, a process behaves predictably to produce as much conforming product as possible with the least...
and quality control
Quality control
Quality control, or QC for short, is a process by which entities review the quality of all factors involved in production. This approach places an emphasis on three aspects:...
available to other manufacturing processes.
PWI in electronics manufacturing
Soldering
Soldering is a process in which two or more metal items are joined together by melting and flowing a filler metal into the joint, the filler metal having a lower melting point than the workpiece...
, a thermal profile is a complex set of time-temperature values for a variety of processes
Reflow soldering
Reflow soldering is a process in which a solder paste is used to temporarily attach one or several electrical components to their contact pads, after which the entire assembly is subjected to controlled heat, which melts the solder, permanently connecting the joint...
such as slope, thermal soak, reflow, and peak.
Each thermal profile is ranked on how it fits in a process window (the specification or tolerance limit). Raw temperature values are normalized in terms of a percentage relative to both the process mean and the window limits. The center of the process window is defined as zero, and the extreme edges of the process window are ±99%. A PWI greater than or equal to 100% indicates that the profile does not process the product within specification. A PWI of 99% indicates that the profile processes the product within specification, but runs at the edge of the process window. For example, if the process mean is set at 200 °C, with the process window calibrated at 180 °C and 220 °C respectively; then a measured value of 188 °C translates to a process window index of −60%.
By using PWI values, manufacturers can determine how much of the process window a particular thermal profile uses. A lower PWI value indicates a more robust profile. For maximum efficiency, separate PWI values are computed for peak, slope, reflow, and soak processes of a thermal profile.
To avoid the possibility of thermal shock
Thermal shock
Thermal shock is the name given to cracking as a result of rapid temperature change. Glass and ceramic objects are particularly vulnerable to this form of failure, due to their low toughness, low thermal conductivity, and high thermal expansion coefficients...
affecting production, the steepest slope in the thermal profile is determined and leveled. Manufacturers use custom-built software to accurately determine and decrease the steepness of the slope. In addition, the software also automatically recalibrates the PWI values for the peak, slope, reflow, and soak processes. By setting PWI values, engineers can ensure that the reflow soldering work does not overheat or cool too quickly.
Formula
Thermocouple
A thermocouple is a device consisting of two different conductors that produce a voltage proportional to a temperature difference between either end of the pair of conductors. Thermocouples are a widely used type of temperature sensor for measurement and control and can also be used to convert a...
s, with four profile statistics logged for each thermocouple, would have a set of twelve statistics for that thermal profile. In this case, the PWI would be the highest value among the twelve values, expressed as a percentage. The formula to calculate PWI is:
-

where:- i = 1 to N (number of thermocouples)
- j = 1 to M (number of statistics per thermocouple)
- measured value [i, j] = the [i, j]th statistic's value
- average limits [i, j] = the average of the [i, j]th high and low limits of the statistic
- range [i, j] = the [i, j]th high limit minus the low limit of the statistic
Thus, the PWI is the worst case profile statistic that is the maximum, or highest percentage of the process window used.