
Quartile
Encyclopedia
In descriptive statistics
, the quartiles of a set of values are the three points that divide the data set into four equal groups, each representing a fourth of the population being sampled. A quartile is a type of quantile
.
In epidemiology
, sociology
and finance
, the quartiles of a population are the four subpopulations defined by classifying individuals according to whether the value concerned falls into one of the four ranges defined by the three values discussed above. Thus an individual item might be described as being "in the upper quartile".
The difference between the upper and lower quartiles is called the interquartile range
.
One standard formula for locating the position of the observation at a given percentile, y, with n data points sorted in ascending order is:

This rule is employed by the TI-83 calculator boxplot and "1-Var Stats" functions.
Ordered Data Set: 6, 7, 15, 36, 39, 40, 41, 42, 43, 47, 49
and statistical analysis. As is the basic idea of descriptive statistics
, when encountered with an outlier
, we have to explain this by further analysis of the cause or origin of the outlier. In cases of extreme observations, which are not an infrequent occurrence, the typical values must be analyzed. In the case of quartiles, the Interquartile Range
(IQR) may be used to characterize the data when there may be extremeties that skew the data; the interquartile range
is a relatively robust statistic (also sometimes called "resistance") compared to the range
and standard deviation
. There is also a mathematical method to check for outliers and determining "fences", upper and lower limits from which to check for outliers.
After determining the first and third quartiles and the interquartile range as outlined above, then determining the fences using the following formula:


where Q1 and Q3 are the first and third quartiles, respectively. The Lower fence is the "lower limit" and the Upper fence is the "upper limit" of data, and any data lying outside this defined bounds can be considered an outlier. Anything below the Lower fence or above the Upper fence can be considered such a case. The fences provide a guideline by which to define an outlier
, which may be defined in other ways. The fences define a "range" outside of which an outlier exists; a way to picture this is a boundary of a fence, outside of which are "outsiders" as opposed to outliers.
Descriptive statistics
Descriptive statistics quantitatively describe the main features of a collection of data. Descriptive statistics are distinguished from inferential statistics , in that descriptive statistics aim to summarize a data set, rather than use the data to learn about the population that the data are...
, the quartiles of a set of values are the three points that divide the data set into four equal groups, each representing a fourth of the population being sampled. A quartile is a type of quantile
Quantile
Quantiles are points taken at regular intervals from the cumulative distribution function of a random variable. Dividing ordered data into q essentially equal-sized data subsets is the motivation for q-quantiles; the quantiles are the data values marking the boundaries between consecutive subsets...
.
In epidemiology
Epidemiology
Epidemiology is the study of health-event, health-characteristic, or health-determinant patterns in a population. It is the cornerstone method of public health research, and helps inform policy decisions and evidence-based medicine by identifying risk factors for disease and targets for preventive...
, sociology
Sociology
Sociology is the study of society. It is a social science—a term with which it is sometimes synonymous—which uses various methods of empirical investigation and critical analysis to develop a body of knowledge about human social activity...
and finance
Finance
"Finance" is often defined simply as the management of money or “funds” management Modern finance, however, is a family of business activity that includes the origination, marketing, and management of cash and money surrogates through a variety of capital accounts, instruments, and markets created...
, the quartiles of a population are the four subpopulations defined by classifying individuals according to whether the value concerned falls into one of the four ranges defined by the three values discussed above. Thus an individual item might be described as being "in the upper quartile".
Definitions
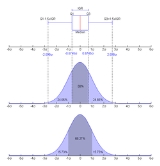
- first quartile (designated Q1) = lower quartile = cuts off lowest 25% of data = 25th percentilePercentileIn statistics, a percentile is the value of a variable below which a certain percent of observations fall. For example, the 20th percentile is the value below which 20 percent of the observations may be found...
- second quartile (designated Q2) = medianMedianIn probability theory and statistics, a median is described as the numerical value separating the higher half of a sample, a population, or a probability distribution, from the lower half. The median of a finite list of numbers can be found by arranging all the observations from lowest value to...
= cuts data set in half = 50th percentilePercentileIn statistics, a percentile is the value of a variable below which a certain percent of observations fall. For example, the 20th percentile is the value below which 20 percent of the observations may be found... - third quartile (designated Q3) = upper quartile = cuts off highest 25% of data, or lowest 75% = 75th percentilePercentileIn statistics, a percentile is the value of a variable below which a certain percent of observations fall. For example, the 20th percentile is the value below which 20 percent of the observations may be found...
The difference between the upper and lower quartiles is called the interquartile range
Interquartile range
In descriptive statistics, the interquartile range , also called the midspread or middle fifty, is a measure of statistical dispersion, being equal to the difference between the upper and lower quartiles...
.
Computing methods
There is no universal agreement on choosing the quartile values.One standard formula for locating the position of the observation at a given percentile, y, with n data points sorted in ascending order is:
- Case 1: If L is a whole number, then the value will be found halfway between positions L and L+1.
- Case 2: If L is a fraction, round to the nearest whole number. (for example, L = 1.2 becomes 1).
Method 1
- Use the median to divide the ordered data set into two halves. Do not include the median into the halves, or the minimum and maximum.
- The lower quartile value is the median of the lower half of the data. The upper quartile value is the median of the upper half of the data.
This rule is employed by the TI-83 calculator boxplot and "1-Var Stats" functions.
Method 2
- Use the median to divide the ordered data set into two halves. If the median is a datum (as opposed to being the average of the middle two data), include the median in both halves.
- The lower quartile value is the median of the lower half of the data. The upper quartile value is the median of the upper half of the data.
Example 1
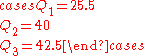
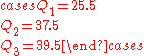
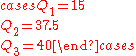
Data Set: 6, 47, 49, 15, 42, 41, 7, 39, 43, 40, 36Ordered Data Set: 6, 7, 15, 36, 39, 40, 41, 42, 43, 47, 49
| Method 1 | Method 2 |
|---|---|
 |
 |
Example 2
Ordered Data Set: 7, 15, 36, 39, 40, 41| Method 1 | Method 2 |
|---|---|
 |
 |
Outliers
There are methods by which to check for outliers in the discipline of statisticsStatistics
Statistics is the study of the collection, organization, analysis, and interpretation of data. It deals with all aspects of this, including the planning of data collection in terms of the design of surveys and experiments....
and statistical analysis. As is the basic idea of descriptive statistics
Descriptive statistics
Descriptive statistics quantitatively describe the main features of a collection of data. Descriptive statistics are distinguished from inferential statistics , in that descriptive statistics aim to summarize a data set, rather than use the data to learn about the population that the data are...
, when encountered with an outlier
Outlier
In statistics, an outlier is an observation that is numerically distant from the rest of the data. Grubbs defined an outlier as: An outlying observation, or outlier, is one that appears to deviate markedly from other members of the sample in which it occurs....
, we have to explain this by further analysis of the cause or origin of the outlier. In cases of extreme observations, which are not an infrequent occurrence, the typical values must be analyzed. In the case of quartiles, the Interquartile Range
Interquartile range
In descriptive statistics, the interquartile range , also called the midspread or middle fifty, is a measure of statistical dispersion, being equal to the difference between the upper and lower quartiles...
(IQR) may be used to characterize the data when there may be extremeties that skew the data; the interquartile range
Interquartile range
In descriptive statistics, the interquartile range , also called the midspread or middle fifty, is a measure of statistical dispersion, being equal to the difference between the upper and lower quartiles...
is a relatively robust statistic (also sometimes called "resistance") compared to the range
Range (statistics)
In the descriptive statistics, the range is the length of the smallest interval which contains all the data. It is calculated by subtracting the smallest observation from the greatest and provides an indication of statistical dispersion.It is measured in the same units as the data...
and standard deviation
Standard deviation
Standard deviation is a widely used measure of variability or diversity used in statistics and probability theory. It shows how much variation or "dispersion" there is from the average...
. There is also a mathematical method to check for outliers and determining "fences", upper and lower limits from which to check for outliers.
After determining the first and third quartiles and the interquartile range as outlined above, then determining the fences using the following formula:
where Q1 and Q3 are the first and third quartiles, respectively. The Lower fence is the "lower limit" and the Upper fence is the "upper limit" of data, and any data lying outside this defined bounds can be considered an outlier. Anything below the Lower fence or above the Upper fence can be considered such a case. The fences provide a guideline by which to define an outlier
Outlier
In statistics, an outlier is an observation that is numerically distant from the rest of the data. Grubbs defined an outlier as: An outlying observation, or outlier, is one that appears to deviate markedly from other members of the sample in which it occurs....
, which may be defined in other ways. The fences define a "range" outside of which an outlier exists; a way to picture this is a boundary of a fence, outside of which are "outsiders" as opposed to outliers.
External links
- Quartile - from MathWorld Includes references and compares various methods to compute quartiles
- Quartiles - From MathForum.org
- Quartiles - An example how to calculate it