
Growth-share matrix
Encyclopedia
The BCG matrix is a chart that had been created by Bruce Henderson for the Boston Consulting Group
in 1968 to help corporation
s with analyzing their business
units or product lines. This helps the company allocate resources and is used as an analytical tool in brand marketing
, product management
, strategic management
, and portfolio analysis
. Analysis of market performance by firms using its principles has called its usefulness into question, and it has been removed from some major marketing textbooks.
s and growth rates.
As a particular industry matures and its growth slows, all business units become either cash cows or dogs. The natural cycle for most business units is that they start as question marks, then turn into stars. Eventually the market stops growing thus the business unit becomes a cash cow. At the end of the cycle the cash cow turns into a dog.
The overall goal of this ranking was to help corporate analysts decide which of their business units to fund, and how much; and which units to sell. Managers were supposed to gain perspective from this analysis that allowed them to plan with confidence to use money generated by the cash cows to fund the stars and, possibly, the question marks. As the BCG stated in 1970:
The need which prompted this idea was, indeed, that of managing cash-flow. It was reasoned that one of the main indicators of cash generation was relative market share, and one which pointed to cash usage was that of market growth rate.
Derivatives can also be used to create a 'product portfolio' analysis of services. So Information System services can be treated accordingly.
On the other hand, exactly what is a high relative share is a matter of some debate. The best evidence is that the most stable position (at least in Fast Moving Consumer Goods FMCG markets) is for the brand leader to have a share double that of the second brand, and triple that of the third. Brand leaders in this position tend to be very stable—and profitable; the Rule of 123.
The reason for choosing relative market share, rather than just profits, is that it carries more information than just cash flow. It shows where the brand is positioned against its main competitors, and indicates where it might be likely to go in the future. It can also show what type of marketing activities might be expected to be effective.
Where it can be applied, however, the market growth rate says more about the brand position than just its cash flow. It is a good indicator of that market's strength, of its future potential (of its 'maturity' in terms of the market life-cycle), and also of its attractiveness to future competitors. It can also be used in growth analysis.
The matrix ranks only market share and industry growth rate, and only implies actual profitability
, the purpose of any business. (It is certainly possible that a particular dog can be profitable without cash infusions required, and therefore should be retained and not sold.) The matrix also overlooks other elements of industry. With this or any other such analytical tool, ranking business units has a subjective element involving guesswork about the future, particularly with respect to growth rates. Unless the rankings are approached with rigor and scepticism, optimistic evaluations can lead to a dot com
mentality in which even the most dubious businesses are classified as "question marks" with good prospects; enthusiastic managers may claim that cash must be thrown at these businesses immediately in order to turn them into stars, before growth rates slow and it's too late. Poor definition of a business's market will lead to some dogs being misclassified as cash cows.
As originally practiced by the Boston Consulting Group, the matrix was undoubtedly a useful tool, in those few situations where it could be applied, for graphically illustrating cashflows. If used with this degree of sophistication its use would still be valid. However, later practitioners have tended to over-simplify its messages. In particular, the later application of the names (problem children, stars, cash cows and dogs) has tended to overshadow all else—and is often what most students, and practitioners, remember.
This is unfortunate, since such simplistic use contains at least two major problems:
'Minority applicability'. The cashflow techniques are only applicable to a very limited number of markets (where growth is relatively high, and a definite pattern of product life-cycles can be observed, such as that of ethical pharmaceuticals). In the majority of markets, use may give misleading results.
'Milking cash cows'. Perhaps the worst implication of the later developments is that the (brand leader) cash cows should be milked to fund new brands. This is not what research into the FMCG markets has shown to be the case. The brand leader's position is the one, above all, to be defended, not least since brands in this position will probably outperform any number of newly launched brands. Such brand leaders will, of course, generate large cash flows; but they should not be `milked' to such an extent that their position is jeopardized. In any case, the chance of the new brands achieving similar brand leadership may be slim—certainly far less than the popular perception of the Boston Matrix would imply.
Perhaps the most important danger is, however, that the apparent implication of its four-quadrant form is that there should be balance of products or services across all four quadrants; and that is, indeed, the main message that it is intended to convey. Thus, money must be diverted from `cash cows' to fund the `stars' of the future, since `cash cows' will inevitably decline to become `dogs'. There is an almost mesmeric inevitability about the whole process. It focuses attention, and funding, on to the `stars'. It presumes, and almost demands, that `cash cows' will turn into `dogs'.
The reality is that it is only the `cash cows' that are really important—all the other elements are supporting actors. It is a foolish vendor who diverts funds from a `cash cow' when these are needed to extend the life of that `product'. Although it is necessary to recognize a `dog' when it appears (at least before it bites you) it would be foolish in the extreme to create one in order to balance up the picture. The vendor, who has most of his (or her) products in the `cash cow' quadrant, should consider himself (or herself) fortunate indeed, and an excellent marketer, although he or she might also consider creating a few stars as an insurance policy against unexpected future developments and, perhaps, to add some extra growth. There is also a common misconception that 'dogs' are a waste of resources. In many markets 'dogs' can be considered loss-leaders that while not themselves profitable will lead to increased sales in other profitable areas.
, which the consultancy reportedly used itself though it is little known amongst the wider population. A different alternative that is getting more popularity by practitioners, is COPE analysis . COPE analysis, takes an even wider business approach than McKinsey's, and is based on hard or estimated data instead of subjective scores.
Boston Consulting Group
The Boston Consulting Group is a global management consulting firm with offices in 42 countries. It is recognized as one of the most prestigious management consulting firms in the world. It is one of only three companies to appear in the top 15 of Fortunes "Best Companies to Work For" report for...
in 1968 to help corporation
Corporation
A corporation is created under the laws of a state as a separate legal entity that has privileges and liabilities that are distinct from those of its members. There are many different forms of corporations, most of which are used to conduct business. Early corporations were established by charter...
s with analyzing their business
Business
A business is an organization engaged in the trade of goods, services, or both to consumers. Businesses are predominant in capitalist economies, where most of them are privately owned and administered to earn profit to increase the wealth of their owners. Businesses may also be not-for-profit...
units or product lines. This helps the company allocate resources and is used as an analytical tool in brand marketing
Brand
The American Marketing Association defines a brand as a "Name, term, design, symbol, or any other feature that identifies one seller's good or service as distinct from those of other sellers."...
, product management
Product management
Product management is an organizational lifecycle function within a company dealing with the planning, forecasting, or marketing of a product or products at all stages of the product lifecycle....
, strategic management
Strategic management
Strategic management is a field that deals with the major intended and emergent initiatives taken by general managers on behalf of owners, involving utilization of resources, to enhance the performance of firms in their external environments...
, and portfolio analysis
Portfolio (finance)
Portfolio is a financial term denoting a collection of investments held by an investment company, hedge fund, financial institution or individual.-Definition:The term portfolio refers to any collection of financial assets such as stocks, bonds and cash...
. Analysis of market performance by firms using its principles has called its usefulness into question, and it has been removed from some major marketing textbooks.
Chart
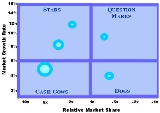
To use the chart, analysts plot a scatter graph to rank the business units (or products) on the basis of their relative market shareMarket share
Market share is the percentage of a market accounted for by a specific entity. In a survey of nearly 200 senior marketing managers, 67 percent responded that they found the "dollar market share" metric very useful, while 61% found "unit market share" very useful.Marketers need to be able to...
s and growth rates.
- Cash cowCash cowIn business, a cash cow is a product or a business unit that generates unusually high profit margins: so high that it is responsible for a large amount of a company's operating profit...
s are units with high market share in a slow-growing industry. These units typically generate cash in excess of the amount of cash needed to maintain the business. They are regarded as staid and boring, in a "mature" market, and every corporation would be thrilled to own as many as possible. They are to be "milked" continuously with as little investment as possible, since such investment would be wasted in an industry with low growth. - Dogs, or more charitably called pets, are units with low market share in a mature, slow-growing industry. These units typically "break even", generating barely enough cash to maintain the business's market share. Though owning a break-even unit provides the social benefit of providing jobs and possible synergies that assist other business units, from an accounting point of view such a unit is worthless, not generating cash for the company. They depress a profitable company's return on assets ratio, used by many investors to judge how well a company is being managed. Dogs, it is thought, should be sold off.
- Question marks (also known as problem child) are growing rapidly and thus consume large amounts of cash, but because they have low market shares they do not generate much cash. The result is a large net cash consumption. A question mark has the potential to gain market share and become a star, and eventually a cash cow when the market growth slows. If the question mark does not succeed in becoming the market leader, then after perhaps years of cash consumption it will degenerate into a dog when the market growth declines. Question marks must be analyzed carefully in order to determine whether they are worth the investment required to grow market share.
- Stars are units with a high market share in a fast-growing industry. The hope is that stars become the next cash cows. Sustaining the business unit's market leadership may require extra cash, but this is worthwhile if that's what it takes for the unit to remain a leader. When growth slows, stars become cash cows if they have been able to maintain their category leadership, or they move from brief stardom to dogdom.
As a particular industry matures and its growth slows, all business units become either cash cows or dogs. The natural cycle for most business units is that they start as question marks, then turn into stars. Eventually the market stops growing thus the business unit becomes a cash cow. At the end of the cycle the cash cow turns into a dog.
The overall goal of this ranking was to help corporate analysts decide which of their business units to fund, and how much; and which units to sell. Managers were supposed to gain perspective from this analysis that allowed them to plan with confidence to use money generated by the cash cows to fund the stars and, possibly, the question marks. As the BCG stated in 1970:
Only a diversified company with a balanced portfolio can use its strengths to truly capitalize on its growth opportunities. The balanced portfolio has:
- stars whose high share and high growth assure the future;
- cash cows that supply funds for that future growth; and
- question marks to be converted into stars with the added funds.
Practical use of the BCG Matrix
For each product or service, the 'area' of the circle represents the value of its sales. The BCG Matrix thus offers a very useful 'map' of the organization's product (or service) strengths and weaknesses, at least in terms of current profitability, as well as the likely cashflows.The need which prompted this idea was, indeed, that of managing cash-flow. It was reasoned that one of the main indicators of cash generation was relative market share, and one which pointed to cash usage was that of market growth rate.
Derivatives can also be used to create a 'product portfolio' analysis of services. So Information System services can be treated accordingly.
Relative market share
This indicates likely cash generation, because the higher the share the more cash will be generated. As a result of 'economies of scale' (a basic assumption of the BCG Matrix), it is assumed that these earnings will grow faster the higher the share. The exact measure is the brand's share relative to its largest competitor. Thus, if the brand had a share of 20 percent, and the largest competitor had the same, the ratio would be 1:1. If the largest competitor had a share of 60 percent; however, the ratio would be 1:3, implying that the organization's brand was in a relatively weak position. If the largest competitor only had a share of 5 percent, the ratio would be 4:1, implying that the brand owned was in a relatively strong position, which might be reflected in profits and cash flows. If this technique is used in practice, this scale is logarithmic, not linear.On the other hand, exactly what is a high relative share is a matter of some debate. The best evidence is that the most stable position (at least in Fast Moving Consumer Goods FMCG markets) is for the brand leader to have a share double that of the second brand, and triple that of the third. Brand leaders in this position tend to be very stable—and profitable; the Rule of 123.
The reason for choosing relative market share, rather than just profits, is that it carries more information than just cash flow. It shows where the brand is positioned against its main competitors, and indicates where it might be likely to go in the future. It can also show what type of marketing activities might be expected to be effective.
Market growth rate
Rapidly growing in rapidly growing markets, are what organizations strive for; but, as we have seen, the penalty is that they are usually net cash users - they require investment. The reason for this is often because the growth is being 'bought' by the high investment, in the reasonable expectation that a high market share will eventually turn into a sound investment in future profits. The theory behind the matrix assumes, therefore, that a higher growth rate is indicative of accompanying demands on investment. The cut-off point is usually chosen as 10 per cent per annum. Determining this cut-off point, the rate above which the growth is deemed to be significant (and likely to lead to extra demands on cash) is a critical requirement of the technique; and one that, again, makes the use of the BCG Matrix problematical in some product areas. What is more, the evidence, from FMCG markets at least, is that the most typical pattern is of very low growth, less than 1 per cent per annum. This is outside the range normally considered in BCG Matrix work, which may make application of this form of analysis unworkable in many markets.Where it can be applied, however, the market growth rate says more about the brand position than just its cash flow. It is a good indicator of that market's strength, of its future potential (of its 'maturity' in terms of the market life-cycle), and also of its attractiveness to future competitors. It can also be used in growth analysis.
Critical evaluation
While theoretically useful, and widely used, several academic studies have called into question whether using the BCG matrix actually helps businesses succeed, and the model has since been removed from some major marketing textbooks. One study (Slater and Zwirlein, 1992) which looked at 129 firms found that those who follow portfolio planning models like the BCG matrix had lower shareholder returns.The matrix ranks only market share and industry growth rate, and only implies actual profitability
Profit (economics)
In economics, the term profit has two related but distinct meanings. Normal profit represents the total opportunity costs of a venture to an entrepreneur or investor, whilst economic profit In economics, the term profit has two related but distinct meanings. Normal profit represents the total...
, the purpose of any business. (It is certainly possible that a particular dog can be profitable without cash infusions required, and therefore should be retained and not sold.) The matrix also overlooks other elements of industry. With this or any other such analytical tool, ranking business units has a subjective element involving guesswork about the future, particularly with respect to growth rates. Unless the rankings are approached with rigor and scepticism, optimistic evaluations can lead to a dot com
Dot-com bubble
The dot-com bubble was a speculative bubble covering roughly 1995–2000 during which stock markets in industrialized nations saw their equity value rise rapidly from growth in the more...
mentality in which even the most dubious businesses are classified as "question marks" with good prospects; enthusiastic managers may claim that cash must be thrown at these businesses immediately in order to turn them into stars, before growth rates slow and it's too late. Poor definition of a business's market will lead to some dogs being misclassified as cash cows.
As originally practiced by the Boston Consulting Group, the matrix was undoubtedly a useful tool, in those few situations where it could be applied, for graphically illustrating cashflows. If used with this degree of sophistication its use would still be valid. However, later practitioners have tended to over-simplify its messages. In particular, the later application of the names (problem children, stars, cash cows and dogs) has tended to overshadow all else—and is often what most students, and practitioners, remember.
This is unfortunate, since such simplistic use contains at least two major problems:
'Minority applicability'. The cashflow techniques are only applicable to a very limited number of markets (where growth is relatively high, and a definite pattern of product life-cycles can be observed, such as that of ethical pharmaceuticals). In the majority of markets, use may give misleading results.
'Milking cash cows'. Perhaps the worst implication of the later developments is that the (brand leader) cash cows should be milked to fund new brands. This is not what research into the FMCG markets has shown to be the case. The brand leader's position is the one, above all, to be defended, not least since brands in this position will probably outperform any number of newly launched brands. Such brand leaders will, of course, generate large cash flows; but they should not be `milked' to such an extent that their position is jeopardized. In any case, the chance of the new brands achieving similar brand leadership may be slim—certainly far less than the popular perception of the Boston Matrix would imply.
Perhaps the most important danger is, however, that the apparent implication of its four-quadrant form is that there should be balance of products or services across all four quadrants; and that is, indeed, the main message that it is intended to convey. Thus, money must be diverted from `cash cows' to fund the `stars' of the future, since `cash cows' will inevitably decline to become `dogs'. There is an almost mesmeric inevitability about the whole process. It focuses attention, and funding, on to the `stars'. It presumes, and almost demands, that `cash cows' will turn into `dogs'.
The reality is that it is only the `cash cows' that are really important—all the other elements are supporting actors. It is a foolish vendor who diverts funds from a `cash cow' when these are needed to extend the life of that `product'. Although it is necessary to recognize a `dog' when it appears (at least before it bites you) it would be foolish in the extreme to create one in order to balance up the picture. The vendor, who has most of his (or her) products in the `cash cow' quadrant, should consider himself (or herself) fortunate indeed, and an excellent marketer, although he or she might also consider creating a few stars as an insurance policy against unexpected future developments and, perhaps, to add some extra growth. There is also a common misconception that 'dogs' are a waste of resources. In many markets 'dogs' can be considered loss-leaders that while not themselves profitable will lead to increased sales in other profitable areas.
Alternatives
As with most marketing techniques, there are a number of alternative offerings vying with the BCG Matrix although this appears to be the most widely used (or at least most widely taught—and then probably 'not' used). The next most widely reported technique is that developed by McKinsey and General Electric, which is a three-cell by three-cell matrix—using the dimensions of `industry attractiveness' and `business strengths'. This approaches some of the same issues as the BCG Matrix but from a different direction and in a more complex way (which may be why it is used less, or is at least less widely taught). A more practical approach is that of the Boston Consulting Group's Advantage MatrixBoston Consulting Group's Advantage Matrix
To understand the Boston Matrix, you need to understand how market share and market growth interrelate.Market share is the percentage of the total market that is being serviced by your company, measured either in revenue terms or unit volume terms...
, which the consultancy reportedly used itself though it is little known amongst the wider population. A different alternative that is getting more popularity by practitioners, is COPE analysis . COPE analysis, takes an even wider business approach than McKinsey's, and is based on hard or estimated data instead of subjective scores.