
Factor graph
Encyclopedia
In probability theory
and its applications, a factor graph is a particular type of graphical model
, with applications in Bayesian inference
, that enables efficient computation of marginal distribution
s through the sum-product algorithm. One of the important success stories of factor graphs and the sum-product algorithm is the decoding
of capacity-approaching error-correcting codes, such as LDPC and turbo codes.
A factor graph is an example of a hypergraph
, in that an arrow (i.e., a factor node) can connect more than one (normal) node
representing the factorization
of a function. Given a factorization of a function ,
,
where , the corresponding factor graph
  consists of variable vertices
 , factor vertices
 , and edges
  . The edges depend on the factorization as follows: there is an undirected edge between factor vertex
  and variable vertex
  when
when  . The function is tacitly assumed to be real-valued:
  .
.
Factor graphs can be combined with message passing algorithms to efficiently compute certain characteristics of the function , such as the marginal distribution
s.
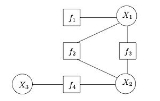
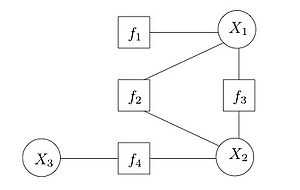 Consider a function that factorizes as follows:
 ,
,
with a corresponding factor graph shown on the right. Observe that the factor graph has a cycle
. If we merge into a single factor, the resulting factor graph will be a tree
. This is an important distinction, as message passing algorithms are usually exact for trees, but only approximate for graphs with cycles.
 is defined as
where the notation means that the summation goes over all the variables, except
  . The messages of the sum-product algorithm are conceptually computed in the vertices and passed along the edges. A message from or to a variable vertex is always a function
of that particular variable. For instance, when a variable is binary, the messages
over the edges incident to the corresponding vertex can be represented as vectors of length 2: the first entry is the message evaluated in 0, the second entry is the message evaluated in 1. When a variable belongs to the field of real numbers, messages can be arbitrary functions, and special care needs to be taken in their representation.
In practice, the sum-product algorithm is used for statistical inference
, whereby is a joint distribution
or a joint likelihood function
, and the factorization depends on the conditional independencies
among the variables.
The Hammersley–Clifford theorem
shows that other probabilistic models such as Markov network
s and Bayesian network
s can be represented as factor graphs; the latter representation is frequently used when performing inference over such networks using belief propagation
. On the other hand, Bayesian networks are more naturally suited for generative model
s, as they can directly represent the causalities of the model.
Probability theory
Probability theory is the branch of mathematics concerned with analysis of random phenomena. The central objects of probability theory are random variables, stochastic processes, and events: mathematical abstractions of non-deterministic events or measured quantities that may either be single...
and its applications, a factor graph is a particular type of graphical model
Graphical model
A graphical model is a probabilistic model for which a graph denotes the conditional independence structure between random variables. They are commonly used in probability theory, statistics—particularly Bayesian statistics—and machine learning....
, with applications in Bayesian inference
Bayesian inference
In statistics, Bayesian inference is a method of statistical inference. It is often used in science and engineering to determine model parameters, make predictions about unknown variables, and to perform model selection...
, that enables efficient computation of marginal distribution
Marginal distribution
In probability theory and statistics, the marginal distribution of a subset of a collection of random variables is the probability distribution of the variables contained in the subset. The term marginal variable is used to refer to those variables in the subset of variables being retained...
s through the sum-product algorithm. One of the important success stories of factor graphs and the sum-product algorithm is the decoding
Code
A code is a rule for converting a piece of information into another form or representation , not necessarily of the same type....
of capacity-approaching error-correcting codes, such as LDPC and turbo codes.
A factor graph is an example of a hypergraph
Hypergraph
In mathematics, a hypergraph is a generalization of a graph, where an edge can connect any number of vertices. Formally, a hypergraph H is a pair H = where X is a set of elements, called nodes or vertices, and E is a set of non-empty subsets of X called hyperedges or links...
, in that an arrow (i.e., a factor node) can connect more than one (normal) node
Definition
A factor graph is a bipartite graphBipartite graph
In the mathematical field of graph theory, a bipartite graph is a graph whose vertices can be divided into two disjoint sets U and V such that every edge connects a vertex in U to one in V; that is, U and V are independent sets...
representing the factorization
Factorization
In mathematics, factorization or factoring is the decomposition of an object into a product of other objects, or factors, which when multiplied together give the original...
of a function. Given a factorization of a function
,where
, the corresponding factor graph consists of variable vertices, factor verticesVertex (graph theory)
In graph theory, a vertex or node is the fundamental unit out of which graphs are formed: an undirected graph consists of a set of vertices and a set of edges , while a directed graph consists of a set of vertices and a set of arcs...
, and edges . The edges depend on the factorization as follows: there is an undirected edge between factor vertex and variable vertex when . The function is tacitly assumed to be real-valued: .Factor graphs can be combined with message passing algorithms to efficiently compute certain characteristics of the function
, such as the marginal distributionMarginal distribution
In probability theory and statistics, the marginal distribution of a subset of a collection of random variables is the probability distribution of the variables contained in the subset. The term marginal variable is used to refer to those variables in the subset of variables being retained...
s.
Examples
,with a corresponding factor graph shown on the right. Observe that the factor graph has a cycle
Cycle (graph theory)
In graph theory, the term cycle may refer to a closed path. If repeated vertices are allowed, it is more often called a closed walk. If the path is a simple path, with no repeated vertices or edges other than the starting and ending vertices, it may also be called a simple cycle, circuit, circle,...
. If we merge
into a single factor, the resulting factor graph will be a treeTree (graph theory)
In mathematics, more specifically graph theory, a tree is an undirected graph in which any two vertices are connected by exactly one simple path. In other words, any connected graph without cycles is a tree...
. This is an important distinction, as message passing algorithms are usually exact for trees, but only approximate for graphs with cycles.
Message passing on factor graphs
A popular message passing algorithm on factor graphs is the sum-product algorithm, which efficiently computes all the marginals of the individual variables of the function. In particular, the marginal of variable is defined aswhere the notation
means that the summation goes over all the variables, except . The messages of the sum-product algorithm are conceptually computed in the vertices and passed along the edges. A message from or to a variable vertex is always a functionFunction (mathematics)
In mathematics, a function associates one quantity, the argument of the function, also known as the input, with another quantity, the value of the function, also known as the output. A function assigns exactly one output to each input. The argument and the value may be real numbers, but they can...
of that particular variable. For instance, when a variable is binary, the messages
over the edges incident to the corresponding vertex can be represented as vectors of length 2: the first entry is the message evaluated in 0, the second entry is the message evaluated in 1. When a variable belongs to the field of real numbers, messages can be arbitrary functions, and special care needs to be taken in their representation.
In practice, the sum-product algorithm is used for statistical inference
Statistical inference
In statistics, statistical inference is the process of drawing conclusions from data that are subject to random variation, for example, observational errors or sampling variation...
, whereby
is a joint distributionProbability distribution
In probability theory, a probability mass, probability density, or probability distribution is a function that describes the probability of a random variable taking certain values....
or a joint likelihood function
Likelihood function
In statistics, a likelihood function is a function of the parameters of a statistical model, defined as follows: the likelihood of a set of parameter values given some observed outcomes is equal to the probability of those observed outcomes given those parameter values...
, and the factorization depends on the conditional independencies
Conditional independence
In probability theory, two events R and B are conditionally independent given a third event Y precisely if the occurrence or non-occurrence of R and the occurrence or non-occurrence of B are independent events in their conditional probability distribution given Y...
among the variables.
The Hammersley–Clifford theorem
Hammersley–Clifford theorem
The Hammersley–Clifford theorem is a result in probability theory, mathematical statistics and statistical mechanics, that gives necessary and sufficient conditions under which a positive probability distribution can be represented as a Markov network...
shows that other probabilistic models such as Markov network
Markov network
A Markov random field, Markov network or undirected graphical model is a set of variables having a Markov property described by an undirected graph. A Markov random field is similar to a Bayesian network in its representation of dependencies...
s and Bayesian network
Bayesian network
A Bayesian network, Bayes network, belief network or directed acyclic graphical model is a probabilistic graphical model that represents a set of random variables and their conditional dependencies via a directed acyclic graph . For example, a Bayesian network could represent the probabilistic...
s can be represented as factor graphs; the latter representation is frequently used when performing inference over such networks using belief propagation
Belief propagation
Belief propagation is a message passing algorithm for performing inference on graphical models, such as Bayesian networks and Markov random fields. It calculates the marginal distribution for each unobserved node, conditional on any observed nodes...
. On the other hand, Bayesian networks are more naturally suited for generative model
Generative model
In probability and statistics, a generative model is a model for randomly generating observable data, typically given some hidden parameters. It specifies a joint probability distribution over observation and label sequences...
s, as they can directly represent the causalities of the model.
See also
- Belief propagationBelief propagationBelief propagation is a message passing algorithm for performing inference on graphical models, such as Bayesian networks and Markov random fields. It calculates the marginal distribution for each unobserved node, conditional on any observed nodes...
- Bayesian inferenceBayesian inferenceIn statistics, Bayesian inference is a method of statistical inference. It is often used in science and engineering to determine model parameters, make predictions about unknown variables, and to perform model selection...
- Conditional probabilityConditional probabilityIn probability theory, the "conditional probability of A given B" is the probability of A if B is known to occur. It is commonly notated P, and sometimes P_B. P can be visualised as the probability of event A when the sample space is restricted to event B...
- Markov networkMarkov networkA Markov random field, Markov network or undirected graphical model is a set of variables having a Markov property described by an undirected graph. A Markov random field is similar to a Bayesian network in its representation of dependencies...
- Bayesian networkBayesian networkA Bayesian network, Bayes network, belief network or directed acyclic graphical model is a probabilistic graphical model that represents a set of random variables and their conditional dependencies via a directed acyclic graph . For example, a Bayesian network could represent the probabilistic...
- Hammersley–Clifford theoremHammersley–Clifford theoremThe Hammersley–Clifford theorem is a result in probability theory, mathematical statistics and statistical mechanics, that gives necessary and sufficient conditions under which a positive probability distribution can be represented as a Markov network...
External links
- A tutorial-style dissertation by Volker Koch
- An Introduction to Factor Graphs by Hans-Andrea Loeliger, IEEE Signal Processing Magazine, January 2004, pp. 28–41.