
Supply and demand
Overview
Market
A market is one of many varieties of systems, institutions, procedures, social relations and infrastructures whereby parties engage in exchange. While parties may exchange goods and services by barter, most markets rely on sellers offering their goods or services in exchange for money from buyers...
. It concludes that in a competitive market
Perfect competition
In economic theory, perfect competition describes markets such that no participants are large enough to have the market power to set the price of a homogeneous product. Because the conditions for perfect competition are strict, there are few if any perfectly competitive markets...
, the unit price
Unit price
Average prices represent, quite simply, total sales revenue divided by total units sold. Many products, however, are sold in multiple variants, such as bottle sizes. In these cases, managers face a challenge: they must determine “comparable” units. Average prices can be calculated by weighting...
for a particular good will vary until it settles at a point where the quantity demanded by consumers (at current price) will equal the quantity supplied by producers (at current price), resulting in an economic equilibrium
Economic equilibrium
In economics, economic equilibrium is a state of the world where economic forces are balanced and in the absence of external influences the values of economic variables will not change. It is the point at which quantity demanded and quantity supplied are equal...
of price and quantity.
The four basic laws of supply and demand are:
- If demand increases and supply remains unchanged, then it leads to higher equilibrium price and quantity.
- If demand decreases and supply remains unchanged, then it leads to lower equilibrium price and quantity.
- If supply increases and demand remains unchanged, then it leads to lower equilibrium price and higher quantity.
- If supply decreases and demand remains unchanged, then it leads to higher price and lower quantity.
Although it is normal to regard the quantity demanded and the quantity supplied as functions
Function (mathematics)
In mathematics, a function associates one quantity, the argument of the function, also known as the input, with another quantity, the value of the function, also known as the output. A function assigns exactly one output to each input. The argument and the value may be real numbers, but they can...
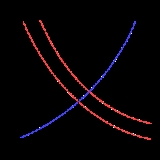
of the price of the good, the standard graphical representation, usually attributed to Alfred Marshall
Alfred Marshall
Alfred Marshall was an Englishman and one of the most influential economists of his time. His book, Principles of Economics , was the dominant economic textbook in England for many years...
, has price on the vertical axis and quantity on the horizontal axis, the opposite of the standard convention for the representation of a mathematical function.
Since determinants of supply and demand other than the price of the good in question are not explicitly represented in the supply-demand diagram, changes in the values of these variables are represented by moving the supply and demand curves (often described as "shifts" in the curves).
Unanswered Questions
Discussions