
Stochastic oscillator
Encyclopedia
In technical analysis
of securities
trading, the stochastic oscillator
is a momentum
indicator that uses support and resistance levels. Dr. George Lane
promoted this indicator in the 1950s. The term stochastic
refers to the location of a current price in relation to its price range over a period of time. This method attempts to predict price turning points by comparing the closing price of a security to its price range.
The indicator is defined as follows:

 The calculation above finds the range between an asset’s high and low price during a given period of time. The current securities price is then expressed as a percentage of this range with 0% indicating the bottom of the range and 100% indicating the upper limits of the range over the time period covered. The idea behind this indicator is that prices tend to close near the extremes of the recent range before turning points. The Stochastic oscillator is calculated:
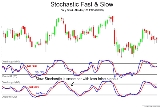
A 3-line Stochastics will give an anticipatory signal in %K, a signal in the turnaround of %D at or before a bottom, and a confirmation of the turnaround in %D-Slow. Typical values for N are 5, 9, or 14 periods. Smoothing the indicator over 3 periods is standard.
Dr. George Lane
, a financial analyst, is one of the first to publish on the use of stochastic oscillators to forecast prices. According to Lane, the Stochastics indicator is to be used with cycles
, Elliot Wave Theory and Fibonacci retracement
for timing. In low margin, calendar futures spreads
, one might use Wilders parabolic
as a trailing stop after a stochastics entry. A centerpiece of his teaching is the divergence and convergence of trendlines drawn on stochastics, as diverging/converging to trendlines drawn on price cycles. Stochastics predicts tops
and bottoms.
is high, an exponential moving average of the %D indicator may be taken, which tends to smooth out rapid fluctuations in price.
Stochastics attempts to predict turning points by comparing the closing price of a security to its price range. Prices tend to close near the extremes of the recent range just before turning points. In the case of an uptrend, prices tend to make higher highs, and the settlement price usually tends to be in the upper end of that time period's trading range. When the momentum starts to slow, the settlement prices will start to retreat from the upper boundaries of the range, causing the stochastic indicator to turn down at or before the final price high.
 An alert or set-up is present when the %D line is in an extreme area and diverging from the price action. The actual signal takes place when the faster % K line crosses the % D line.
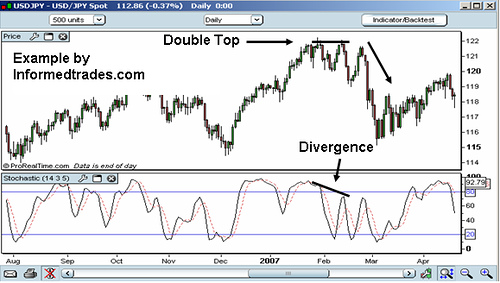
Divergence-convergence is an indication that the momentum in the market is waning and a reversal may be in the making. The chart below illustrates an example of where a divergence in stochastics relative to price forecasts a reversal in the price's direction.
An event known as "stochastic pop" occurs when prices break out break out and keep going. This is interpreted as a signal to increase the current position, or liquidate if the direction is against the current position.
Technical analysis
In finance, technical analysis is security analysis discipline for forecasting the direction of prices through the study of past market data, primarily price and volume. Behavioral economics and quantitative analysis incorporate technical analysis, which being an aspect of active management stands...
of securities
Security (finance)
A security is generally a fungible, negotiable financial instrument representing financial value. Securities are broadly categorized into:* debt securities ,* equity securities, e.g., common stocks; and,...
trading, the stochastic oscillator
Oscillator (technical analysis)
An oscillator is a technical analysis indicator that varies over time within a band . Oscillators are used to discover short-term overbought or oversold conditions....
is a momentum
Momentum (technical analysis)
Momentum and rate of change are simple technical analysis indicators showing the difference between today's closing price and the close N days ago. Momentum is the absolute difference in stock, commodity:...
indicator that uses support and resistance levels. Dr. George Lane
George Lane (technical analysis)
George Lane M.D. was a Doctor of Medicine, securities trader, author, educator, speaker and technical analyst. He developed and popularized the stochastic oscillator, which is one of the core indicators used today among technical analysts. Lane was also President of Investment Educators Inc...
promoted this indicator in the 1950s. The term stochastic
Stochastic
Stochastic refers to systems whose behaviour is intrinsically non-deterministic. A stochastic process is one whose behavior is non-deterministic, in that a system's subsequent state is determined both by the process's predictable actions and by a random element. However, according to M. Kac and E...
refers to the location of a current price in relation to its price range over a period of time. This method attempts to predict price turning points by comparing the closing price of a security to its price range.
The indicator is defined as follows:
- where H and L are respectively the highest and the lowest price over the last
 periods, and
- In working with %D it is important to remember that there is only one valid signal—a divergence between %D and the analyzed security.
Definition
-
- Where
 is the last closing price
 is the lowest price over the last N periods
 is the highest price over the last N periods
 is a 3-period exponential moving average of %K.
 is a 3-period exponential moving average of %D.
- Where
A 3-line Stochastics will give an anticipatory signal in %K, a signal in the turnaround of %D at or before a bottom, and a confirmation of the turnaround in %D-Slow. Typical values for N are 5, 9, or 14 periods. Smoothing the indicator over 3 periods is standard.
Dr. George Lane
George Lane (technical analysis)
George Lane M.D. was a Doctor of Medicine, securities trader, author, educator, speaker and technical analyst. He developed and popularized the stochastic oscillator, which is one of the core indicators used today among technical analysts. Lane was also President of Investment Educators Inc...
, a financial analyst, is one of the first to publish on the use of stochastic oscillators to forecast prices. According to Lane, the Stochastics indicator is to be used with cycles
Business cycle
The term business cycle refers to economy-wide fluctuations in production or economic activity over several months or years...
, Elliot Wave Theory and Fibonacci retracement
Fibonacci retracement
In finance, Fibonacci retracements is a method of technical analysis for determining support and resistance levels. They are named after their use of the Fibonacci sequence...
for timing. In low margin, calendar futures spreads
Spread trade
In finance, a spread trade is the simultaneous purchase of one security and sale of a related security, called legs, as a unit. Spread trades are usually executed with options or futures contracts as the legs, but other securities are sometimes used...
, one might use Wilders parabolic
Parabolic SAR
In the field of technical analysis, Parabolic SAR is a method devised by J. Welles Wilder, Jr., to find trends in market prices or securities...
as a trailing stop after a stochastics entry. A centerpiece of his teaching is the divergence and convergence of trendlines drawn on stochastics, as diverging/converging to trendlines drawn on price cycles. Stochastics predicts tops
Tops
Tops may refer to:* Jan Tops , a Dutch equestrian* Tops Markets LLC, an American supermarket chain* Tops Supermarket, a Thai supermarket chain formerly part of Tops Markets LLC* Tops , Rolling Stones song on their album Tattoo You...
and bottoms.
Interpretation
The signal to act is when there is a divergence-convergence, in an extreme area, with a crossover on the right hand side, of a cycle bottom. As plain crossovers can occur frequently, one typically waits for crossovers occurring together with an extreme pullback, after a peak or trough in the %D line. If price volatilityVolatility (finance)
In finance, volatility is a measure for variation of price of a financial instrument over time. Historic volatility is derived from time series of past market prices...
is high, an exponential moving average of the %D indicator may be taken, which tends to smooth out rapid fluctuations in price.
Stochastics attempts to predict turning points by comparing the closing price of a security to its price range. Prices tend to close near the extremes of the recent range just before turning points. In the case of an uptrend, prices tend to make higher highs, and the settlement price usually tends to be in the upper end of that time period's trading range. When the momentum starts to slow, the settlement prices will start to retreat from the upper boundaries of the range, causing the stochastic indicator to turn down at or before the final price high.
Divergence-convergence is an indication that the momentum in the market is waning and a reversal may be in the making. The chart below illustrates an example of where a divergence in stochastics relative to price forecasts a reversal in the price's direction.
An event known as "stochastic pop" occurs when prices break out break out and keep going. This is interpreted as a signal to increase the current position, or liquidate if the direction is against the current position.
See also
- Williams %R – Equivalent of %K, mirrored around the 0%-axis
- Detrended price oscillatorDetrended price oscillatorMACDThe detrended price oscillator is an indicator in technical analysis that attempts to eliminate the long-term trends in prices...