
Technical analysis
Overview
Finance
"Finance" is often defined simply as the management of money or “funds” management Modern finance, however, is a family of business activity that includes the origination, marketing, and management of cash and money surrogates through a variety of capital accounts, instruments, and markets created...
, technical analysis is security analysis
Security analysis
Security analysis is the analysis of tradeable financial instruments called securities. These can be classified into debt securities, equities, or some hybrid of the two. More broadly, futures contracts and tradeable credit derivatives are sometimes included...
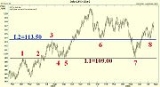
discipline for forecasting the direction of prices through the study of past market data, primarily price and volume. Behavioral economics and quantitative analysis incorporate technical analysis, which being an aspect of active management
Active management
Active management refers to a portfolio management strategy where the manager makes specific investments with the goal of outperforming an investment benchmark index...
stands in contradiction to much of modern portfolio theory
Modern portfolio theory
Modern portfolio theory is a theory of investment which attempts to maximize portfolio expected return for a given amount of portfolio risk, or equivalently minimize risk for a given level of expected return, by carefully choosing the proportions of various assets...
. The efficacy of both technical and fundamental analysis
Fundamental analysis
Fundamental analysis of a business involves analyzing its financial statements and health, its management and competitive advantages, and its competitors and markets. When applied to futures and forex, it focuses on the overall state of the economy, interest rates, production, earnings, and...
is disputed by efficient-market hypothesis which states that stock market prices are essentially unpredictable.
The principles of technical analysis are derived from hundreds of years of financial market
Financial market
In economics, a financial market is a mechanism that allows people and entities to buy and sell financial securities , commodities , and other fungible items of value at low transaction costs and at prices that reflect supply and demand.Both general markets and...
data.
Unanswered Questions
Discussions