

Pure tone audiometry
Encyclopedia
Pure tone audiometry
(PTA) is the key hearing test
used to identify hearing
threshold levels of an individual, enabling determination of the degree, type and configuration of a hearing loss. Thus, providing the basis for diagnosis and management. PTA is a subjective, behavioural measurement of hearing threshold, as it relies on patient response to pure tone
stimuli. Therefore, PTA is used on adults and children old enough to cooperate with the test procedure. As with most clinical tests, calibration of the test environment, the equipment and the stimuli to ISO standards is needed before testing proceeds. PTA only measures thresholds, rather than other aspects of hearing such as sound localization
. However, there are benefits of using PTA over other forms of hearing test, such as click auditory brainstem response
. PTA provides ear specific thresholds, and uses frequency
specific pure tones to give place specific responses, so that the configuration of a hearing loss can be identified. As PTA uses both air and bone conduction
audiometry, the type of loss can also be identified via the air-bone gap. Although PTA has many clinical benefits, it is not perfect at identifying all losses, such as ‘dead regions’. This raises the question of whether or not audiogram
s accurately predict someone’s perceived degree of disability.
within the sound field. Therefore, it may be necessary to use other stimuli, such as warble tones in sound field testing. There are variations of conventional audiometry testing that are designed specifically for young children and infants, such as visual reinforcement audiometry and play audiometry.
Conventional audiometry tests frequencies between 250 hertz
(Hz) and 8 kHz, whereas high frequency audiometry tests in the region of 8 kHz-20 kHz. Some environmental factors, such as ototoxic medication and noise exposure, appear to be more detrimental to high frequency sensitivity than to that of mid or low frequencies. Therefore, high frequency audiometry is an effective method of monitoring losses that are suspected to have been caused by these factors. It is also effective in detecting the auditory sensitivity changes that occur with aging.
When sound is applied to one ear the contralateral cochlea can also be stimulated to varying degrees, via vibrations through the bone of the skull. When the stimuli presented to the test ear stimulates the cochlea
of the non-test ear, this is known as cross hearing. Whenever it is suspected that cross hearing has occurred it is best to use masking. This is done by temporarily elevating the threshold of the non-test ear, by presenting a masking noise at a predetermined level. This prevents the non-test ear from detecting the test signal presented to the test ear. The threshold of the test ear is measured at the same time as presenting the masking noise to the non-test ear. Thus, thresholds obtained when masking has been applied, provide an accurate representation of the true hearing threshold level of the test ear.
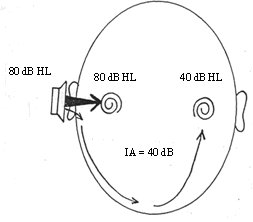
A reduction or loss of energy occurs with cross hearing, which is referred to as interaural attenuation (IA) or transcranial transmission loss. IA varies with transducer type. It varies from 40 dB to 80 dB with supra-aural headphones. However, with insert earphones it is in the region of 55 dB. The use of insert earphones reduces the need for masking, due to the greater IA which occurs when they are used (See Figure 1).
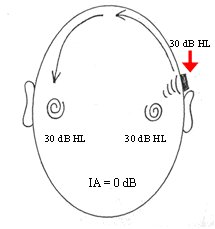
Air conduction results in isolation, give little information regarding the type of hearing loss. When the thresholds obtained via air conduction are examined alongside those achieved with bone conduction, the configuration of the hearing loss can be determined. However, with bone conduction (performed by placing a vibrator on the mastoid bone behind the ear), both cochleas are stimulated. IA for bone conduction ranges from 0-20 dB (See Figure 2).Therefore, conventional audiometry is ear specific, with regards to both air and bone conduction audiometry, when masking is applied.
 Outer hair cells (OHCs) contribute to the structure of the Organ of Corti
, which is situated between the basilar membrane
and the tectorial membrane
within the cochlea (See Figure 3). The tunnel of corti, which runs through the Organ of Corti, divides the OHCs and the inner hair cells (IHCs). OHCs are connected to the reticular laminar and the Deiters’ cells. There are roughly twelve thousand OHCs in each human ear, and these are arranged in up to five rows. Each OHC has small tufts of hairs on their upper surface known as stereocilia
, and these are also arranged into rows which are graded in height. There are approximately 140 stereocilia on each OHC.
The fundamental role of the OHCs and the IHCs is to function as sensory receptors. The main function of the IHCs is to transmit sound information via afferent
neurons. They do this by transducing mechanical movements or signals into neural activity. When stimulated, the stereocilia on the IHCs move, causing a flow of electrical current to pass through the hair cells. This electrical current creates action potentials within the connected afferent neurons.
OHCs are different in that they actually contribute to the active mechanism of the cochlea. They do this by receiving mechanical signals or vibrations along the basilar membrane, and transducing them into electrochemical signals. The stereocilia found on OHCs are in contact with the tectorial membrane. Therefore, when the basilar membrane moves due to vibrations, the stereocilia bend. The direction in which they bend, dictates the firing rate of the auditory neurons connected to the OHCs.
The bending of the stereocilia towards the basal body
of the OHC causes excitation of the hair cell. Thus, an increase in firing rate of the auditory neurons connected to the hair cell occurs. On the other hand, the bending of the stereocilia away from the basal body of the OHC causes inhibition of the hair cell. Thus, a decrease in firing rate of the auditory neurons connected to the hair cell occurs. OHCs are unique in that they are able to contract and expand (electromotility). Therefore, in response to the electrical stimulations provided by the efferent nerve supply, they can alter in length, shape and stiffness. These changes influence the response of the basilar membrane to sound. It is therefore clear that the OHCs play a major role in the active processes of the cochlea. The main function of the active mechanism is to finely tune the basilar membrane, and provide it with a high sensitivity to quiet sounds. The active mechanism is dependent on the cochlea being in good physiological condition. However, the cochlea is very susceptible to damage.
(SNHL), and is most prevalent in the elderly. In this situation, the hearing loss is acquired through the ageing process, and is referred to as presbyacusis. SNHL is most commonly caused by damage to the OHCs and the IHCs. There are two methods by which they might become damaged. Firstly, the entire hair cell might die. Secondly, the stereocilia might become distorted or destroyed. Damage to the cochlea can occur in several ways, for example by viral infection, exposure to ototoxic chemicals, and intense noise exposure. Damage to the OHCs results in either a less effective active mechanism, or it may not function at all. OHCs contribute to providing a high sensitivity to quiet sounds at a specific range of frequencies (approximately 2-4 kHz). Thus, damage to the OHCs results in the reduction of sensitivity of the basilar membrane to weak sounds. Amplification to these sounds is therefore required, in order for the basilar membrane to respond efficiently. IHCs are less susceptible to damage in comparison to the OHCs. However, if they become damaged, this will result in an overall loss of sensitivity.
 The traveling wave along the basilar membrane peaks at different places along it, depending on whether the sound is low or high frequency. Due to the mass and stiffness
of the basilar membrane, low frequency waves peak in the apex, while high frequency sounds peak in the basal end of the cochlea. Therefore, each position along the basilar membrane is finely tuned to a particular frequency. These specifically tuned frequencies are referred to as characteristic frequencies (CF).
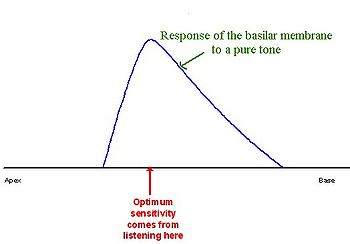
If a sound entering the ear is displaced from the characteristic frequency, then the strength of response from the basilar membrane will progressively lessen. The fine tuning of the basilar membrane is created by the input of two separate mechanisms. The first mechanism being a linear passive mechanism, which is dependent on the mechanical structure of the basilar membrane and its surrounding structures. The second mechanism is a non-linear active mechanism, which is primarily dependent on the functioning of the OHCs, and also the general physiological condition of the cochlea itself. The base and apex of the basilar membrane differ in stiffness and width, which cause the basilar membrane to respond differently to varying frequencies along its length. The base of the basilar membrane is narrow and stiff, resulting in it responding best to high frequency sounds. The apex of the basilar membrane is wider and much less stiff in comparison to the base, causing it to respond best to low frequencies.
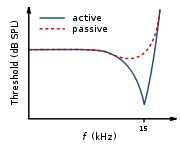
This selectivity to certain frequencies can be illustrated by neural tuning curves. These demonstrate the frequencies a fiber responds to, by showing threshold levels (dB SPL) of auditory nerve fibers as a function of different frequencies. This demonstrates that auditory nerve fibers respond best, and hence have better thresholds at the fibers characteristic frequency and frequencies immediately surrounding it. The basilar membrane is said to be ‘sharply tuned’ due to the sharp ‘V’ shaped curve, with its ‘tip’ centered at the auditory fibers characteristic frequency. This shape shows how few frequencies a fiber responds to. If it were a broader ‘V’ shape, it would be responding to more frequencies (See Figure 4).
 A normal neural tuning curve is characterised by a broadly tuned low frequency ‘tail’, with a finely tuned middle frequency ‘tip’. However, where there is partial or complete damage to the OHCs, but with unharmed IHCs, the resulting tuning curve would show the elimination of sensitivity at the quiet sounds. I.e. where the neural tuning curve would normally be most sensitive (at the ‘tip’) (See Figure 5).
Where both the OHCs and the IHCs are damaged, the resulting neural tuning curve would show the elimination of sensitivity at the ‘tip'. However, due to IHC damage, the whole tuning curve becomes raised, giving a loss of sensitivity across all frequencies (See Figure 6). It is only necessary for the first row of OHCs to be damaged for the elimination of the finely tuned ‘tip’ to occur. This supports the idea that the incidence of OHC damage and thus a loss of sensitivity to quiet sounds, occurs more than IHC loss.
Dead regions affect audiometric results, but perhaps not in the way expected. For example, it may be expected that thresholds would not be obtained at the frequencies within the dead region, but would be obtained at frequencies adjacent to the dead region. Therefore, assuming normal hearing exists around the dead region, it would produce an audiogram
that has a dramatically steep slope between the frequency where a threshold is obtained, and the frequency where a threshold cannot be obtained due to the dead region.
 However, it appears that this is not the case. Dead regions cannot be clearly found via PTA audiogram
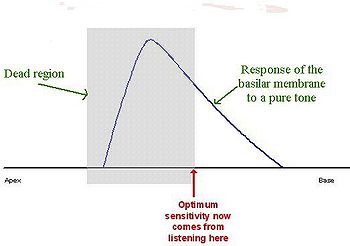
s. This may be because although the neurons innervating the dead region, cannot react to vibration at their characteristic frequency. If the basilar membrane vibration is large enough, neurons tuned to different characteristic frequencies such as those adjacent to the dead region, will be stimulated due to the spread of excitation. Therefore, a response from the patient at the test frequency will be obtained. This is referred to as “off-place listening”, and is also known as ‘off-frequency listening’. This will lead to a false threshold being found. Thus, it appears a person has better hearing than they actually do, resulting in a dead region being missed. Therefore, using PTA alone, it is impossible to identify the extent of a dead region (See Figure 7 and 8).
Consequently, how much is an audiometric threshold affected by a tone with its frequency within a dead region? This depends on the location of the dead region. Thresholds at low frequency dead regions, are more inaccurate than those at higher frequency dead regions. This has been attributed to the fact that excitation due to vibration of the basilar membrane spreads upwards from the apical regions of the basilar membrane, more than excitation spreads downwards from higher frequency basal regions of the cochlea. This pattern of the spread of excitation is similar to the ‘upward spread of masking’ phenomenon. If the tone is sufficiently loud to produce enough excitation at the normally functioning area of the cochlea, so that it is above that areas threshold. The tone will be detected, due to off-frequency listening which results in a misleading threshold.
To help to overcome the issue of PTA producing inaccurate thresholds within dead regions, masking of the area beyond the dead region that is being stimulated can be used. This means that the threshold of the responding area is sufficiently raised, so that it cannot detect the spread of excitation from the tone. This technique has led to the suggestion that a low frequency dead region may be related to a loss of 40-50 dB. However, as one of the aims of PTA is to determine whether or not there is a dead region, its may be difficult to assess which frequencies to mask without the use of other tests.
Based on research it has been suggested that a low frequency dead region may produce a relatively flat loss, or a very gradually sloping loss towards the higher frequencies. As the dead region will be less detectable due to the upward spread of excitation. Whereas, there may be a more obvious steeply sloping loss at high frequencies for a high frequency dead region. Although it is likely that the slope represents the less pronounced downward spread of excitation, rather than accurate thresholds for those frequencies with non-functioning hair cells. Mid-frequency dead regions, with a small range, appear to have less effect on the patient’s ability to hear in everyday life, and may produce a notch in the PTA thresholds.
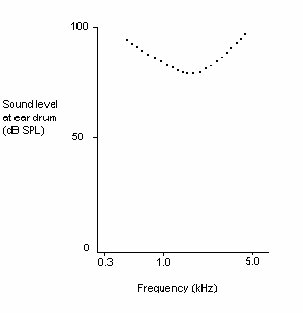
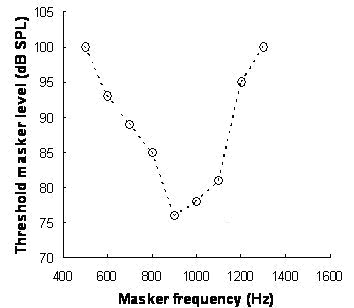 Although some debate continues regarding the reliability of such tests, it has been suggested that psychoacoustic tuning curves (PTCs) and threshold-equalising noise (TEN) results may be useful in detecting dead regions, rather than PTA. PTCs are similar to neural tuning curves. They illustrate the level of a masker (dB SPL) tone at threshold, as a function of deviation from center frequency (Hz). They are measured by presenting a fixed low intensity pure tone while also presenting a narrow-band masker, with a varying center frequency. The masker level is varied, so that the level of masker needed to just mask the test signal is found for the masker at each center frequency. The tip of the PTC is where the masker level needed to just mask the test signal is the lowest. For normal hearing people this is when the masker center frequency is closest to the frequency of the test signal (See Figure 9).
In the case of dead regions, when the test signal lies within the boundaries of a dead region, the tip of the PTC will be shifted to the edge of the dead region, to the area that is still functioning and detecting the spread of excitation from the signal. In the case of a low frequency dead region, the tip is shifted upwards indicating a low frequency dead region starting at the tip of the curve. For a high frequency dead region, the tip is shifted downwards from the signal frequency to the functioning area below the dead region. However, the traditional method of obtaining PTCs is not practical for clinical use, and it has been argued that TEN’s are not accurate enough. A fast method for finding PTCs has been developed and it may provide the solution. However, more research to validate this method is required, before it can be accepted clinically. Although it is clear that PTA is not the best test to identify a dead region.
configurations are not good indicators of how a dead region will affect a person functionally, mainly due to individual differences. For example, a sloping audiogram is often present with someone with a dead region, due to the spread of excitation. However, the individual may well be affected differently from someone with a corresponding sloped audiogram, caused by partial damage to hair cells rather than a dead region. They will perceive sounds differently, yet the audiogram suggests that they have the same degree of loss. Huss and Moore investigated how hearing impaired patients perceive pure tones, and found that they perceive tones as noisy and distorted, more (on average) than a person without a hearing impairment. However, they also found that the perception of tones as being like noise, was not directly related to frequencies within the dead regions, and was therefore not an indicator of a dead region. This therefore suggests that audiograms, and their poor representation of dead regions, are inaccurate predictors of a patient’s perception of pure tone quality.
Research by Kluk and Moore has shown that dead regions may also affect the patient’s perception of frequencies beyond the dead regions. There is an enhancement in the ability to distinguish between tones that differ very slightly in frequency, in regions just beyond the dead regions compared to tones further away. An explanation for this may be that cortical re-mapping has occurred. Whereby, neurons which would normally be stimulated by the dead region, have been reassigned to respond to functioning areas near it. This leads to an over-representation of these areas, resulting in an increased perceptual sensitivity to small frequency differences in tones. Therefore, PTA audiograms may not represent the individuals perception of their hearing loss.
and hearing disability? Hearing impairment is defined by the World Health Organisation (WHO) as a hearing loss in one or both ears. The degree of hearing loss is classified as mild, moderate, severe or profound. The results of PTA are a good indicator of hearing impairment.
Hearing disability is defined by the WHO as a reduction in ability to hear sounds in quiet and background noise (compared to people with normal hearing), which is caused by a hearing impairment. Several studies have investigated whether self-reported hearing problems (via questionnaires and interviews) were associated with the results from PTA. The findings of these studies indicate that in general, the results of PTA correspond to self-reported hearing problems (i.e. hearing disability). However, for some individuals this is not the case. Therefore, the results of PTA cannot be used to ascertain an individuals hearing disability.
 Hearing impairment (based on the audiogram
) and auditory
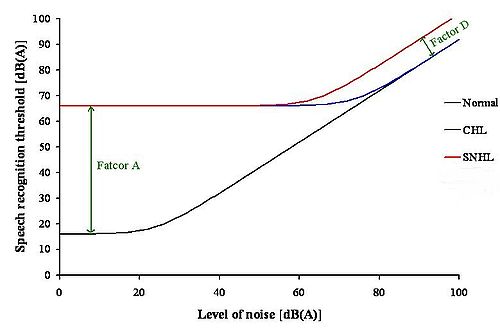
handicap (based on speech discrimination in noise) data was reviewed by Reinier Plomp. This led to the formulation of equations, which described the consequences of a hearing loss on speech intelligibility. The results of this review indicated that there were two factors of a hearing loss, which were involved in the effect on speech intelligibility. These factors were named Factor A and Factor D. Factor A affected speech intelligibility by attenuating the speech, whereas Factor D affected speech intelligibility by distorting the speech.
Speech recognition threshold (SRT) is defined as the sound pressure level at which 50% of the speech is identified correctly. For a person with a conductive hearing loss
(CHL) in quiet, the SRT needs to be higher than for a person with normal hearing. The increase in SRT depends on the degree of hearing loss only, so Factor A reflects the audiogram of that person. In noise, the person with a CHL has the same problem as the person with normal hearing (See Figure 10).
For a person with a SNHL in quiet, the SRT also needs to be higher than for a person with normal hearing. This is because the only factor that is important in quiet for a CHL and a SNHL is the audibility of the sound, which corresponds to Factor A. In noise, the person with a SNHL requires a better signal-to-noise ratio
to achieve the same performance level, as the person with normal hearing and the person with a CHL. This shows that in noise, Factor A is not enough to explain the problems of a person with a SNHL. Therefore, there is another problem present, which is Factor D. At present, it is not known what causes Factor D. Thus, in noise the audiogram is irrelevant. It is the type of hearing loss that is important in this situation.
These findings have important implications for the design of hearing aids. As hearing aids at present can compensate for Factor A, but this is not the case for Factor D. This could be why hearing aids are not satisfactory for a lot of people.
Audiometry
Audiometry is the testing of hearing ability, involving thresholds and differing frequencies. Typically, audiometric tests determine a subject's hearing levels with the help of an audiometer, but may also measure ability to discriminate between different sound intensities, recognize pitch, or...
(PTA) is the key hearing test
Hearing test
A hearing test provides an evaluation of the sensitivity of a person's sense of hearing and is most often performed by an audiologist using an audiometer. An audiometer is used to determine a person's hearing sensitivity at different frequencies. There are other hearing tests as well, e.g...
used to identify hearing
Hearing (sense)
Hearing is the ability to perceive sound by detecting vibrations through an organ such as the ear. It is one of the traditional five senses...
threshold levels of an individual, enabling determination of the degree, type and configuration of a hearing loss. Thus, providing the basis for diagnosis and management. PTA is a subjective, behavioural measurement of hearing threshold, as it relies on patient response to pure tone
Pure tone
A pure tone is a tone with a sinusoidal waveshape.A sine wave is characterized by its frequency, the number of cycles per second—or its wavelength, the distance the waveform travels through its medium within a period—and the amplitude, the size of each cycle...
stimuli. Therefore, PTA is used on adults and children old enough to cooperate with the test procedure. As with most clinical tests, calibration of the test environment, the equipment and the stimuli to ISO standards is needed before testing proceeds. PTA only measures thresholds, rather than other aspects of hearing such as sound localization
Sound localization
Sound localization refers to a listener's ability to identify the location or origin of a detected sound in direction and distance. It may also refer to the methods in acoustical engineering to simulate the placement of an auditory cue in a virtual 3D space .The sound localization mechanisms of the...
. However, there are benefits of using PTA over other forms of hearing test, such as click auditory brainstem response
Auditory Brainstem Response
The auditory brainstem response is an auditory evoked potential extracted from ongoing electrical activity in the brain and recorded via electrodes placed on the scalp. The resulting recording is a series of vertex positive waves of which I through V are evaluated...
. PTA provides ear specific thresholds, and uses frequency
Frequency
Frequency is the number of occurrences of a repeating event per unit time. It is also referred to as temporal frequency.The period is the duration of one cycle in a repeating event, so the period is the reciprocal of the frequency...
specific pure tones to give place specific responses, so that the configuration of a hearing loss can be identified. As PTA uses both air and bone conduction
Bone conduction
Bone conduction is the conduction of sound to the inner ear through the bones of the skull.Bone conduction is the reason why a person's voice sounds different to him/her when it is recorded and played back. Because the skull conducts lower frequencies better than air, people perceive their own...
audiometry, the type of loss can also be identified via the air-bone gap. Although PTA has many clinical benefits, it is not perfect at identifying all losses, such as ‘dead regions’. This raises the question of whether or not audiogram
Audiogram
An audiogram is a standard way of representing a person's hearing loss . Most audiograms cover the limited range 100 Hz to 8000 Hz which is most important for clear understanding of speech, and they plot the threshold of hearing relative to a standardised curve that represents 'normal'...
s accurately predict someone’s perceived degree of disability.
PTA procedural standards
There are both international and British standards regarding the PTA test protocol. The British Society of AudiologyVariations
There are cases where conventional PTA is not an appropriate or effective method of threshold testing. Procedural changes to the conventional test method may be necessary with populations who are unable to cooperate with the test in order to obtain hearing thresholds. Sound field audiometry may be more suitable when patients are unable to wear earphones, as the stimuli are usually presented by loudspeaker. A disadvantage of this method is that although thresholds can be obtained, results are not ear specific. In addition, response to pure tone stimuli may be limited, because in a sound field pure tones create standing waves, which alter sound intensitySound intensity
Sound intensity or acoustic intensity is defined as the sound power Pac per unit area A. The usual context is the noise measurement of sound intensity in the air at a listener's location.-Acoustic intensity:...
within the sound field. Therefore, it may be necessary to use other stimuli, such as warble tones in sound field testing. There are variations of conventional audiometry testing that are designed specifically for young children and infants, such as visual reinforcement audiometry and play audiometry.
Conventional audiometry tests frequencies between 250 hertz
Hertz
The hertz is the SI unit of frequency defined as the number of cycles per second of a periodic phenomenon. One of its most common uses is the description of the sine wave, particularly those used in radio and audio applications....
(Hz) and 8 kHz, whereas high frequency audiometry tests in the region of 8 kHz-20 kHz. Some environmental factors, such as ototoxic medication and noise exposure, appear to be more detrimental to high frequency sensitivity than to that of mid or low frequencies. Therefore, high frequency audiometry is an effective method of monitoring losses that are suspected to have been caused by these factors. It is also effective in detecting the auditory sensitivity changes that occur with aging.
Cross hearing and interaural attenuation
When sound is applied to one ear the contralateral cochlea can also be stimulated to varying degrees, via vibrations through the bone of the skull. When the stimuli presented to the test ear stimulates the cochlea
Cochlea
The cochlea is the auditory portion of the inner ear. It is a spiral-shaped cavity in the bony labyrinth, making 2.5 turns around its axis, the modiolus....
of the non-test ear, this is known as cross hearing. Whenever it is suspected that cross hearing has occurred it is best to use masking. This is done by temporarily elevating the threshold of the non-test ear, by presenting a masking noise at a predetermined level. This prevents the non-test ear from detecting the test signal presented to the test ear. The threshold of the test ear is measured at the same time as presenting the masking noise to the non-test ear. Thus, thresholds obtained when masking has been applied, provide an accurate representation of the true hearing threshold level of the test ear.
A reduction or loss of energy occurs with cross hearing, which is referred to as interaural attenuation (IA) or transcranial transmission loss. IA varies with transducer type. It varies from 40 dB to 80 dB with supra-aural headphones. However, with insert earphones it is in the region of 55 dB. The use of insert earphones reduces the need for masking, due to the greater IA which occurs when they are used (See Figure 1).
Air conduction results in isolation, give little information regarding the type of hearing loss. When the thresholds obtained via air conduction are examined alongside those achieved with bone conduction, the configuration of the hearing loss can be determined. However, with bone conduction (performed by placing a vibrator on the mastoid bone behind the ear), both cochleas are stimulated. IA for bone conduction ranges from 0-20 dB (See Figure 2).Therefore, conventional audiometry is ear specific, with regards to both air and bone conduction audiometry, when masking is applied.
Cochlea
Organ of Corti
The organ of Corti is the organ in the inner ear of mammals that contains auditory sensory cells, or "hair cells."The organ was named after the Italian anatomist Marquis Alfonso Giacomo Gaspare Corti , who conducted microscopic research of the mammaliean auditory system.-Structure and function:The...
, which is situated between the basilar membrane
Basilar membrane
The basilar membrane within the cochlea of the inner ear is a stiff structural element that separates two liquid-filled tubes that run along the coil of the cochlea, the scala media and the scala tympani .-Function:...
and the tectorial membrane
Tectorial membrane
Tectorial membrane can refer to:*Tectorial membrane *Tectorial membrane...
within the cochlea (See Figure 3). The tunnel of corti, which runs through the Organ of Corti, divides the OHCs and the inner hair cells (IHCs). OHCs are connected to the reticular laminar and the Deiters’ cells. There are roughly twelve thousand OHCs in each human ear, and these are arranged in up to five rows. Each OHC has small tufts of hairs on their upper surface known as stereocilia
Stereocilia
In the inner ear, stereocilia are the mechanosensing organelles of hair cells, which respond to fluid motion in numerous types of animals for various functions, including hearing and balance. They are about 10–50 micrometers in length and share some similar features of microvilli...
, and these are also arranged into rows which are graded in height. There are approximately 140 stereocilia on each OHC.
The fundamental role of the OHCs and the IHCs is to function as sensory receptors. The main function of the IHCs is to transmit sound information via afferent
Afferent
Afferent is an anatomical term with the following meanings:*Conveying towards a center, for example the afferent arterioles conveying blood towards the Bowman's capsule in the Kidney. Opposite to Efferent.*Something that so conducts, see Afferent nerve fiber...
neurons. They do this by transducing mechanical movements or signals into neural activity. When stimulated, the stereocilia on the IHCs move, causing a flow of electrical current to pass through the hair cells. This electrical current creates action potentials within the connected afferent neurons.
OHCs are different in that they actually contribute to the active mechanism of the cochlea. They do this by receiving mechanical signals or vibrations along the basilar membrane, and transducing them into electrochemical signals. The stereocilia found on OHCs are in contact with the tectorial membrane. Therefore, when the basilar membrane moves due to vibrations, the stereocilia bend. The direction in which they bend, dictates the firing rate of the auditory neurons connected to the OHCs.
The bending of the stereocilia towards the basal body
Basal body
A basal body is an organelle formed from a centriole, and a short cylindrical array of microtubules. It is found at the base of a eukaryotic undulipodium and serves as a nucleation site for the growth of the axoneme microtubules...
of the OHC causes excitation of the hair cell. Thus, an increase in firing rate of the auditory neurons connected to the hair cell occurs. On the other hand, the bending of the stereocilia away from the basal body of the OHC causes inhibition of the hair cell. Thus, a decrease in firing rate of the auditory neurons connected to the hair cell occurs. OHCs are unique in that they are able to contract and expand (electromotility). Therefore, in response to the electrical stimulations provided by the efferent nerve supply, they can alter in length, shape and stiffness. These changes influence the response of the basilar membrane to sound. It is therefore clear that the OHCs play a major role in the active processes of the cochlea. The main function of the active mechanism is to finely tune the basilar membrane, and provide it with a high sensitivity to quiet sounds. The active mechanism is dependent on the cochlea being in good physiological condition. However, the cochlea is very susceptible to damage.
Cochlea hearing loss
Cochlea hearing loss is also known as sensorineural hearing lossSensorineural hearing loss
Sensorineural hearing loss is a type of hearing loss in which the root cause lies in the vestibulocochlear nerve , the inner ear, or central processing centers of the brain....
(SNHL), and is most prevalent in the elderly. In this situation, the hearing loss is acquired through the ageing process, and is referred to as presbyacusis. SNHL is most commonly caused by damage to the OHCs and the IHCs. There are two methods by which they might become damaged. Firstly, the entire hair cell might die. Secondly, the stereocilia might become distorted or destroyed. Damage to the cochlea can occur in several ways, for example by viral infection, exposure to ototoxic chemicals, and intense noise exposure. Damage to the OHCs results in either a less effective active mechanism, or it may not function at all. OHCs contribute to providing a high sensitivity to quiet sounds at a specific range of frequencies (approximately 2-4 kHz). Thus, damage to the OHCs results in the reduction of sensitivity of the basilar membrane to weak sounds. Amplification to these sounds is therefore required, in order for the basilar membrane to respond efficiently. IHCs are less susceptible to damage in comparison to the OHCs. However, if they become damaged, this will result in an overall loss of sensitivity.
Frequency selectivity and neural tuning curves
Stiffness
Stiffness is the resistance of an elastic body to deformation by an applied force along a given degree of freedom when a set of loading points and boundary conditions are prescribed on the elastic body.-Calculations:...
of the basilar membrane, low frequency waves peak in the apex, while high frequency sounds peak in the basal end of the cochlea. Therefore, each position along the basilar membrane is finely tuned to a particular frequency. These specifically tuned frequencies are referred to as characteristic frequencies (CF).
If a sound entering the ear is displaced from the characteristic frequency, then the strength of response from the basilar membrane will progressively lessen. The fine tuning of the basilar membrane is created by the input of two separate mechanisms. The first mechanism being a linear passive mechanism, which is dependent on the mechanical structure of the basilar membrane and its surrounding structures. The second mechanism is a non-linear active mechanism, which is primarily dependent on the functioning of the OHCs, and also the general physiological condition of the cochlea itself. The base and apex of the basilar membrane differ in stiffness and width, which cause the basilar membrane to respond differently to varying frequencies along its length. The base of the basilar membrane is narrow and stiff, resulting in it responding best to high frequency sounds. The apex of the basilar membrane is wider and much less stiff in comparison to the base, causing it to respond best to low frequencies.
This selectivity to certain frequencies can be illustrated by neural tuning curves. These demonstrate the frequencies a fiber responds to, by showing threshold levels (dB SPL) of auditory nerve fibers as a function of different frequencies. This demonstrates that auditory nerve fibers respond best, and hence have better thresholds at the fibers characteristic frequency and frequencies immediately surrounding it. The basilar membrane is said to be ‘sharply tuned’ due to the sharp ‘V’ shaped curve, with its ‘tip’ centered at the auditory fibers characteristic frequency. This shape shows how few frequencies a fiber responds to. If it were a broader ‘V’ shape, it would be responding to more frequencies (See Figure 4).
Effect of cochlea hearing loss on neural tuning curves
Where both the OHCs and the IHCs are damaged, the resulting neural tuning curve would show the elimination of sensitivity at the ‘tip'. However, due to IHC damage, the whole tuning curve becomes raised, giving a loss of sensitivity across all frequencies (See Figure 6). It is only necessary for the first row of OHCs to be damaged for the elimination of the finely tuned ‘tip’ to occur. This supports the idea that the incidence of OHC damage and thus a loss of sensitivity to quiet sounds, occurs more than IHC loss.
Dead regions and their effect on audiometric results
When the IHCs or part of the basilar membrane are damaged or destroyed, so that they no longer function as transducers, the result is a ‘dead region’. Dead regions can be defined in terms of the characteristic frequencies of the IHC, related to the specific place along the basilar membrane where the dead region occurs. Assuming that there has been no shift in the characteristic frequencies relating to certain regions of the basilar membrane, due to the damage of OHCs. This often occurs with IHC damage. Dead regions can also be defined by the anatomical place of the non-functioning IHC (such as an “apical dead region”), or by the characteristic frequencies of the IHC adjacent to the dead region.Dead regions affect audiometric results, but perhaps not in the way expected. For example, it may be expected that thresholds would not be obtained at the frequencies within the dead region, but would be obtained at frequencies adjacent to the dead region. Therefore, assuming normal hearing exists around the dead region, it would produce an audiogram
Audiogram
An audiogram is a standard way of representing a person's hearing loss . Most audiograms cover the limited range 100 Hz to 8000 Hz which is most important for clear understanding of speech, and they plot the threshold of hearing relative to a standardised curve that represents 'normal'...
that has a dramatically steep slope between the frequency where a threshold is obtained, and the frequency where a threshold cannot be obtained due to the dead region.
Audiogram
An audiogram is a standard way of representing a person's hearing loss . Most audiograms cover the limited range 100 Hz to 8000 Hz which is most important for clear understanding of speech, and they plot the threshold of hearing relative to a standardised curve that represents 'normal'...
s. This may be because although the neurons innervating the dead region, cannot react to vibration at their characteristic frequency. If the basilar membrane vibration is large enough, neurons tuned to different characteristic frequencies such as those adjacent to the dead region, will be stimulated due to the spread of excitation. Therefore, a response from the patient at the test frequency will be obtained. This is referred to as “off-place listening”, and is also known as ‘off-frequency listening’. This will lead to a false threshold being found. Thus, it appears a person has better hearing than they actually do, resulting in a dead region being missed. Therefore, using PTA alone, it is impossible to identify the extent of a dead region (See Figure 7 and 8).
Consequently, how much is an audiometric threshold affected by a tone with its frequency within a dead region? This depends on the location of the dead region. Thresholds at low frequency dead regions, are more inaccurate than those at higher frequency dead regions. This has been attributed to the fact that excitation due to vibration of the basilar membrane spreads upwards from the apical regions of the basilar membrane, more than excitation spreads downwards from higher frequency basal regions of the cochlea. This pattern of the spread of excitation is similar to the ‘upward spread of masking’ phenomenon. If the tone is sufficiently loud to produce enough excitation at the normally functioning area of the cochlea, so that it is above that areas threshold. The tone will be detected, due to off-frequency listening which results in a misleading threshold.
To help to overcome the issue of PTA producing inaccurate thresholds within dead regions, masking of the area beyond the dead region that is being stimulated can be used. This means that the threshold of the responding area is sufficiently raised, so that it cannot detect the spread of excitation from the tone. This technique has led to the suggestion that a low frequency dead region may be related to a loss of 40-50 dB. However, as one of the aims of PTA is to determine whether or not there is a dead region, its may be difficult to assess which frequencies to mask without the use of other tests.
Based on research it has been suggested that a low frequency dead region may produce a relatively flat loss, or a very gradually sloping loss towards the higher frequencies. As the dead region will be less detectable due to the upward spread of excitation. Whereas, there may be a more obvious steeply sloping loss at high frequencies for a high frequency dead region. Although it is likely that the slope represents the less pronounced downward spread of excitation, rather than accurate thresholds for those frequencies with non-functioning hair cells. Mid-frequency dead regions, with a small range, appear to have less effect on the patient’s ability to hear in everyday life, and may produce a notch in the PTA thresholds.
Psychoacoustic tuning curves
In the case of dead regions, when the test signal lies within the boundaries of a dead region, the tip of the PTC will be shifted to the edge of the dead region, to the area that is still functioning and detecting the spread of excitation from the signal. In the case of a low frequency dead region, the tip is shifted upwards indicating a low frequency dead region starting at the tip of the curve. For a high frequency dead region, the tip is shifted downwards from the signal frequency to the functioning area below the dead region. However, the traditional method of obtaining PTCs is not practical for clinical use, and it has been argued that TEN’s are not accurate enough. A fast method for finding PTCs has been developed and it may provide the solution. However, more research to validate this method is required, before it can be accepted clinically. Although it is clear that PTA is not the best test to identify a dead region.
Perceptual consequences of a dead region
AudiogramAudiogram
An audiogram is a standard way of representing a person's hearing loss . Most audiograms cover the limited range 100 Hz to 8000 Hz which is most important for clear understanding of speech, and they plot the threshold of hearing relative to a standardised curve that represents 'normal'...
configurations are not good indicators of how a dead region will affect a person functionally, mainly due to individual differences. For example, a sloping audiogram is often present with someone with a dead region, due to the spread of excitation. However, the individual may well be affected differently from someone with a corresponding sloped audiogram, caused by partial damage to hair cells rather than a dead region. They will perceive sounds differently, yet the audiogram suggests that they have the same degree of loss. Huss and Moore investigated how hearing impaired patients perceive pure tones, and found that they perceive tones as noisy and distorted, more (on average) than a person without a hearing impairment. However, they also found that the perception of tones as being like noise, was not directly related to frequencies within the dead regions, and was therefore not an indicator of a dead region. This therefore suggests that audiograms, and their poor representation of dead regions, are inaccurate predictors of a patient’s perception of pure tone quality.
Research by Kluk and Moore has shown that dead regions may also affect the patient’s perception of frequencies beyond the dead regions. There is an enhancement in the ability to distinguish between tones that differ very slightly in frequency, in regions just beyond the dead regions compared to tones further away. An explanation for this may be that cortical re-mapping has occurred. Whereby, neurons which would normally be stimulated by the dead region, have been reassigned to respond to functioning areas near it. This leads to an over-representation of these areas, resulting in an increased perceptual sensitivity to small frequency differences in tones. Therefore, PTA audiograms may not represent the individuals perception of their hearing loss.
Correlation between thresholds obtained using PTA and hearing disability
PTA is described as the gold standard for assessment of a hearing loss. But, how accurate is PTA at classifying the hearing loss of an individual, in terms of hearing impairmentHearing impairment
-Definition:Deafness is the inability for the ear to interpret certain or all frequencies of sound.-Environmental Situations:Deafness can be caused by environmental situations such as noise, trauma, or other ear defections...
and hearing disability? Hearing impairment is defined by the World Health Organisation (WHO) as a hearing loss in one or both ears. The degree of hearing loss is classified as mild, moderate, severe or profound. The results of PTA are a good indicator of hearing impairment.
Hearing disability is defined by the WHO as a reduction in ability to hear sounds in quiet and background noise (compared to people with normal hearing), which is caused by a hearing impairment. Several studies have investigated whether self-reported hearing problems (via questionnaires and interviews) were associated with the results from PTA. The findings of these studies indicate that in general, the results of PTA correspond to self-reported hearing problems (i.e. hearing disability). However, for some individuals this is not the case. Therefore, the results of PTA cannot be used to ascertain an individuals hearing disability.
Audiogram
An audiogram is a standard way of representing a person's hearing loss . Most audiograms cover the limited range 100 Hz to 8000 Hz which is most important for clear understanding of speech, and they plot the threshold of hearing relative to a standardised curve that represents 'normal'...
) and auditory
Hearing (sense)
Hearing is the ability to perceive sound by detecting vibrations through an organ such as the ear. It is one of the traditional five senses...
handicap (based on speech discrimination in noise) data was reviewed by Reinier Plomp. This led to the formulation of equations, which described the consequences of a hearing loss on speech intelligibility. The results of this review indicated that there were two factors of a hearing loss, which were involved in the effect on speech intelligibility. These factors were named Factor A and Factor D. Factor A affected speech intelligibility by attenuating the speech, whereas Factor D affected speech intelligibility by distorting the speech.
Speech recognition threshold (SRT) is defined as the sound pressure level at which 50% of the speech is identified correctly. For a person with a conductive hearing loss
Conductive hearing loss
Conductive hearing loss occurs when there is a problem conducting sound waves anywhere along the route through the outer ear, tympanic membrane , or middle ear ....
(CHL) in quiet, the SRT needs to be higher than for a person with normal hearing. The increase in SRT depends on the degree of hearing loss only, so Factor A reflects the audiogram of that person. In noise, the person with a CHL has the same problem as the person with normal hearing (See Figure 10).
For a person with a SNHL in quiet, the SRT also needs to be higher than for a person with normal hearing. This is because the only factor that is important in quiet for a CHL and a SNHL is the audibility of the sound, which corresponds to Factor A. In noise, the person with a SNHL requires a better signal-to-noise ratio
Signal-to-noise ratio
Signal-to-noise ratio is a measure used in science and engineering that compares the level of a desired signal to the level of background noise. It is defined as the ratio of signal power to the noise power. A ratio higher than 1:1 indicates more signal than noise...
to achieve the same performance level, as the person with normal hearing and the person with a CHL. This shows that in noise, Factor A is not enough to explain the problems of a person with a SNHL. Therefore, there is another problem present, which is Factor D. At present, it is not known what causes Factor D. Thus, in noise the audiogram is irrelevant. It is the type of hearing loss that is important in this situation.
These findings have important implications for the design of hearing aids. As hearing aids at present can compensate for Factor A, but this is not the case for Factor D. This could be why hearing aids are not satisfactory for a lot of people.
See also
- Hearing rangeHearing rangeFor more detail on human hearing see Audiogram, Equal loudness contours and Hearing impairment.Hearing range usually describes the range of frequencies that can be heard by an animal or human, though it can also refer to the range of levels...
- Audiograms in mammals
- Auditory maskingAuditory maskingAuditory masking occurs when the perception of one sound is affected by the presence of another sound.- Simultaneous masking :Simultaneous masking is when a sound is made inaudible by a "masker", a noise or unwanted sound of the same duration as the original sound.-Critical bandwidth:If two sounds...
- Auditory filters
- Absolute threshold of hearingAbsolute threshold of hearingThe absolute threshold of hearing is the minimum sound level of a pure tone that an average ear with normal hearing can hear with no other sound present. The absolute threshold relates to the sound that can just be heard by the organism...
- Equal-loudness contours
- Otoacoustic emissionOtoacoustic emissionAn otoacoustic emission is a sound which is generated from within the inner ear. Having been predicted by Thomas Gold in 1948, its existence was first demonstrated experimentally by David Kemp in 1978 and otoacoustic emissions have since been shown to arise by a number of different cellular...
- PrestinPrestinPrestin is a protein that in humans is encoded by the SLC26A5 gene.Prestin is the motor protein of the outer hair cells of the inner ear of the mammalian cochlea. It is highly expressed in the outer hair cells, and is not expressed in the nonmotile inner hair cells...
External links
- EMedicine.com.
- GPNotebook.co.uk.
- Answers.com.
- Springerlink.com.
- Audition Cochlea Promenade oreille ear organ Corti C.R.I.C Montpellier. This website provides excellent diagrams and animated pictures that aid understanding of the topics covered. There are a wide range of topics covered including sound, cochlea, Organ of Corti,hair cell pathology and audiometry.
- RNID (Royal National Institute for the Deaf) website. This site includes useful information on hearing loss and provides information for health professionals. Also, at http://www.rnid.org.uk/howwehelp/research_and_technology/rnid_research_grants/device_projects/cochlear_dead_regions/ within this site, there is information on a research project that is aiming to develop a test for dead regions.
- Audiology Resources. This site provides useful resources for people interested in audiology.
- British Society of Audiology. The BSA recommended procedures are available to download at this site.
- Deafness Research UK. This site contains facts about deafness, and has an extensive collection of factsheets available. Also, there is information about research projects and the latest research developments. One of the research projects featured is on dead regions.