

Phase dispersion minimization
Encyclopedia
Periodic function
In mathematics, a periodic function is a function that repeats its values in regular intervals or periods. The most important examples are the trigonometric functions, which repeat over intervals of length 2π radians. Periodic functions are used throughout science to describe oscillations,...
components of a time series
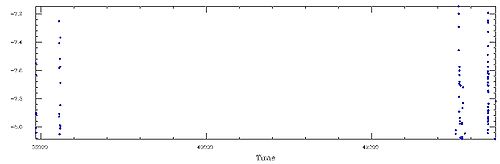
Time series
In statistics, signal processing, econometrics and mathematical finance, a time series is a sequence of data points, measured typically at successive times spaced at uniform time intervals. Examples of time series are the daily closing value of the Dow Jones index or the annual flow volume of the...
data set. It is useful for data sets with gaps, non-sinusoidal variations, poor time coverage or other problems that would make Fourier techniques
Fourier transform
In mathematics, Fourier analysis is a subject area which grew from the study of Fourier series. The subject began with the study of the way general functions may be represented by sums of simpler trigonometric functions...
unusable. It was first developed by Stellingwerf in 1978 and has been widely used for astronomical and other types of periodic data analyses. The current version of this application is available for download.
Background
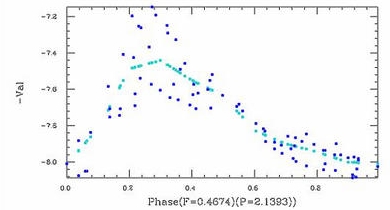
PDM is a variant of a standard astronomical technique called data folding. This involves guessing a trial period for the data, and cutting, or "folding" the data into multiple sub-series with a time duration equal to the trial period. The data are now plotted versus "phase", or a scale of 0->1, relative to the trial period. If the data is truly periodic with this period a clean functional variation, or "light curveLight curve
In astronomy, a light curve is a graph of light intensity of a celestial object or region, as a function of time. The light is usually in a particular frequency interval or band...
", will emerge. If not the points will be randomly distributed in amplitude.
As early as 1926 Whittiker and Robinson proposed an analysis technique of this type based on maximizing the amplitude of the mean curve. Another technique focusing on the variation of data at adjacent phases was proposed in 1964 by Lafler and Kinman . Both techniques had difficulties, particularly in estimating the significance of a possible solution.
PDM analysis
PDM divides the folded data into a series of bins and computes the varianceVariance
In probability theory and statistics, the variance is a measure of how far a set of numbers is spread out. It is one of several descriptors of a probability distribution, describing how far the numbers lie from the mean . In particular, the variance is one of the moments of a distribution...
of the amplitude within each bin. The bins can overlap to improve phase coverage, if needed. The bin variances are combined and compared to the overall variance of the data set. For a true period the ratio of the bin to the total variances will be small. For a false period the ratio will be approximately unity. A plot of this ratio versus trial period will usually indicate the best candidates for periodic components. Analyses of the statistical properties of this approach have been given by Nemec & Nemec and Schwarzenberg-Czerny .
PDM2 updates
The original PDM technique has problems in two areas:- 1) The bin variance calculation is equivalent to a curve fit with step functions across each bin. This can introduce errors in the result if the underlying curve is non-symmetric, since deviations toward the right side and left side of each bin will not exactly cancel. This low order error can be eliminated by replacing the step function by a linear fit drawn between bin means (see figure, above), or a B-Spline fit to the bin means. In either case, the smoothed fits should not be used for frequencies in the "noise" portion of the spectrum.
- 2) The original test of significance was based on an F test, which has been shown to be incorrect. The correct statistic is an incomplete beta distribution for well-behaved data sets, and a Fisher Randomization / Monte-Carlo analysis for "clumpy" data (i.e. data with non-uniform time distribution).
These updates have been incorporated into a new formulation of PDM, called PDM2. See reference (2) for a detailed technical discussion, test cases, C source code, and a Windows application package.