

Time series
Encyclopedia
Statistics
Statistics is the study of the collection, organization, analysis, and interpretation of data. It deals with all aspects of this, including the planning of data collection in terms of the design of surveys and experiments....
, signal processing
Signal processing
Signal processing is an area of systems engineering, electrical engineering and applied mathematics that deals with operations on or analysis of signals, in either discrete or continuous time...
, econometrics
Econometrics
Econometrics has been defined as "the application of mathematics and statistical methods to economic data" and described as the branch of economics "that aims to give empirical content to economic relations." More precisely, it is "the quantitative analysis of actual economic phenomena based on...
and mathematical finance
Mathematical finance
Mathematical finance is a field of applied mathematics, concerned with financial markets. The subject has a close relationship with the discipline of financial economics, which is concerned with much of the underlying theory. Generally, mathematical finance will derive and extend the mathematical...
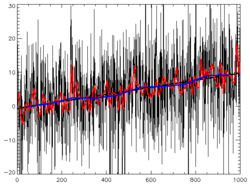
, a time series is a sequence of data point
Data point
In statistics, a data point is a set of measurements on a single member of a statistical population, or a subset of those measurements for a given individual...
s, measured typically at successive times spaced at uniform time intervals. Examples of time series are the daily closing value of the Dow Jones index or the annual flow volume of the Nile River at Aswan. Time series analysis comprises methods for analyzing time series data in order to extract meaningful statistics and other characteristics of the data. Time series forecasting is the use of a model to predict future values based on previously observed values. Time series are very frequently plotted via line chart
Line chart
A line chart or line graph is a type of graph, which displays information as a series of data points connected by straight line segments. It is a basic type of chart common in many fields. It is an extension of a scatter graph, and is created by connecting a series of points that represent...
s.
Time series data have a natural temporal ordering. This makes time series analysis distinct from other common data analysis problems, in which there is no natural ordering of the observations (e.g. explaining people's wages by reference to their education level, where the individuals' data could be entered in any order). Time series analysis is also distinct from spatial data analysis where the observations typically relate to geographical locations (e.g. accounting for house prices by the location as well as the intrinsic characteristics of the houses). A time series model will generally reflect the fact that observations close together in time will be more closely related than observations further apart. In addition, time series models will often make use of the natural one-way ordering of time so that values for a given period will be expressed as deriving in some way from past values, rather than from future values (see time reversibility
Time reversibility
Time reversibility is an attribute of some stochastic processes and some deterministic processes.If a stochastic process is time reversible, then it is not possible to determine, given the states at a number of points in time after running the stochastic process, which state came first and which...
.)
Methods for time series analyses may be divided into two classes: frequency-domain methods and time-domain methods. The former include spectral analysis
Spectral analysis
Spectral analysis or Spectrum analysis may refer to:* Spectrum analysis in chemistry and physics, a method of analyzing the chemical properties of matter from bands in their visible spectrum...
and recently wavelet analysis; the latter include auto-correlation and cross-correlation
Cross-correlation
In signal processing, cross-correlation is a measure of similarity of two waveforms as a function of a time-lag applied to one of them. This is also known as a sliding dot product or sliding inner-product. It is commonly used for searching a long-duration signal for a shorter, known feature...
analysis.
Analysis
There are several types of data analysis available for time series which are appropriate for different purposes.General exploration
- Graphical examination of data series
- AutocorrelationAutocorrelationAutocorrelation is the cross-correlation of a signal with itself. Informally, it is the similarity between observations as a function of the time separation between them...
analysis to examine serial dependenceSerial dependenceIn statistics and signal processing, random variables in a time series have serial dependence if the value at some time t in the series is statistically dependent on the value at another time s... - Spectral analysisSpectral analysisSpectral analysis or Spectrum analysis may refer to:* Spectrum analysis in chemistry and physics, a method of analyzing the chemical properties of matter from bands in their visible spectrum...
to examine cyclic behaviour which need not be related to seasonalitySeasonalityIn statistics, many time series exhibit cyclic variation known as seasonality, periodic variation, or periodic fluctuations. This variation can be either regular or semi regular....
. For example, sun spot activity varies over 11 year cycles. Other common examples include celestial phenomena, weather patterns, neural activity, commodity prices, and economic activity.
Description
- Separation into components representing trend, seasonality, slow and fast variation, cyclical irregular: see decomposition of time series
- Simple properties of marginal distributionMarginal distributionIn probability theory and statistics, the marginal distribution of a subset of a collection of random variables is the probability distribution of the variables contained in the subset. The term marginal variable is used to refer to those variables in the subset of variables being retained...
s
Prediction and forecasting
- Fully formed statistical models for stochastic simulationStochastic simulationStochastic simulation algorithms and methods were initially developed to analyse chemical reactions involving large numbers of species with complex reaction kinetics. The first algorithm, the Gillespie algorithm was proposed by Dan Gillespie in 1977...
purposes, so as to generate alternative versions of the time series, representing what might happen over non-specific time-periods in the future - Simple or fully formed statistical models to describe the likely outcome of the time series in the immediate future, given knowledge of the most recent outcomes (forecasting).
Models
Models for time series data can have many forms and represent different stochastic processes. When modeling variations in the level of a process, three broad classes of practical importance are the autoregressive (AR) models, the integrated (I) models, and the moving averageMoving average model
In time series analysis, the moving-average model is a common approach for modeling univariate time series models. The notation MA refers to the moving average model of order q:...
(MA) models. These three classes depend linearly on previous data points. Combinations of these ideas produce autoregressive moving average (ARMA) and autoregressive integrated moving average
Autoregressive integrated moving average
In statistics and econometrics, and in particular in time series analysis, an autoregressive integrated moving average model is a generalization of an autoregressive moving average model. These models are fitted to time series data either to better understand the data or to predict future points...
(ARIMA) models. The autoregressive fractionally integrated moving average
Autoregressive fractionally integrated moving average
In statistics, autoregressive fractionally integrated moving average models are time series models that generalize ARIMA models by allowing non-integer values of the differencing parameter and are useful in modeling time series with long memory...
(ARFIMA) model generalizes the former three. Extensions of these classes to deal with vector-valued data are available under the heading of multivariate time-series models and sometimes the preceding acronyms are extended by including an initial "V" for "vector". An additional set of extensions of these models is available for use where the observed time-series is driven by some "forcing" time-series (which may not have a causal effect on the observed series): the distinction from the multivariate case is that the forcing series may be deterministic or under the experimenter's control. For these models, the acronyms are extended with a final "X" for "exogenous".
Non-linear dependence of the level of a series on previous data points is of interest, partly because of the possibility of producing a chaotic
Chaos theory
Chaos theory is a field of study in mathematics, with applications in several disciplines including physics, economics, biology, and philosophy. Chaos theory studies the behavior of dynamical systems that are highly sensitive to initial conditions, an effect which is popularly referred to as the...
time series. However, more importantly, empirical investigations can indicate the advantage of using predictions derived from non-linear models, over those from linear models, as for example in nonlinear autoregressive exogenous model
Nonlinear autoregressive exogenous model
In time series modeling, a nonlinear autoregressive exogenous model is a nonlinear autoregressive model which has exogenous inputs. This means that the model relates the current value of a time series which one would like to explain or predict to both:...
s.
Among other types of non-linear time series models, there are models to represent the changes of variance along time (heteroskedasticity
Heteroskedasticity
In statistics, a collection of random variables is heteroscedastic, or heteroskedastic, if there are sub-populations that have different variabilities than others. Here "variability" could be quantified by the variance or any other measure of statistical dispersion...
). These models represent autoregressive conditional heteroskedasticity
Autoregressive conditional heteroskedasticity
In econometrics, AutoRegressive Conditional Heteroskedasticity models are used to characterize and model observed time series. They are used whenever there is reason to believe that, at any point in a series, the terms will have a characteristic size, or variance...
(ARCH) and the collection comprises a wide variety of representation (GARCH, TARCH, EGARCH, FIGARCH, CGARCH, etc.). Here changes in variability are related to, or predicted by, recent past values of the observed series. This is in contrast to other possible representations of locally varying variability, where the variability might be modelled as being driven by a separate time-varying process, as in a doubly stochastic model
Doubly stochastic model
In statistics, a doubly stochastic model is a type of model that can arise in many contexts, but in particular in modelling time-series and stochastic processes....
.
In recent work on model-free analyses, wavelet transform based methods (for example locally stationary wavelets and wavelet decomposed neural networks) have gained favor. Multiscale (often referred to as multiresolution) techniques decompose a given time series, attempting to illustrate time dependence at multiple scales.
Notation
A number of different notations are in use for time-series analysis. A common notation specifying a time series X that is indexed by the natural numberNatural number
In mathematics, the natural numbers are the ordinary whole numbers used for counting and ordering . These purposes are related to the linguistic notions of cardinal and ordinal numbers, respectively...
s is written
- X = {X1, X2, ...}.
Another common notation is
- Y = {Yt: t ∈ T},
where T is the index set
Index set
In mathematics, the elements of a set A may be indexed or labeled by means of a set J that is on that account called an index set...
.
Conditions
There are two sets of conditions under which much of the theory is built:- Stationary processStationary processIn the mathematical sciences, a stationary process is a stochastic process whose joint probability distribution does not change when shifted in time or space...
- ErgodicityErgodicityIn mathematics, the term ergodic is used to describe a dynamical system which, broadly speaking, has the same behavior averaged over time as averaged over space. In physics the term is used to imply that a system satisfies the ergodic hypothesis of thermodynamics.-Etymology:The word ergodic is...
However, ideas of stationarity must be expanded to consider two important ideas: strict stationarity and second-order stationarity. Both models and applications can be developed under each of these conditions, although the models in the latter case might be considered as only partly specified.
In addition, time-series analysis can be applied where the series are seasonally stationary or non-stationary. Situations where the amplitudes of frequency components change with time can be dealt with in time-frequency analysis
Time-frequency analysis
In signal processing, time–frequency analysis comprises those techniques that study a signal in both the time and frequency domains simultaneously, using various time–frequency representations...
which makes use of a time–frequency representation of a time-series or signal.
Models
The general representation of an autoregressive model, well-known as AR(p), is
where the term εt is the source of randomness and is called white noise
White noise
White noise is a random signal with a flat power spectral density. In other words, the signal contains equal power within a fixed bandwidth at any center frequency...
. It is assumed to have the following characteristics:


With these assumptions, the process is specified up to second-order moments and, subject to conditions on the coefficients, may be second-order stationary.
If the noise also has a normal distribution, it is called normal or Gaussian white noise. In this case, the AR process may be strictly stationary, again subject to conditions on the coefficients.
Tools for investigating time-series data include:
- Consideration of the autocorrelation functionAutocorrelationAutocorrelation is the cross-correlation of a signal with itself. Informally, it is the similarity between observations as a function of the time separation between them...
and the spectral density functionSpectral densityIn statistical signal processing and physics, the spectral density, power spectral density , or energy spectral density , is a positive real function of a frequency variable associated with a stationary stochastic process, or a deterministic function of time, which has dimensions of power per hertz...
(also cross-correlation functions and cross-spectral density functions)
- Performing a Fourier transformFourier transformIn mathematics, Fourier analysis is a subject area which grew from the study of Fourier series. The subject began with the study of the way general functions may be represented by sums of simpler trigonometric functions...
to investigate the series in the frequency domainFrequency domainIn electronics, control systems engineering, and statistics, frequency domain is a term used to describe the domain for analysis of mathematical functions or signals with respect to frequency, rather than time....
- Use of a filterDigital filterIn electronics, computer science and mathematics, a digital filter is a system that performs mathematical operations on a sampled, discrete-time signal to reduce or enhance certain aspects of that signal. This is in contrast to the other major type of electronic filter, the analog filter, which is...
to remove unwanted noise
- Principal components analysisPrincipal components analysisPrincipal component analysis is a mathematical procedure that uses an orthogonal transformation to convert a set of observations of possibly correlated variables into a set of values of uncorrelated variables called principal components. The number of principal components is less than or equal to...
(or empirical orthogonal function analysis)
- Singular spectrum analysisSingular Spectrum AnalysisSingular spectrum analysis combines elements of classical time series analysis, multivariate statistics, multivariate geometry, dynamical systems and signal processing...
- Artificial neural networkArtificial neural networkAn artificial neural network , usually called neural network , is a mathematical model or computational model that is inspired by the structure and/or functional aspects of biological neural networks. A neural network consists of an interconnected group of artificial neurons, and it processes...
s
- Hidden Markov modelHidden Markov modelA hidden Markov model is a statistical Markov model in which the system being modeled is assumed to be a Markov process with unobserved states. An HMM can be considered as the simplest dynamic Bayesian network. The mathematics behind the HMM was developed by L. E...
- Dynamic time warpingDynamic time warpingDynamic time warping is an algorithm for measuring similarity between two sequences which may vary in time or speed. For instance, similarities in walking patterns would be detected, even if in one video the person was walking slowly and if in another he or she were walking more quickly, or even...
- Dynamic Bayesian networkDynamic Bayesian networkA dynamic Bayesian network is a Bayesian network that represents sequences of variables. These sequences are often time-series or sequences of symbols . The hidden Markov model can be considered as a simple dynamic Bayesian network.- References :* , Zoubin Ghahramani, Lecture Notes In Computer...
- Time-frequency analysis techniques:Time-frequency representationA time–frequency representation is a view of a signal represented over both time and frequency. Time–frequency analysis means analysis into the time–frequency domain provided by a TFR...
- Fast Fourier TransformFast Fourier transformA fast Fourier transform is an efficient algorithm to compute the discrete Fourier transform and its inverse. "The FFT has been called the most important numerical algorithm of our lifetime ." There are many distinct FFT algorithms involving a wide range of mathematics, from simple...
- Continuous wavelet transformContinuous wavelet transformA continuous wavelet transform is used to divide a continuous-time function into wavelets. Unlike Fourier transform, the continuous wavelet transform possesses the ability to construct a time-frequency representation of a signal that offers very good time and frequency localization...
- Short-time Fourier transformShort-time Fourier transformThe short-time Fourier transform , or alternatively short-term Fourier transform, is a Fourier-related transform used to determine the sinusoidal frequency and phase content of local sections of a signal as it changes over time....
- Chirplet transformChirplet transformIn signal processing, the chirplet transform is an inner product of an input signal with a family of analysis primitives called chirplets.-Similarity to other transforms:...
- Fractional Fourier transformFractional Fourier transformIn mathematics, in the area of harmonic analysis, the fractional Fourier transform is a linear transformation generalizing the Fourier transform. It can be thought of as the Fourier transform to the n-th power where n need not be an integer — thus, it can transform a function to an...
- Fast Fourier Transform
- Chaotic analysisChaos theoryChaos theory is a field of study in mathematics, with applications in several disciplines including physics, economics, biology, and philosophy. Chaos theory studies the behavior of dynamical systems that are highly sensitive to initial conditions, an effect which is popularly referred to as the...
- Correlation dimensionCorrelation dimensionIn chaos theory, the correlation dimension is a measure of the dimensionality of the space occupied by a set of random points, often referred to as a type of fractal dimension....
- Recurrence plotRecurrence plotIn descriptive statistics and chaos theory, a recurrence plot is a plot showing, for a given moment in time, the times at which a phase space trajectory visits roughly the same area in the phase space...
s - Recurrence quantification analysisRecurrence quantification analysisRecurrence quantification analysis is a method of nonlinear data analysis for the investigation of dynamical systems. It quantifies the number and duration of recurrences of a dynamical system presented by its phase space trajectory....
- Lyapunov exponentLyapunov exponentIn mathematics the Lyapunov exponent or Lyapunov characteristic exponent of a dynamical system is a quantity that characterizes the rate of separation of infinitesimally close trajectories...
s - Entropy encodingEntropy encodingIn information theory an entropy encoding is a lossless data compression scheme that is independent of the specific characteristics of the medium....
- Correlation dimension
See also
- Anomaly time seriesAnomaly time seriesIn atmospheric sciences and some other applications of statistics, an anomaly time series is the time series of deviations of a quantity from some mean. Similarly a standardized anomaly series contains values of deviations divided by a standard deviation...
- Decomposition of time series
- Seasonal adjustmentSeasonal adjustmentSeasonal adjustment is a statistical method for removing the seasonal component of a time series that is used when analyzing non-seasonal trends. It is normal to report un-adjusted data for current unemployment rates, as these reflect the actual current situation...
- Signal processingSignal processingSignal processing is an area of systems engineering, electrical engineering and applied mathematics that deals with operations on or analysis of signals, in either discrete or continuous time...
- Trend estimationTrend estimationTrend estimation is a statistical technique to aid interpretation of data. When a series of measurements of a process are treated as a time series, trend estimation can be used to make and justify statements about tendencies in the data...
Further reading
- Bloomfield, P. (1976). Fourier analysis of time series: An introduction. New York: Wiley.
- Brillinger, D. R. (1975). Time series: Data analysis and theory. New York: Holt, Rinehart. & Winston.
- Brigham, E. O. (1974). The fast Fourier transform. Englewood Cliffs, NJ: Prentice-Hall.
- Elliott, D. F., & Rao, K. R. (1982). Fast transforms: Algorithms, analyses, applications. New York: Academic Press.
- Jenkins, G. M., & Watts, D. G. (1968). Spectral analysis and its applications. San Francisco: Holden-Day.
- Priestley, M. B. (1981). Spectral analysis and time series. New York: Academic Press.
- Shumway, R. H. (1988). Applied statistical time series analysis. Englewood Cliffs, NJ: Prentice Hall.
- Wiener, N.(1964). Extrapolation, Interpolation, and Smoothing of Stationary Time Series.The MIT Press.
- Wei, W. W. (1989). Time series analysis: Univariate and multivariate methods. New York: Addison-Wesley.
- Weigend, A. S., and N. A. Gershenfeld (Eds.) (1994) Time Series Prediction: Forecasting the Future and Understanding the Past. Proceedings of the NATO Advanced Research Workshop on Comparative Time Series Analysis (Santa Fe, May 1992) MA: Addison-Wesley.
- Durbin J., and Koopman S.J. (2001) Time Series Analysis by State Space Methods. Oxford University Press.
External links
- A First Course on Time Series Analysis - an open source book on time series analysis with SAS
- Introduction to Time series Analysis (Engineering Statistics Handbook) - A practical guide to Time series analysis
- List of Free Software for Time Series Analysis
- Online Tutorial 'Recurrence Plot' (Flash animation); lots of examples
- Measuring the "Complexity" of a time series
- Measures of Analysis of Time Series toolkit (MATLAB)
- iSAX: Indexing and Mining Terabyte Sized Time Series
- Harvard Time Series Center
- STATStream: a Toolkit for High Speed Statistical Time Series Analysis
- Data Stream Algorithms
- Bibliography of symbolic time-series analysis
- The Santa Fe Time Series Competition Data