
GGobi
Encyclopedia
GGobi is a free
statistical software tool used for graphing various types of data
. GGobi allows extensive exploration of the data with Interactive dynamic graphics
. It is also a tool for looking at multivariate data. R
can be used in sync with GGobi (through rggobi). GGobi prides itself on its ability to link multiple graphs together.
and the Gobi Desert
). The original concept, Dataviewer, began in the mid-80s, and a predecessor, XGobi, began in 1989. Work began on the current version of GGobi in 1999. The main reason for the different versions was the change in technology.
Released under a combination of three free software licenses, GGobi is free software
.
to occur for multi-dimensional data.
Free software
Free software, software libre or libre software is software that can be used, studied, and modified without restriction, and which can be copied and redistributed in modified or unmodified form either without restriction, or with restrictions that only ensure that further recipients can also do...
statistical software tool used for graphing various types of data
Data
The term data refers to qualitative or quantitative attributes of a variable or set of variables. Data are typically the results of measurements and can be the basis of graphs, images, or observations of a set of variables. Data are often viewed as the lowest level of abstraction from which...
. GGobi allows extensive exploration of the data with Interactive dynamic graphics
Graphics
Graphics are visual presentations on some surface, such as a wall, canvas, computer screen, paper, or stone to brand, inform, illustrate, or entertain. Examples are photographs, drawings, Line Art, graphs, diagrams, typography, numbers, symbols, geometric designs, maps, engineering drawings,or...
. It is also a tool for looking at multivariate data. R
R (programming language)
R is a programming language and software environment for statistical computing and graphics. The R language is widely used among statisticians for developing statistical software, and R is widely used for statistical software development and data analysis....
can be used in sync with GGobi (through rggobi). GGobi prides itself on its ability to link multiple graphs together.
Overview
GGobi was created to look at data matrices. The designers were interested in exploring multi-dimensional data. The program developers went through many name changes before settling on GGobi (A combination of the words GTK+GTK+
GTK+ is a cross-platform widget toolkit for creating graphical user interfaces. It is licensed under the terms of the GNU LGPL, allowing both free and proprietary software to use it. It is one of the most popular toolkits for the X Window System, along with Qt.The name GTK+ originates from GTK;...
and the Gobi Desert
Gobi Desert
The Gobi is a large desert region in Asia. It covers parts of northern and northwestern China, and of southern Mongolia. The desert basins of the Gobi are bounded by the Altai Mountains and the grasslands and steppes of Mongolia on the north, by the Hexi Corridor and Tibetan Plateau to the...
). The original concept, Dataviewer, began in the mid-80s, and a predecessor, XGobi, began in 1989. Work began on the current version of GGobi in 1999. The main reason for the different versions was the change in technology.
Released under a combination of three free software licenses, GGobi is free software
Free software
Free software, software libre or libre software is software that can be used, studied, and modified without restriction, and which can be copied and redistributed in modified or unmodified form either without restriction, or with restrictions that only ensure that further recipients can also do...
.
GGobi Topics
Importance of graphics
Looking at data through various graphs can reveal more information about the distribution than just looking at the numbers or a summary of them. Using the different tools within GGobi, clusters, non-linear distributions, outliers, and other important variations in the data can be discovered. GGobi is a program which allows exploratory data analysisExploratory data analysis
In statistics, exploratory data analysis is an approach to analysing data sets to summarize their main characteristics in easy-to-understand form, often with visual graphs, without using a statistical model or having formulated a hypothesis...
to occur for multi-dimensional data.
Types of graphics
- 1D: Average shifted histogram, textured dot plot, barchart, spineplot
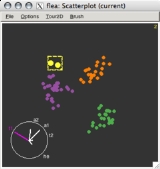
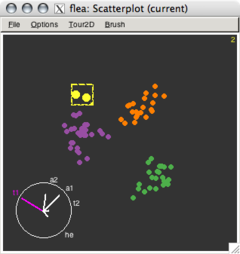
- 2D: ScatterplotScatterplotA scatter plot or scattergraph is a type of mathematical diagram using Cartesian coordinates to display values for two variables for a set of data....
- High-D:
- Scatterplot matrix
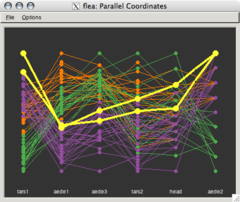
- Parallel coordinatesParallel coordinatesParallel coordinates is a common way of visualizing high-dimensional geometry and analyzing multivariate data.To show a set of points in an n-dimensional space, a backdrop is drawn consisting of n parallel lines, typically vertical and equally spaced...
- Grand tour, projection pursuitProjection pursuitProjection pursuit is a type of statistical technique which involves finding the most "interesting" possible projections in multidimensional data. Often, projections which deviate more from a Normal distribution are considered to be more interesting...
guided tour, manual tour
- Time series plot
Interactions
These tools can be used to pick out special points or clusters of data.- BrushingBrushing and linkingIn databases, brushing and linking refers to the connection of two or more views of the same data, such that a change to the representation in one view affects the representation in the other....
- As the brush moves over a point, the point will be highlighted.
- If "persistent" is selected, the points the brush has moved over will remain "painted".
- Identify
- As the cursor moves over a point, a label, or variable value will appear at the top of the graphic screen.
- Linking
- Multiple plots are linked so identifying one point in one plot will identify the same point on all other graphs, and brushing a group of points in one plot will highlight the same points in other plots. The linking can be one-to-one, or according to the values of a categorical variable in the data set.
- Moving points
- Points in a plot can be moved interactively, eg to gauge results from multidimensional scaling.
- Add/remove points or edges.
Further reading
- Buja, A., D. Cook, and D.F. Swayne (March 1998). "XGobi: Interactive Dynamic Data Visualization in the X Window System". in: Journal of Computational and Graphical Statistics 7 (1): 113–130.
- Buja, A., D.T. Lang, and D.F. Swayne (August 28, 2003). "GGobi: Evolving From XGobi into an Extensible Framework for Interactive Data Visualization". In: Journal of Computational Statistics and Data Analysis 43 (4): 423–444.
- Cook, D. and D.F. Swayne (2007). Interactive and Dynamic Graphics for Data Analysis. Springer.
External links
- GGobi Data Visualization System
- rggobi is an R package that interfaces R and GGobi.
- GGobi blog
- References to GGobi on the web include links at Humboldt University http://statwiki.wiwi.hu-berlin.de/index.php/GGobi, Ubuntu http://packages.ubuntu.com/de/hardy/math/ggobi, Debian http://packages.debian.org/de/etch/ggobi, Freshmeat http://freshmeat.net/projects/ggobi/, Hugh-Public http://florence.acadiau.ca/collab/hugh_public/index.php?title=GGobi_Intro, Softpedia http://linux.softpedia.com/progDownload/GGobi-Download-29683.html.