

Flammability diagram
Encyclopedia
Oxygen
Oxygen is the element with atomic number 8 and represented by the symbol O. Its name derives from the Greek roots ὀξύς and -γενής , because at the time of naming, it was mistakenly thought that all acids required oxygen in their composition...
and an inert gas, typically nitrogen
Nitrogen
Nitrogen is a chemical element that has the symbol N, atomic number of 7 and atomic mass 14.00674 u. Elemental nitrogen is a colorless, odorless, tasteless, and mostly inert diatomic gas at standard conditions, constituting 78.08% by volume of Earth's atmosphere...
. Mixtures of the three gasses are usually depicted in a triangular diagram, also known as a Ternary plot
Ternary plot
A ternary plot, ternary graph, triangle plot, simplex plot, or de Finetti diagram is a barycentric plot on three variables which sum to a constant. It graphically depicts the ratios of the three variables as positions in an equilateral triangle...
. Such diagrams are available in the speciality literature. The same information can be depicted in a normal orthogonal diagram, showing only two substances, implicitly using that the sum of all three components are 100 percent. The diagrams below only concerns one fuel, the diagrams can be generalized to mixtures of fuels.
Understanding flammability diagrams
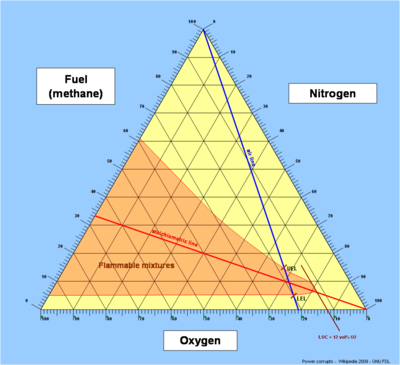
Triangular diagrams are not commonplace. The easiest way to understand them is to briefly go through three basic steps in their construction.- Consider the first triangular diagram below, which shows all possible mixtures of methane, oxygen and nitrogen. Air is a mixture of about 21 volume percent oxygen, and 79 volume percent inerts (nitrogen). Any mixture of methane and air will therefore lie on the straight line between pure methane and pure air - this is shown as the blue air-line. The upper and lower flammability limits of methane in air are located on this line, as shown.
- The stoichiometric combustion of methane is: CH4 + 2O2 -> CO2 + 2H2O. The stoichiometric concentration of methane in oxygen is therefore 1/(1+2), which is 33 percent. Any stoichiometric mixture of methane and oxygen will lie on the straight line between pure nitrogen (and zero percent methane) and 33 percent methane (and 67 percent oxygen) - this is shown as the red stoichiometric line. The upper and lower flammability limits of methane in oxygen are located on the methane axis, as shown.
- The actual envelope defining the flammability zone can only be determined based on experiments. The envelope will pass through the upper and lower flammability limits of methane in oxygen and in air, as shown. The nose of the envelope defines the limiting oxygen concentrationLimiting oxygen concentrationthumb|500px|right|[[Flammability diagram]], green dotted line shows safe purging of an air-filled vessel, first with nitrogen, then with methane, to avoid the flammable region...
(LOC)).